Consumer sentiment fell for the fourth straight month…[The decline was] pervasive and unanimous across age, income, education, geographic region, and political affiliation…[and] expectations for business conditions, personal finances, incomes, inflation, and labor markets all continued to deteriorate… Year-ahead inflation expectations surged to 6.5%, the highest reading since 1981.” University of Michigan Surveys of Consumers, Director Joanne Hsu, April 2025.
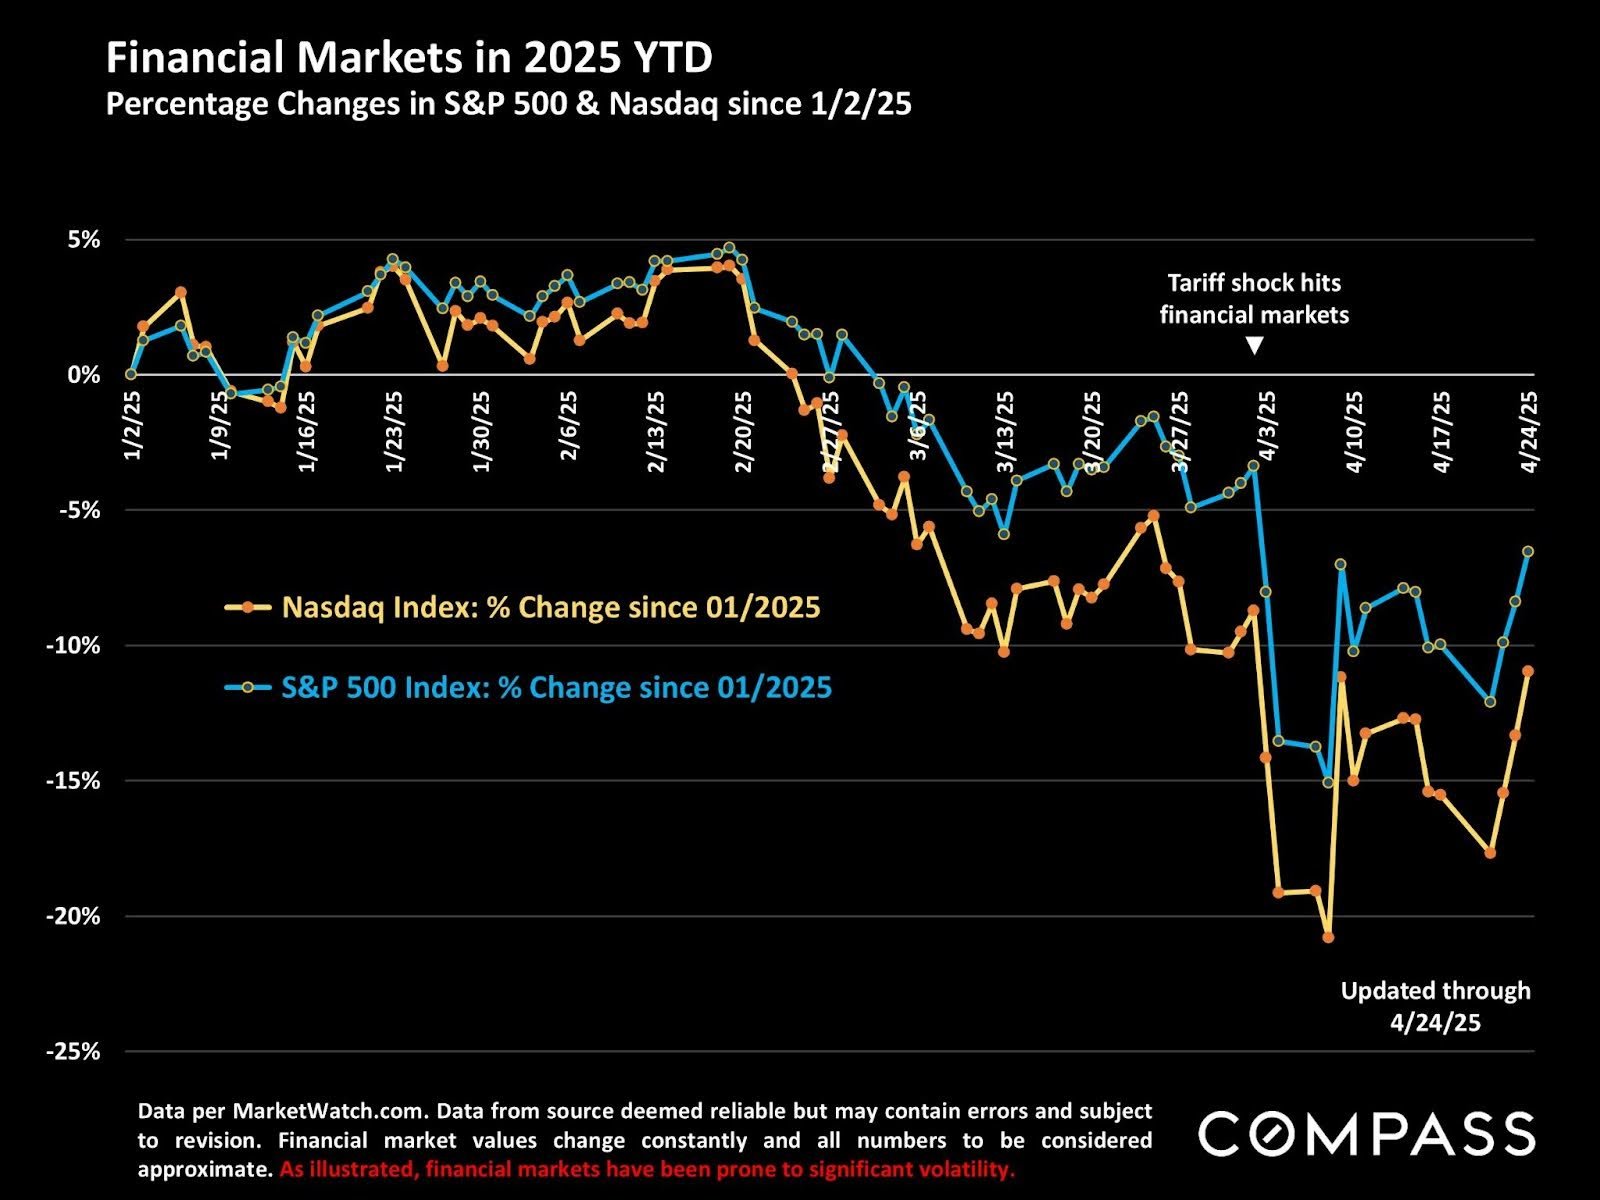
An extremely volatile month in financial markets, often seeing dramatic shifts up and down based upon a single tweet or quote from a member of the administration, someone on the Board of the Federal Reserve, or other highly placed economic or political figures. (Or perhaps the use of a Magic 8 ball.) Of course, the biggest factors are the sudden, enormous changes - sometimes complete reversals - to previously announced governmental policies.
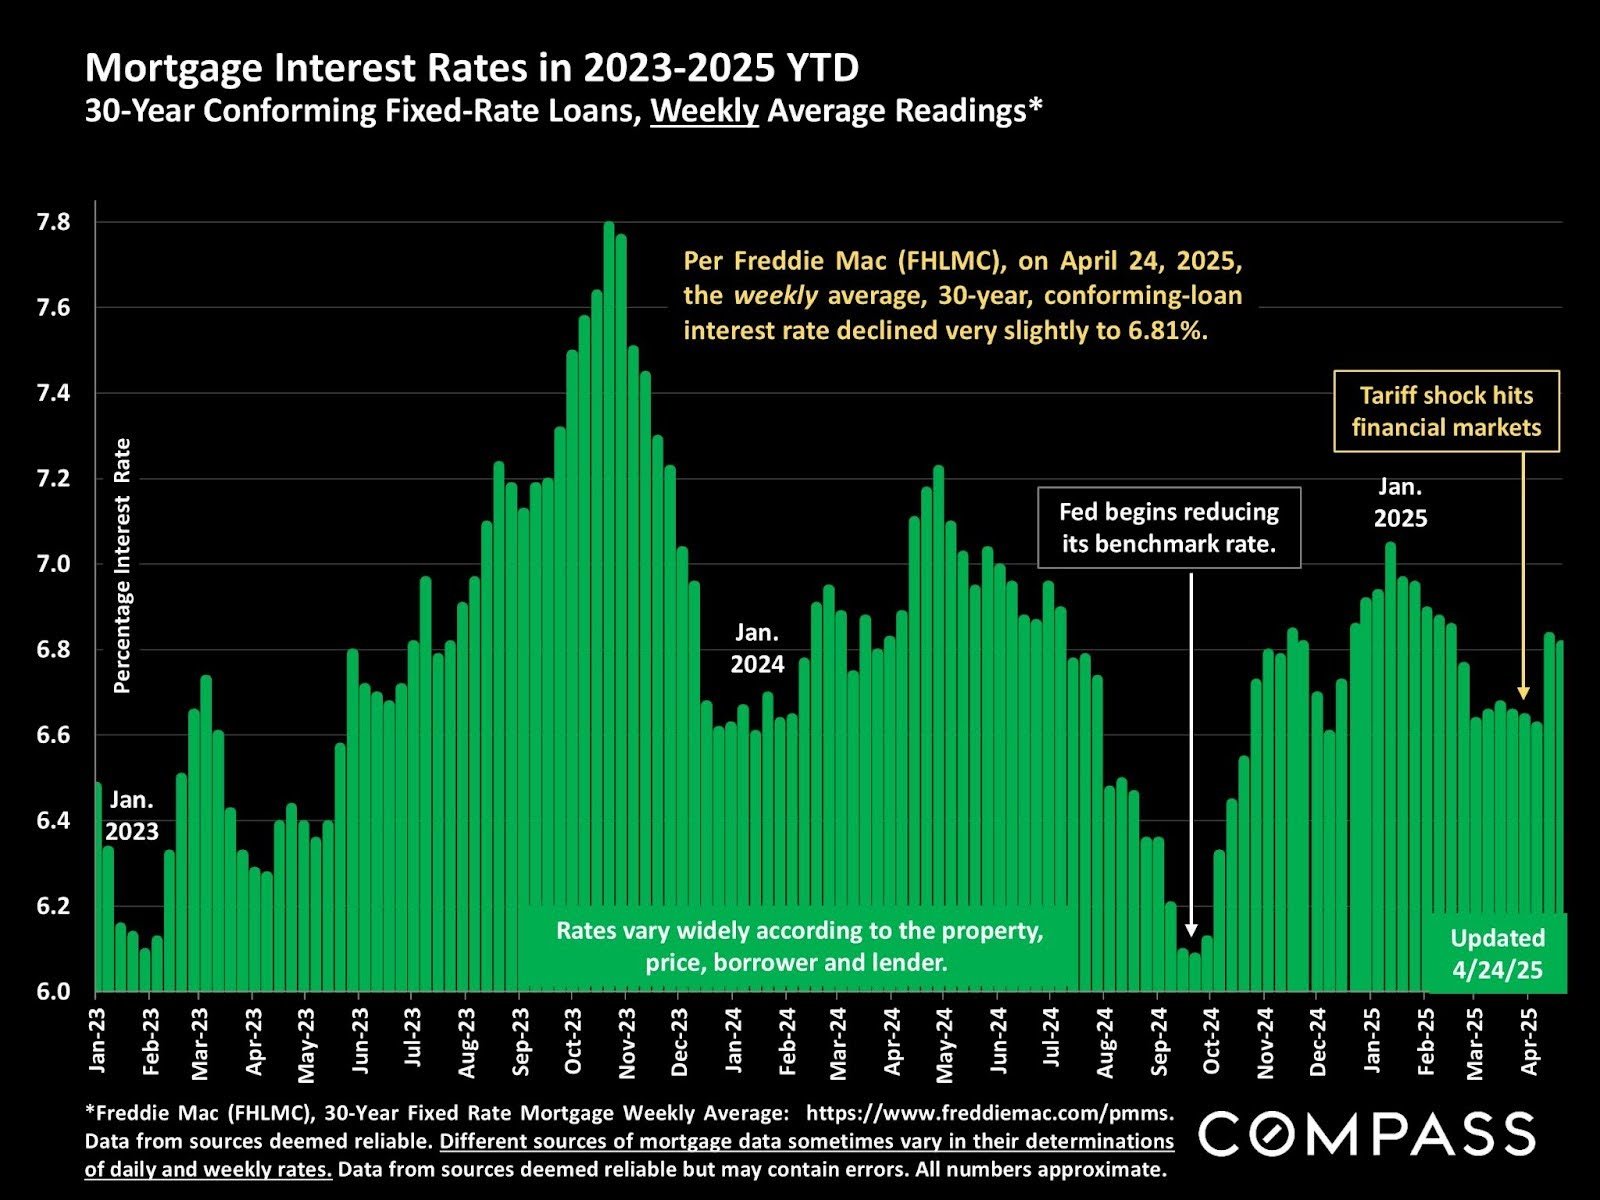
Interest rates have risen in the last 2 months as bond markets wrestled with the possible ramifications to the ever-changing policies emanating from Washington. Some Fed members made remarks in the last few days suggesting the Fed's benchmark rate may be dropped sooner than expected (an idea that investors like), but it may be that mortgage interest rates are becoming increasingly disconnected from the Fed's actions and tied to other economic conditions and expectations affecting the bond market (federal debt levels, foreign ownership of U.S. treasuries, confidence in the dollar and in the U.S. economy generally, and so on).
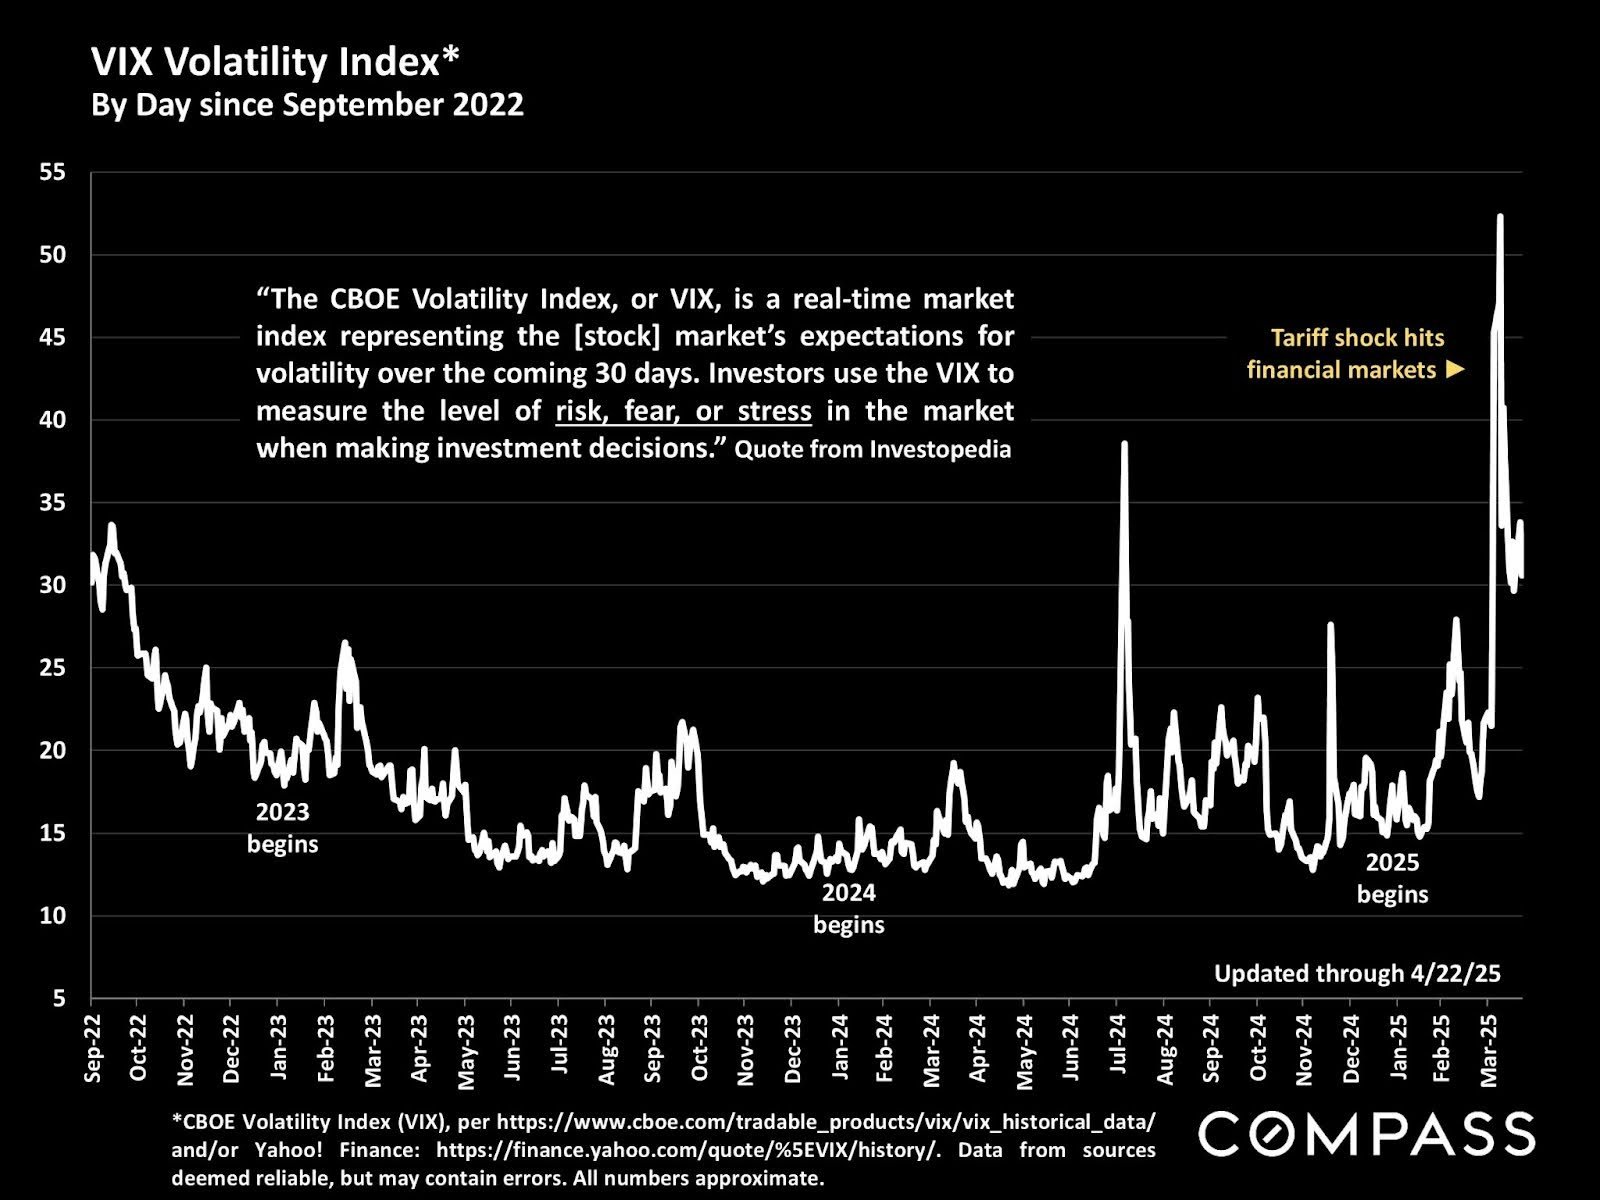
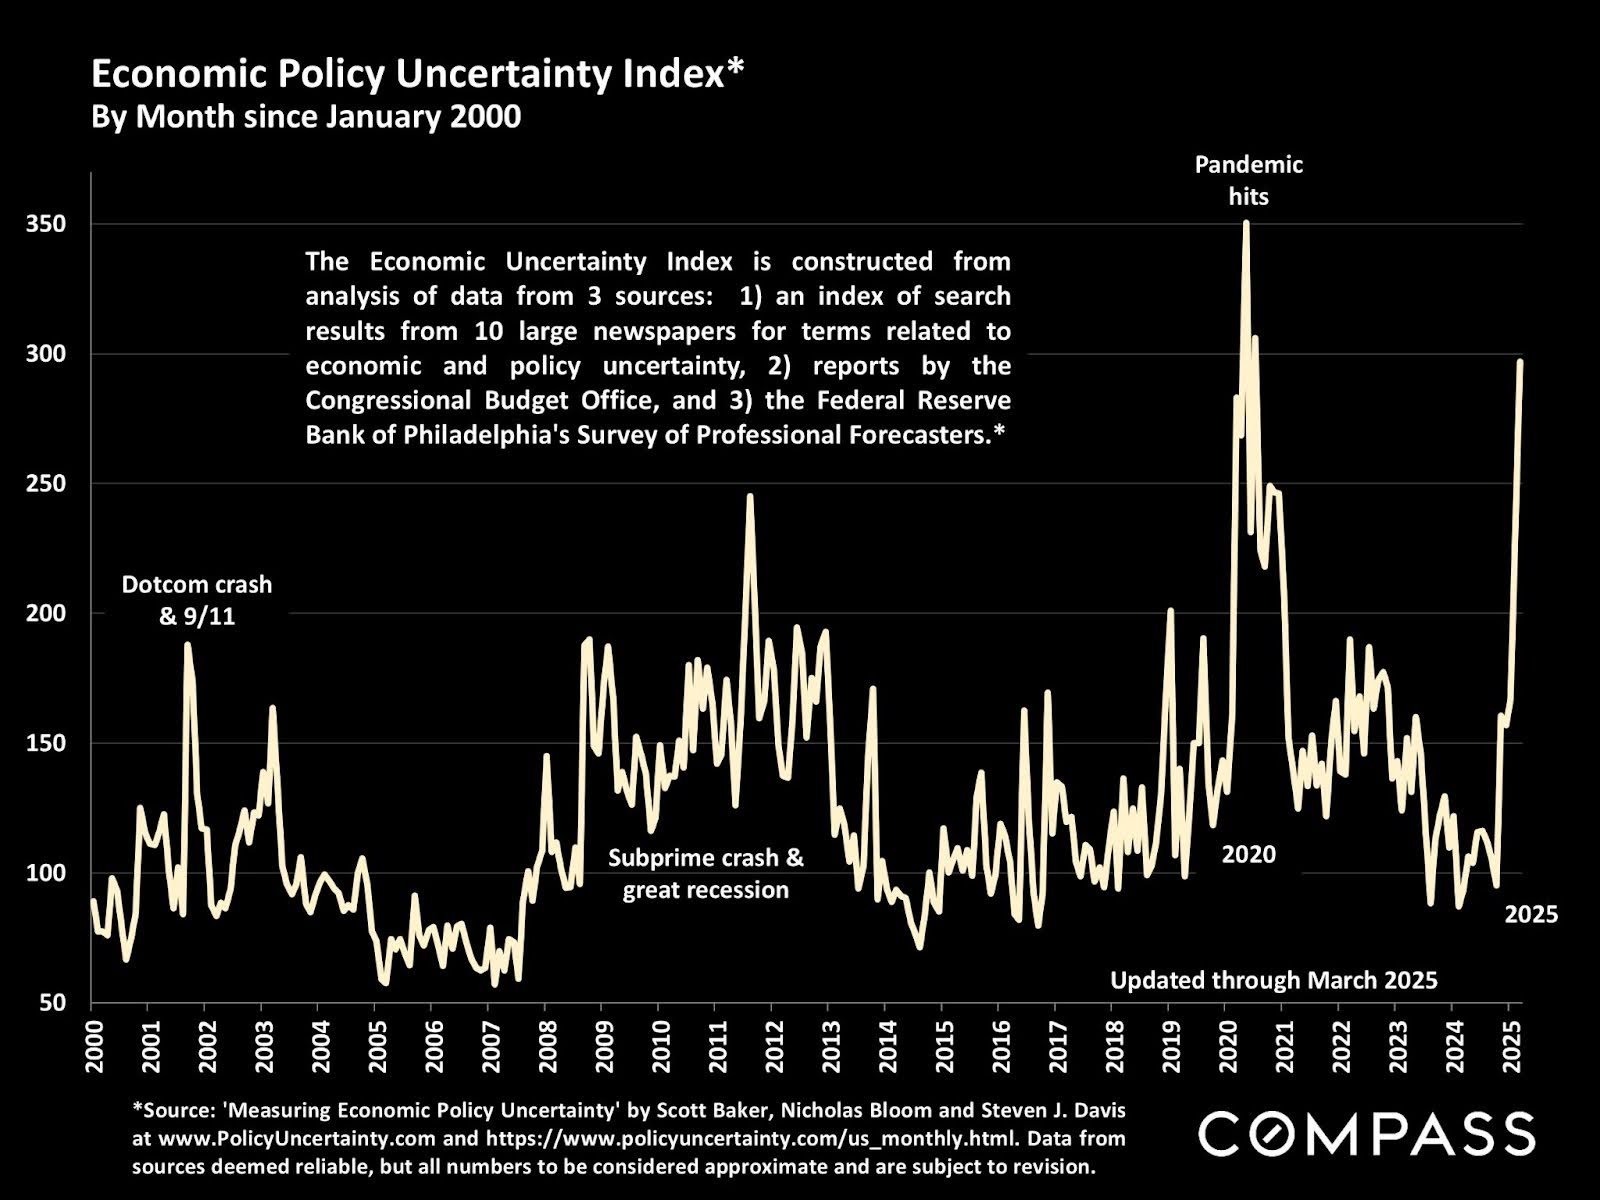
Two different measurements of volatility and uncertainty, the first of which fluctuates on a daily basis, the second of which is issued monthly: Unsurprisingly their trend lines are quite similar.
The Economic Policy Uncertainty Index in March hit its highest point since the pandemic struck, and it's almost certain to rise further for the month of April.
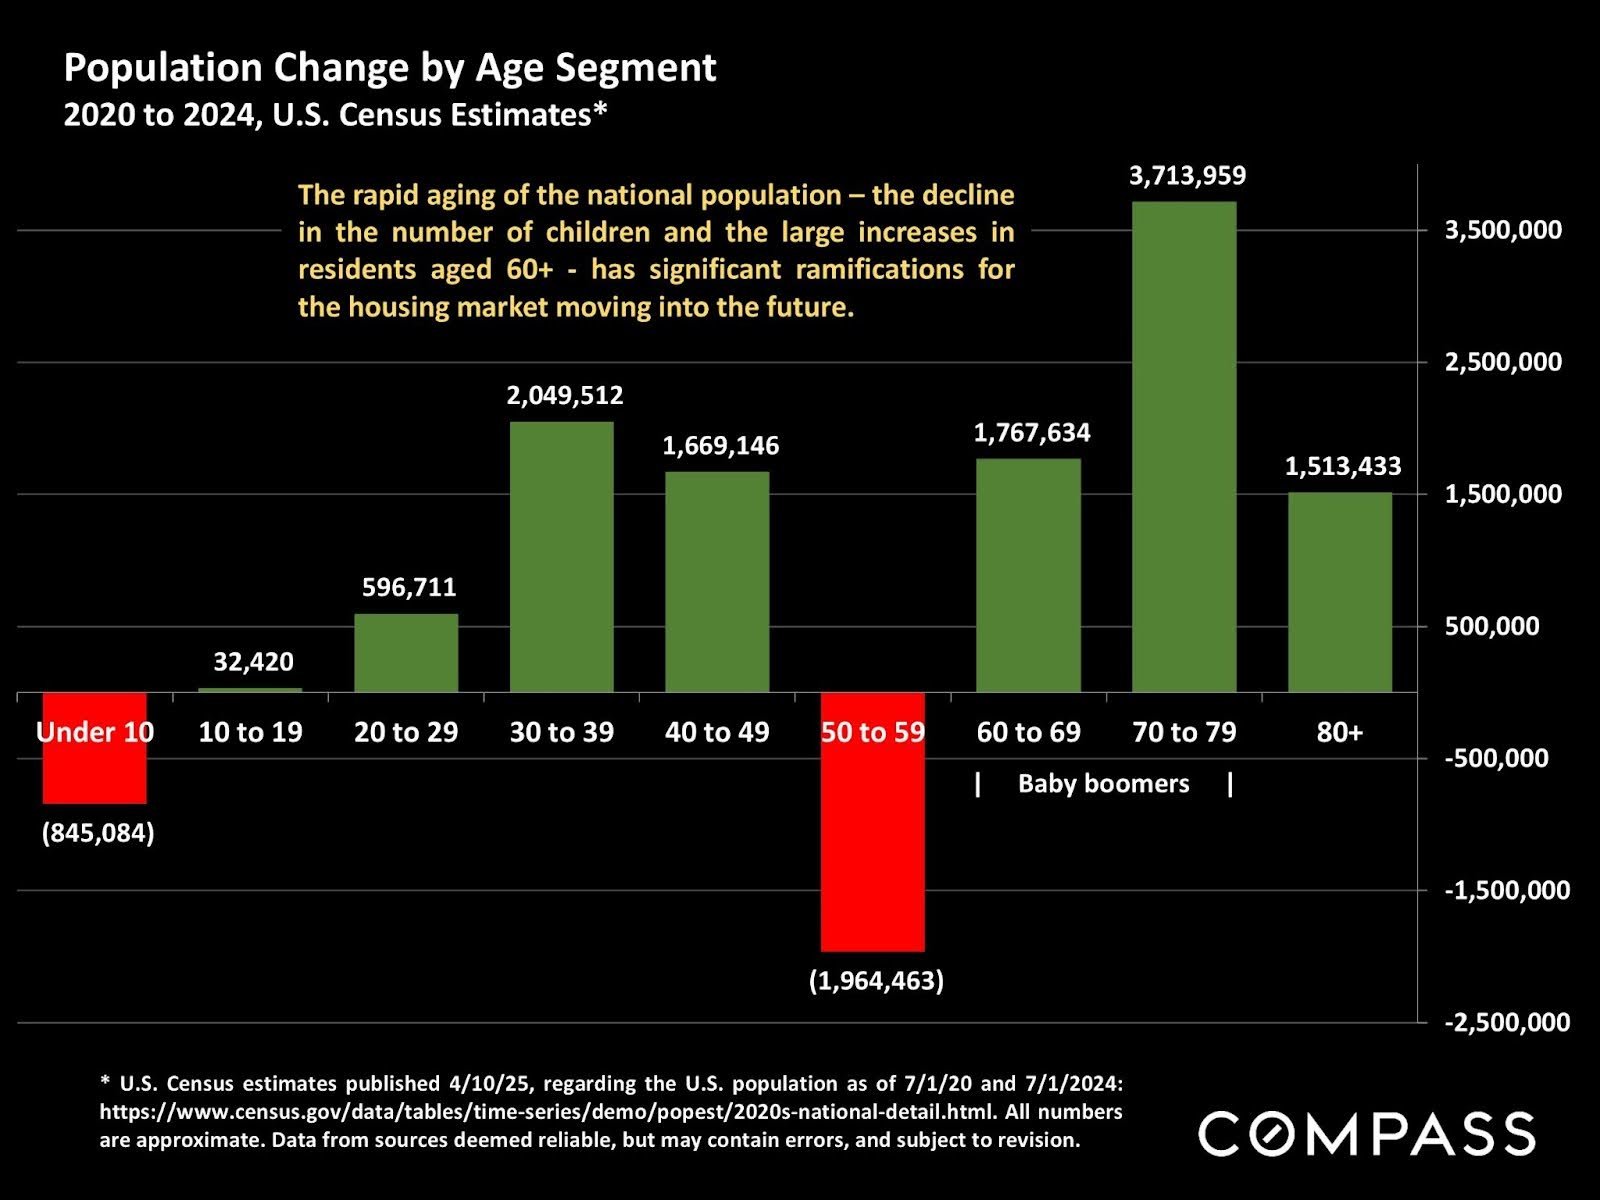
Demographic snapshot: The country is getting older very quickly, which is affecting housing markets, and will affect them even more in coming years as the baby boomer generation moves into the most advanced age segments.
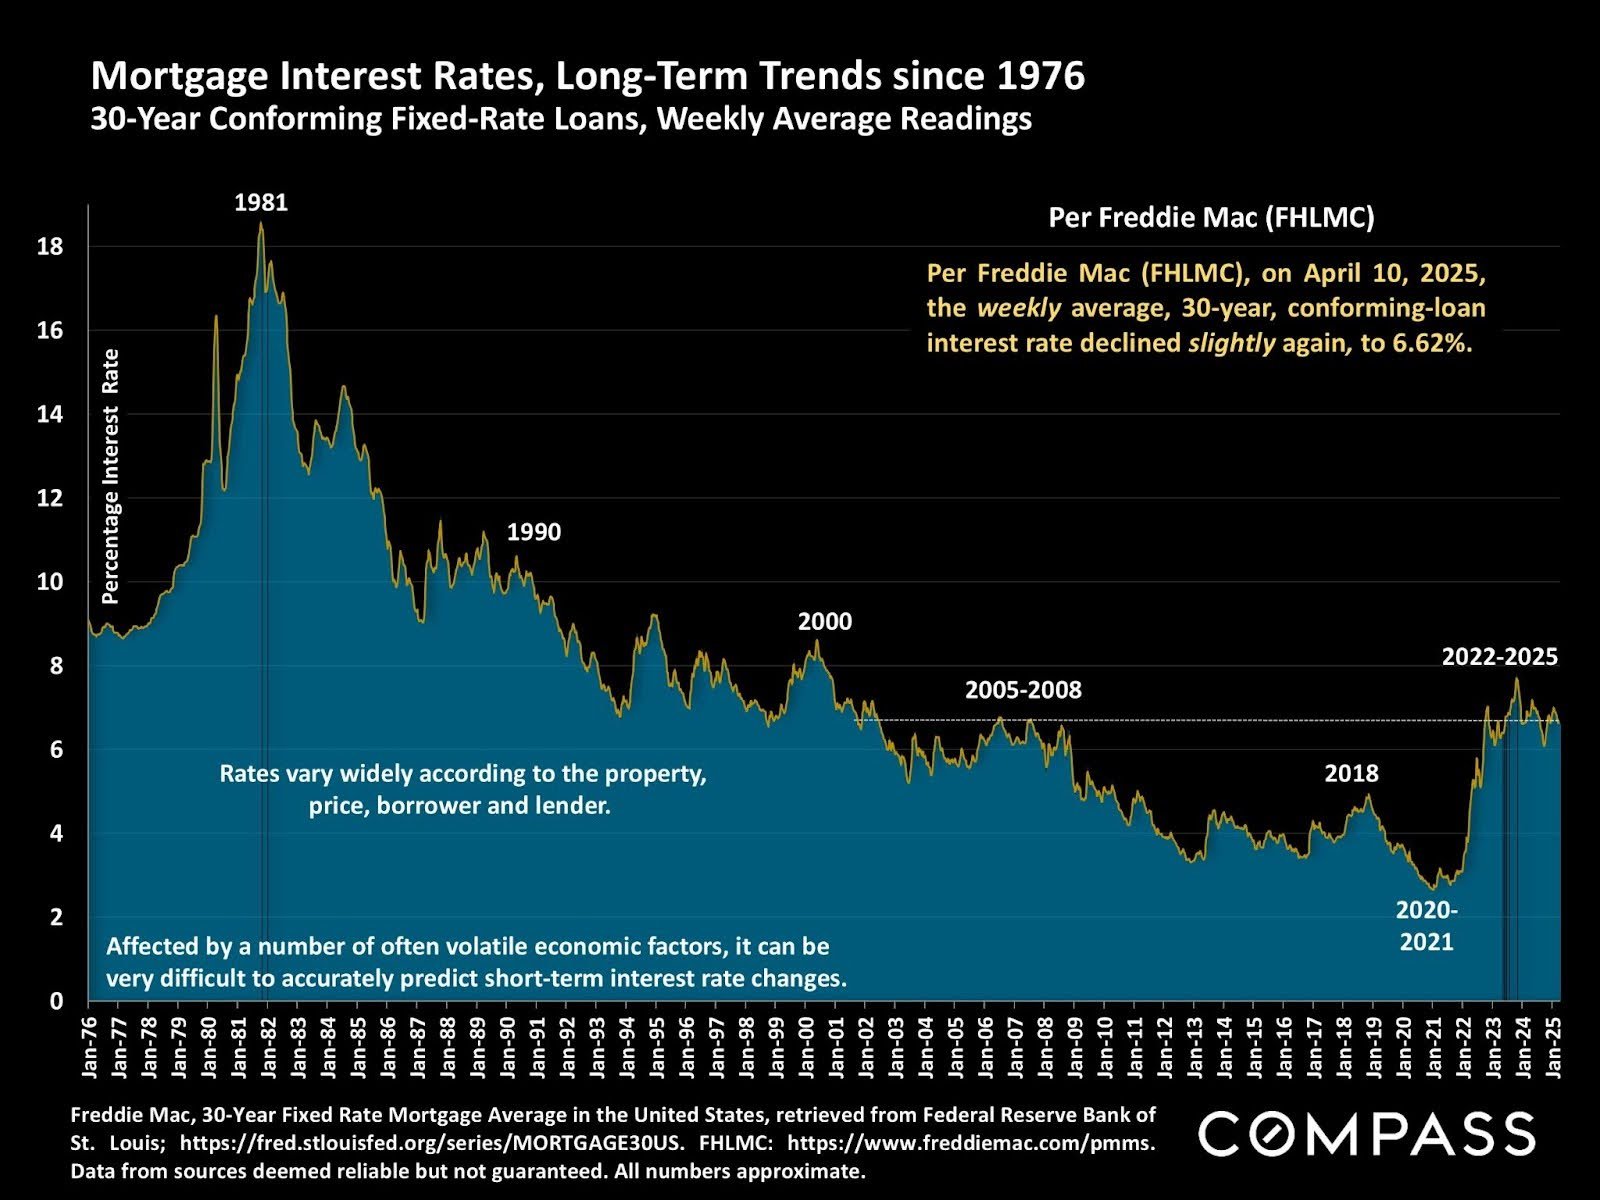
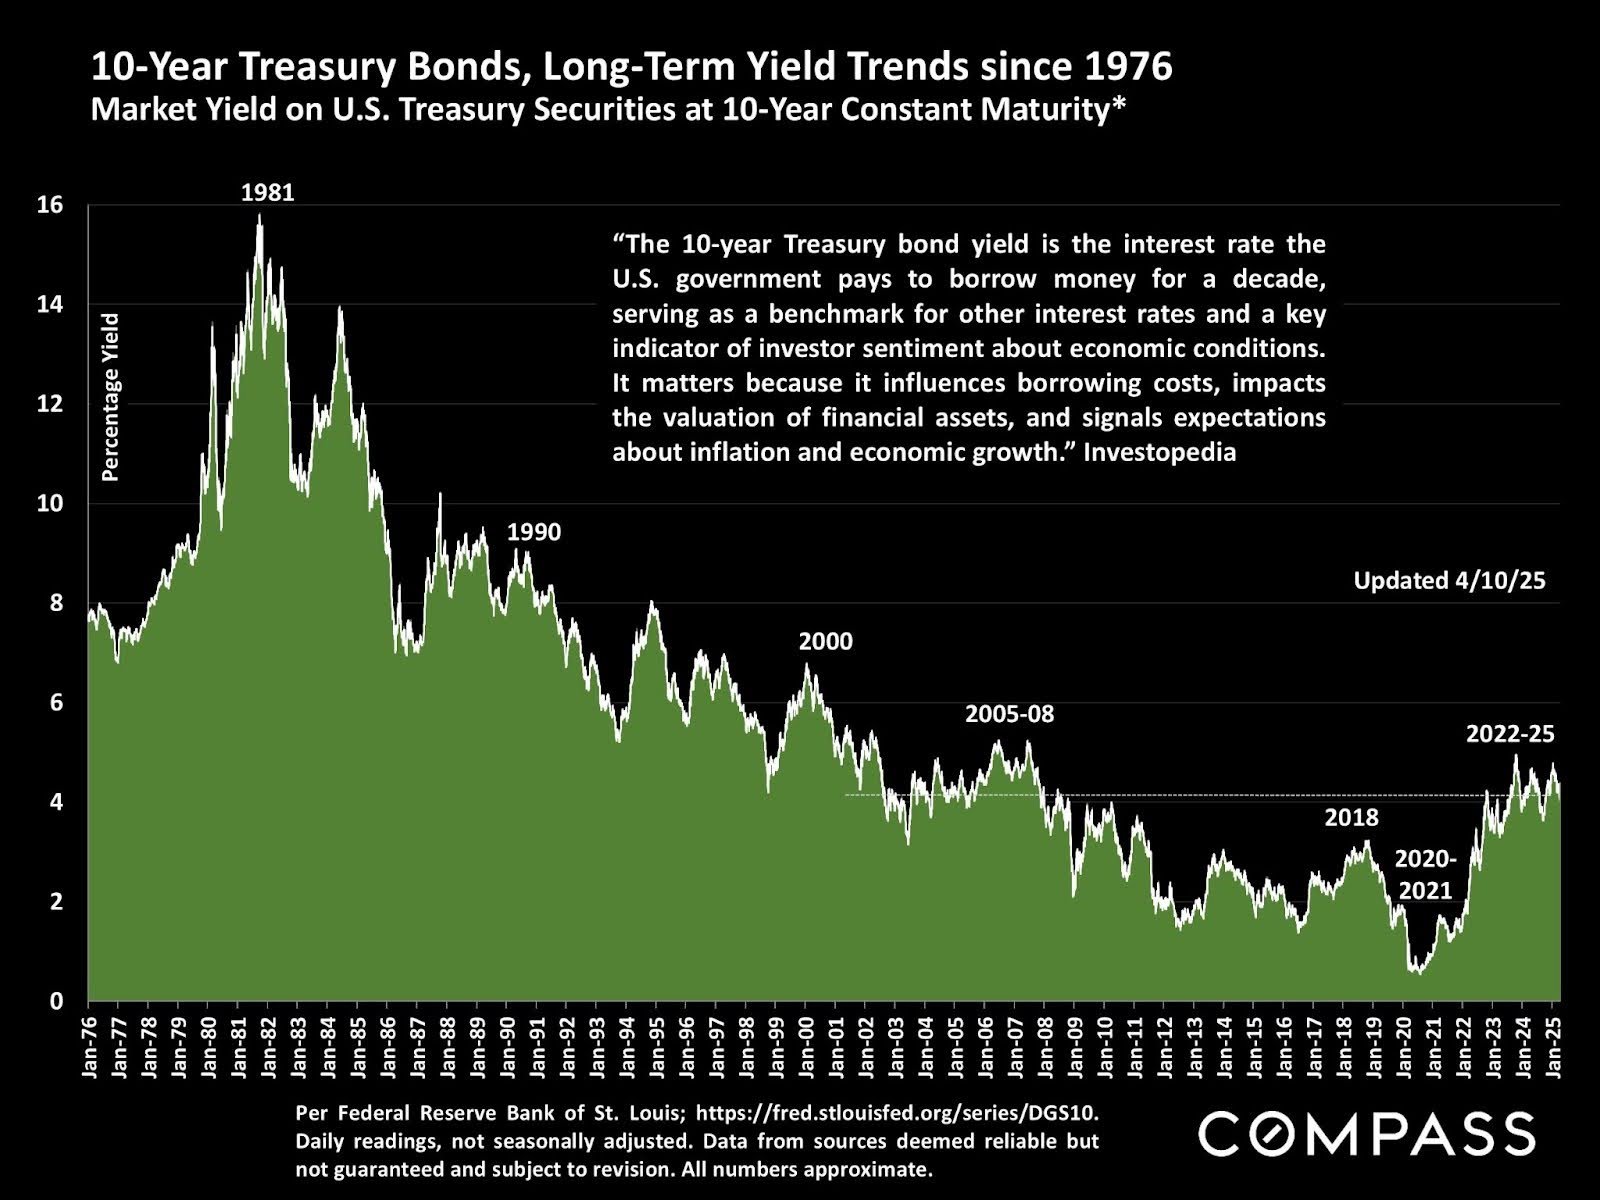
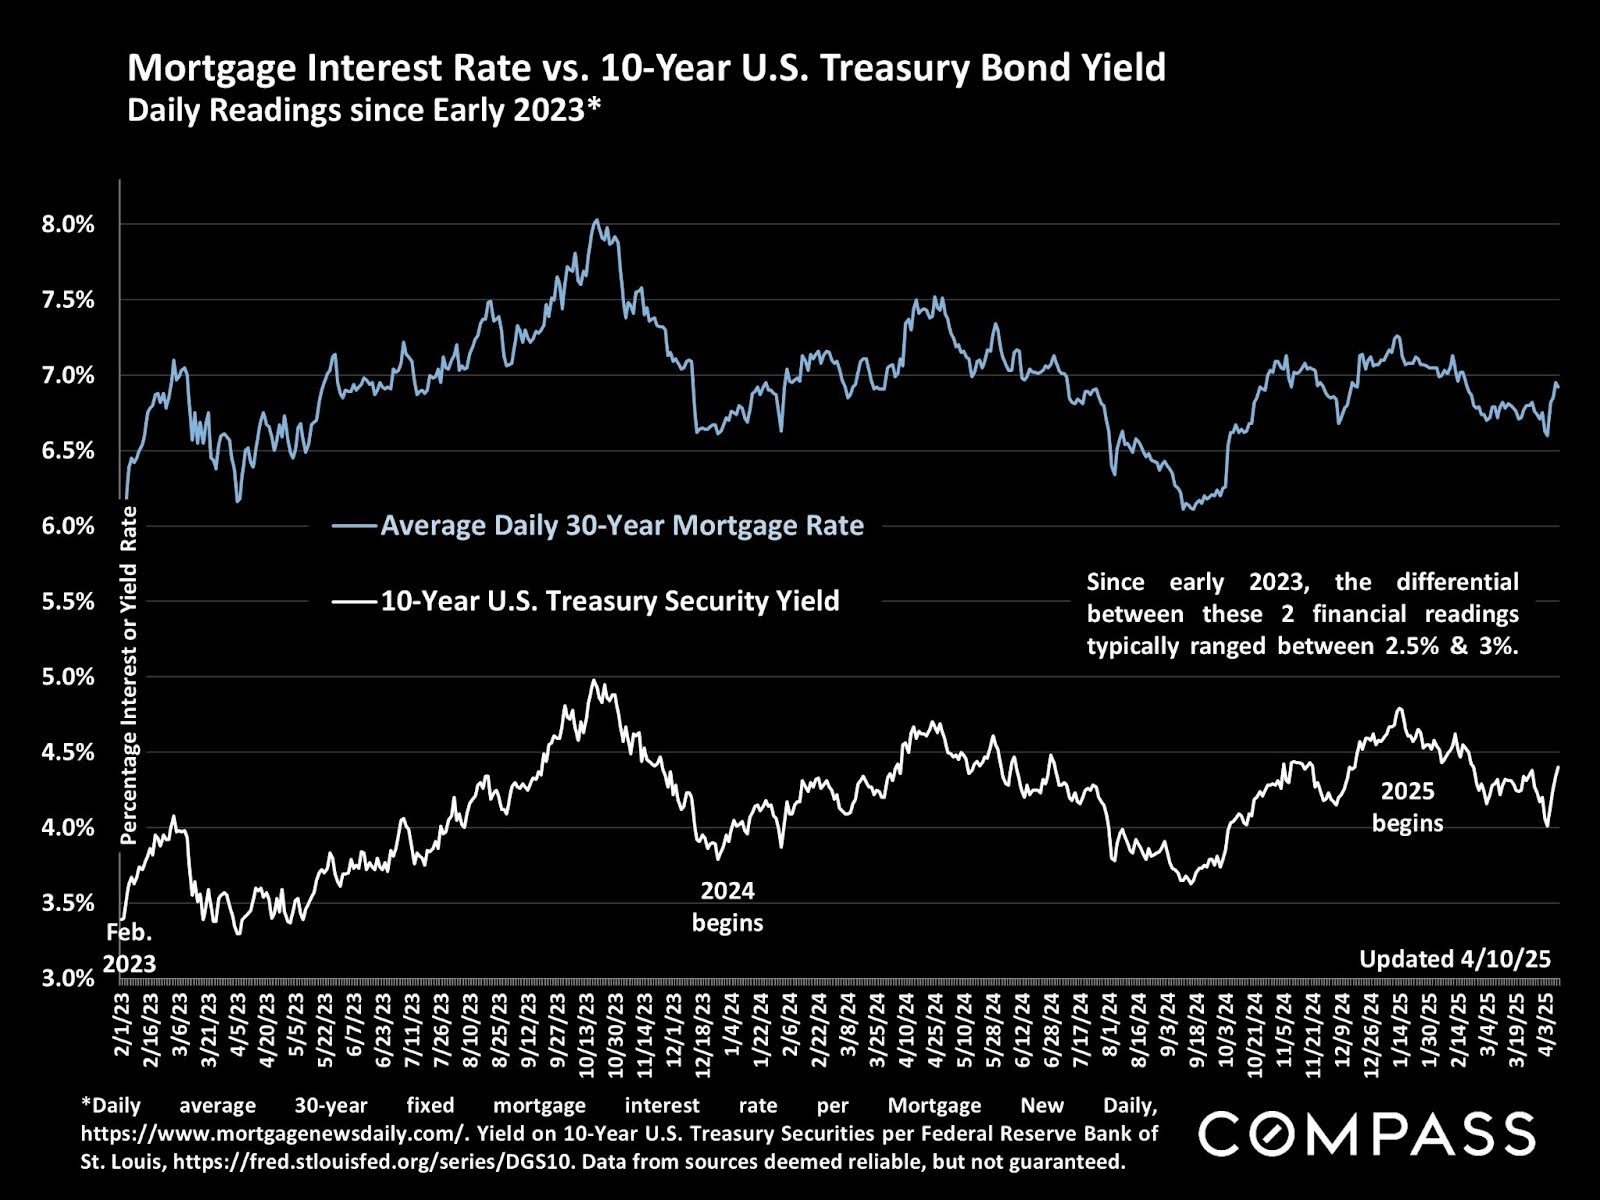
Most financial media - such as the WSJ and Bloomberg News - cover 10-Year U.S. Treasury Security Yields as they do stock market prices. (They do not cover mortgage rates in a similar manner). Below are 3 charts that illustrate 30-year fixed loan rates and yields on 10-year treasuries since 1976, and a shorter-term comparison between the two. Interesting to see how closely they parallel each other, though interest rates typically run 2.5% to 3% higher than Treasury yields.
30-Year Fixed Loan Rate chart:
10-Year U.S. Treasury Bond Yield chart:
Comparison of the 2 over the last couple years:
An extended compilation of charts pertaining to macroeconomic indicators can be found in flipbook format here.

Selected Economic Indicators
- April 28, 2025