San Francisco Quaterly Market Update

San Francisco Quaterly Market Update

  • Faber Real Estate Team
  • October 27, 2020

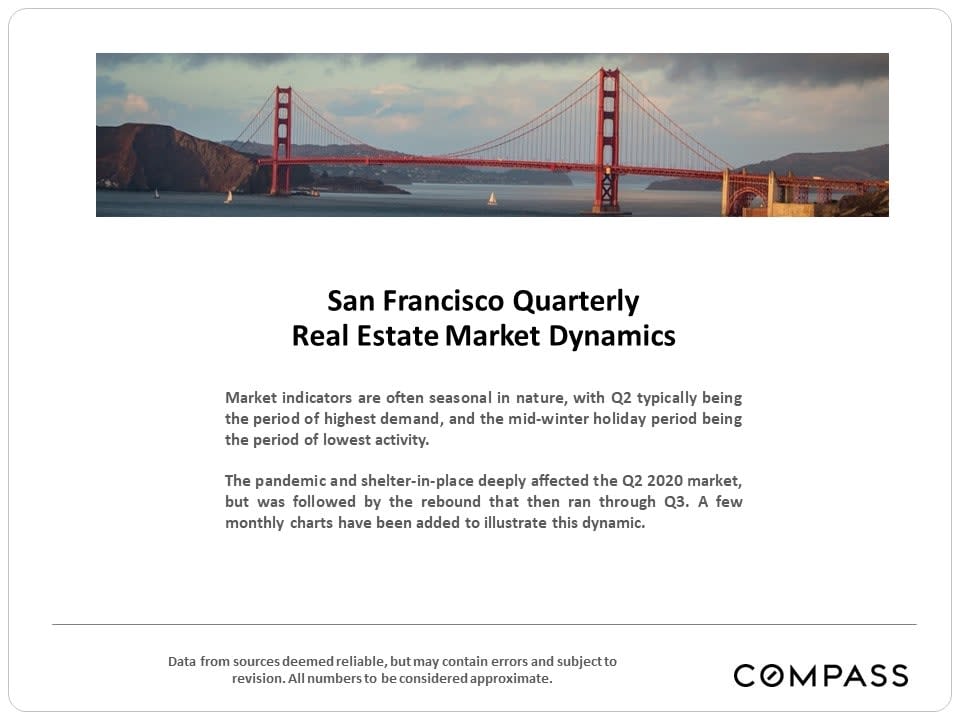
San Francisco real estate market update with a Golden Gate Bridge banner and Q2 2020 market commentary.

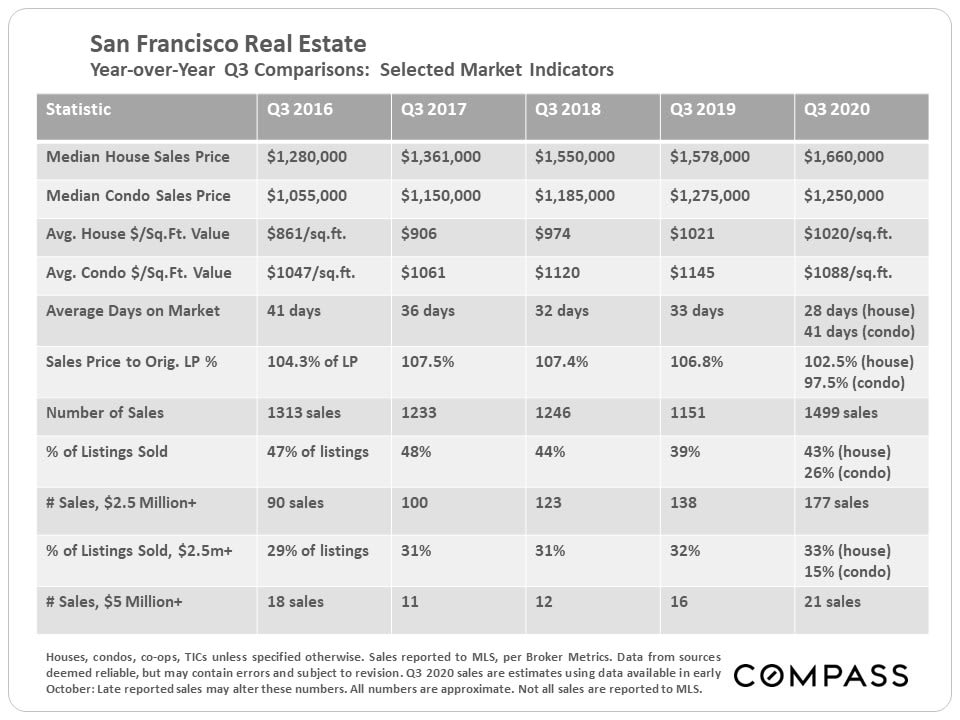
San Francisco real estate Q3 comparison table for 2016–2020, covering prices, sales, and market activity.

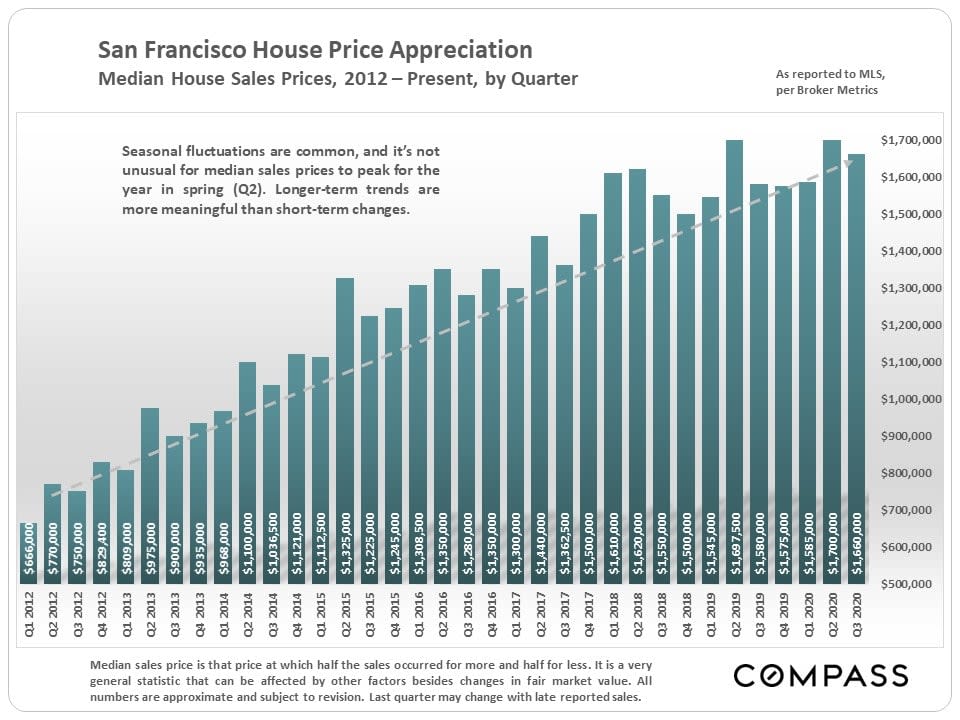
Chart of San Francisco median house prices by quarter, rising from about $666,000 in 2012 to $1.66 million in 2020.

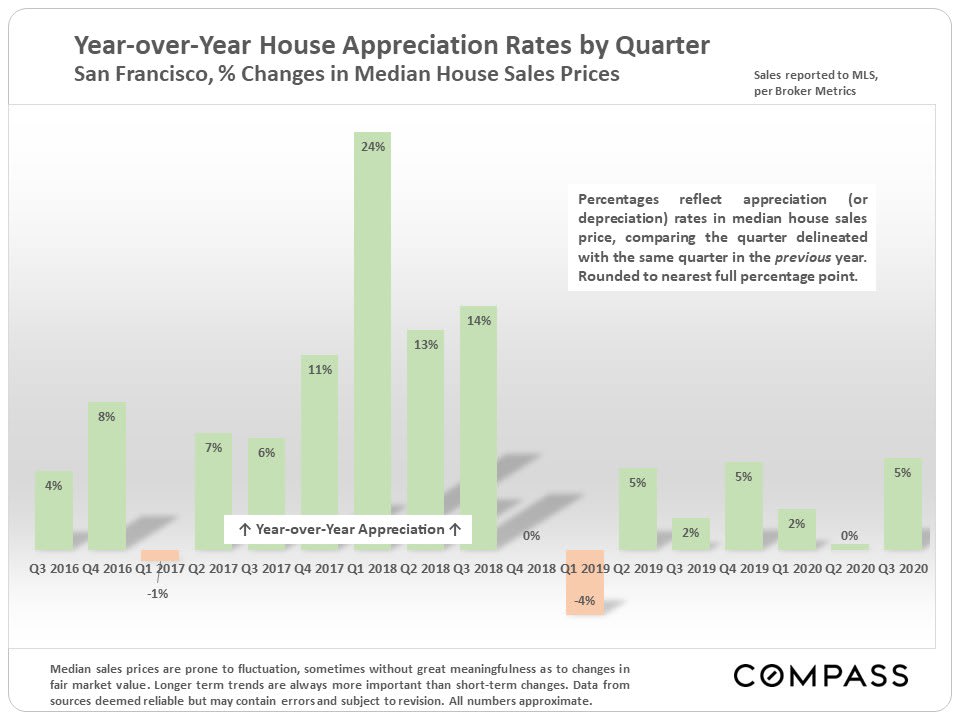
San Francisco quarterly house-price appreciation chart, with a 24% peak in Q1 2018 and a 4% decline in Q1 2019.

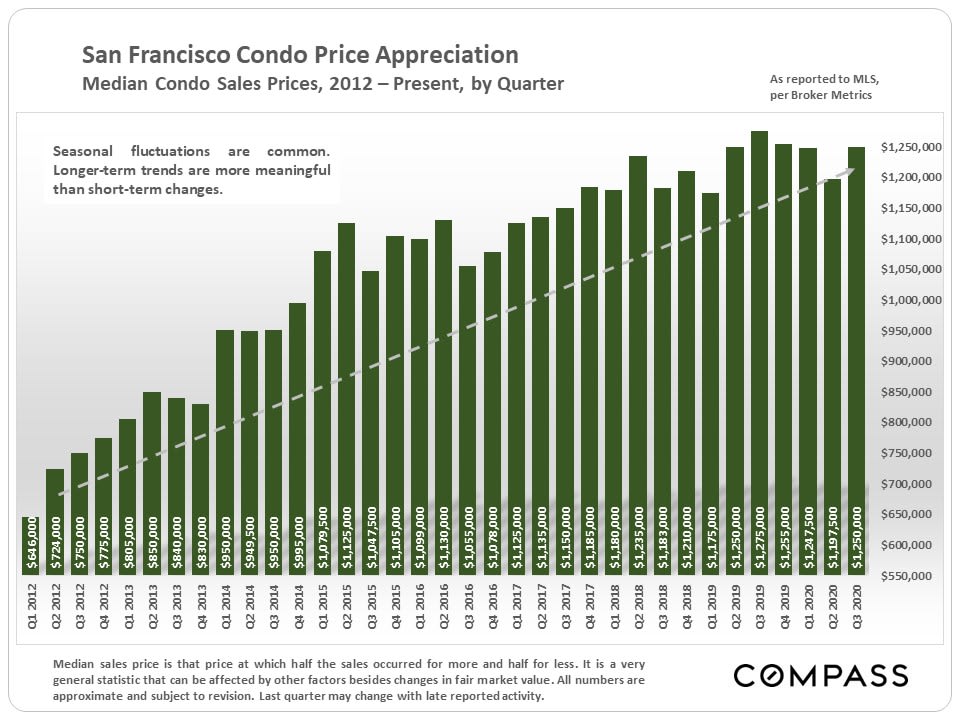
Chart of San Francisco condo prices by quarter, showing an overall upward trend from 2012 to 2020.

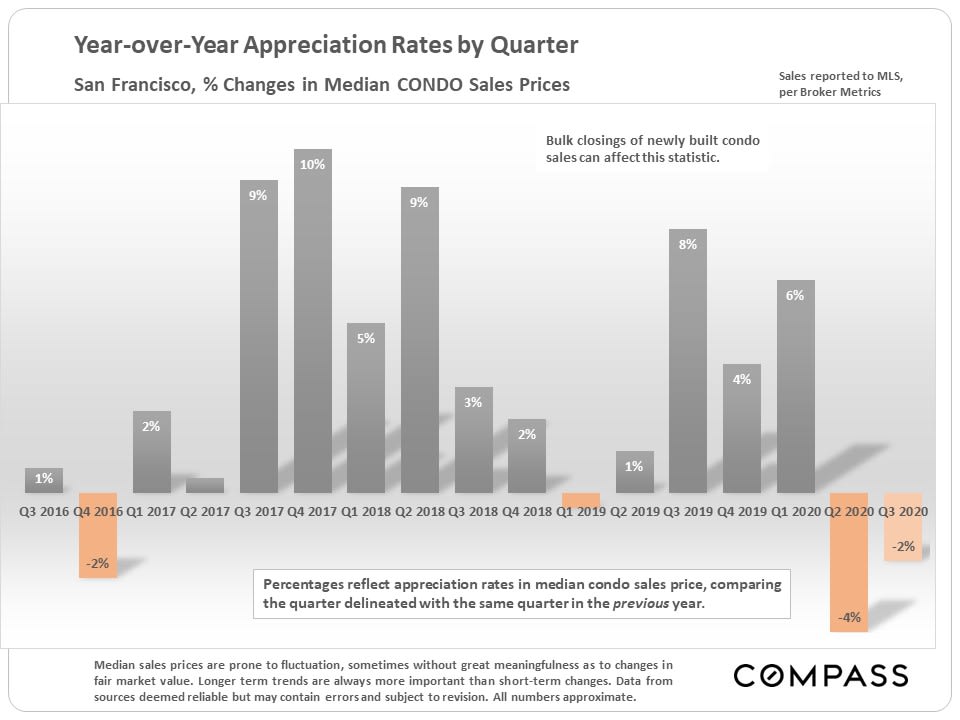
Chart of San Francisco condo price appreciation by quarter, with positive and negative year-over-year changes from 2016 to 2020.

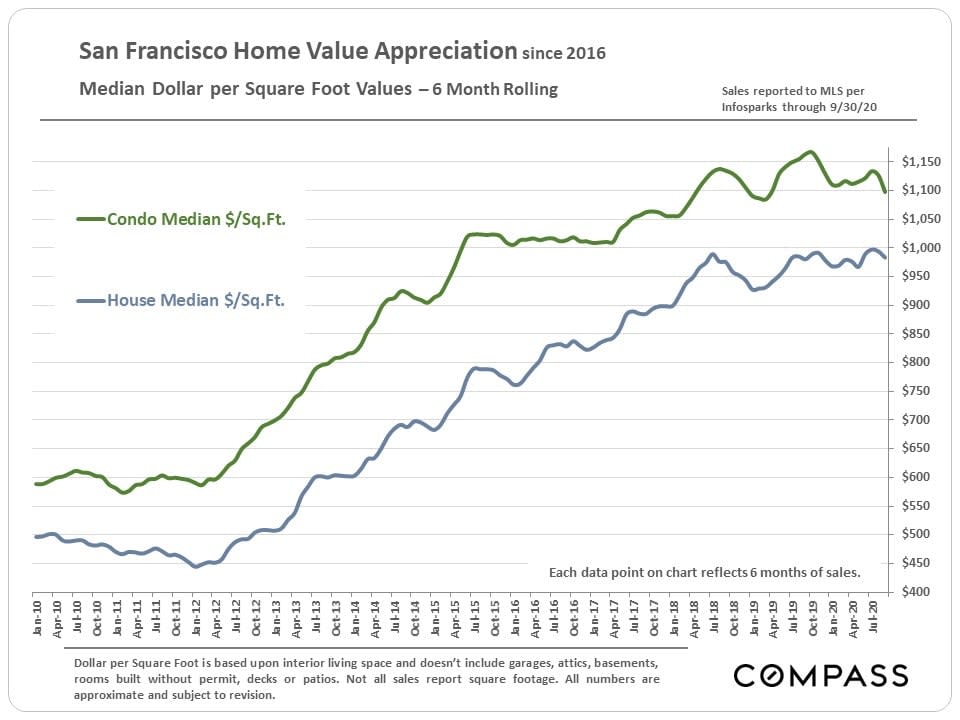
San Francisco home-value chart comparing condo and house prices per square foot from 2010 to 2020.

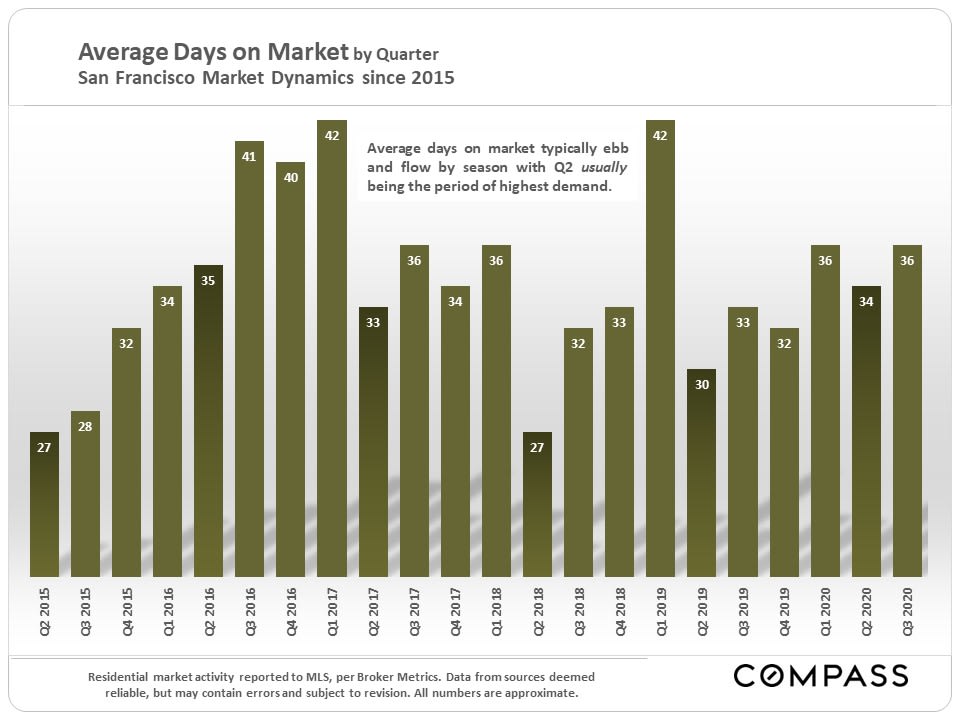
Bar chart of San Francisco average days on market by quarter, Q2 2015–Q3 2020; values range from 27 to 42 days.

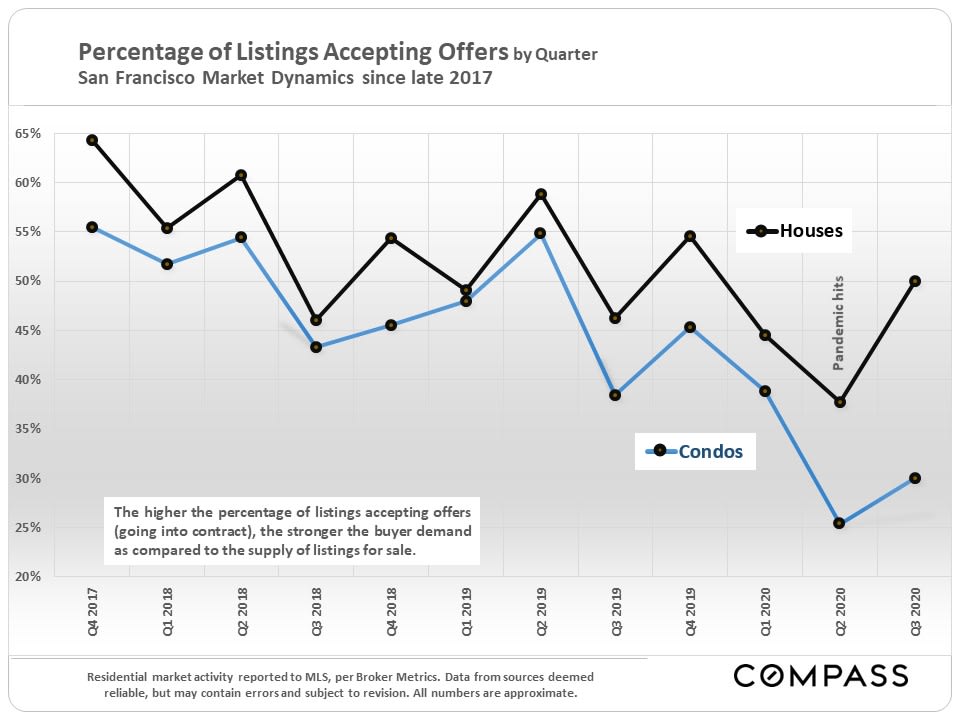
Chart comparing San Francisco houses and condos accepting offers quarterly from Q4 2017 to Q3 2020.

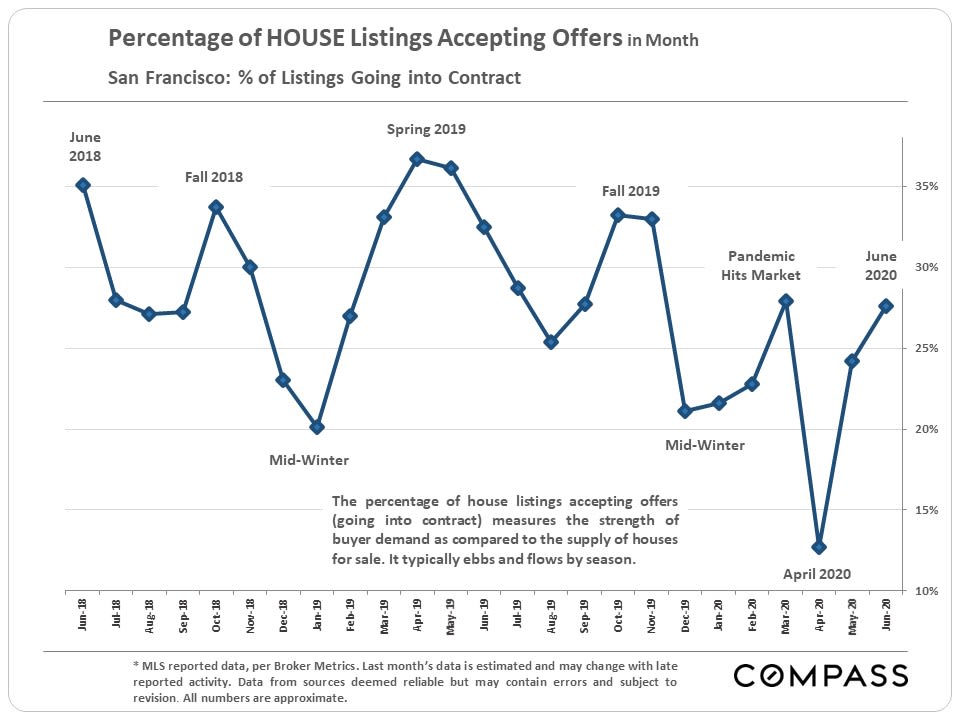
San Francisco chart of house listings going under contract, June 2018–June 2020, with a sharp April 2020 drop.

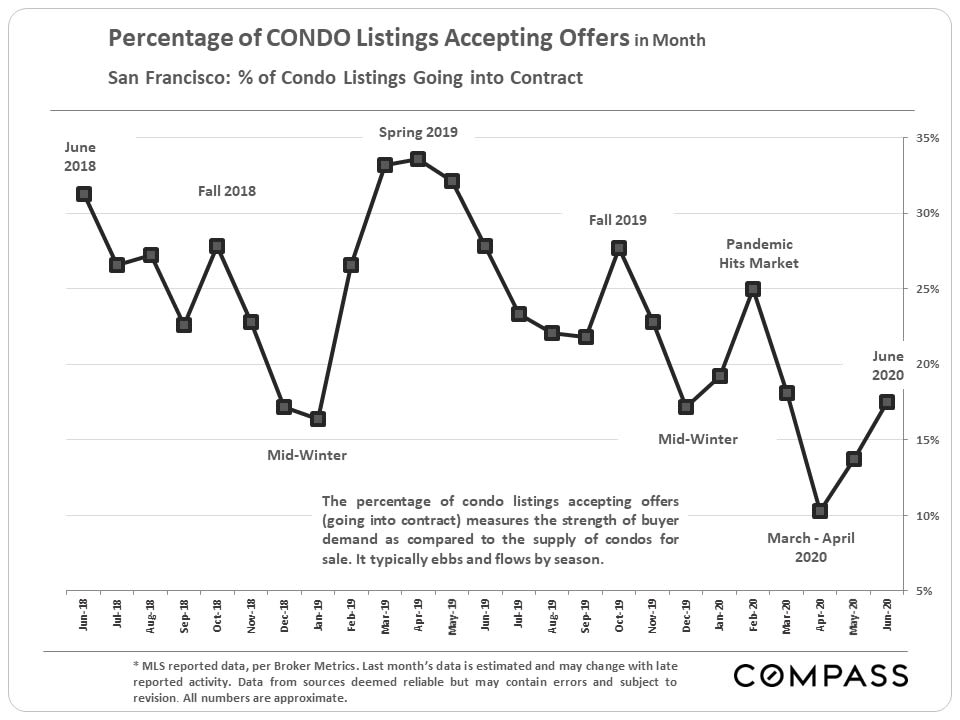
San Francisco condo listings going into contract by month, June 2018–June 2020.

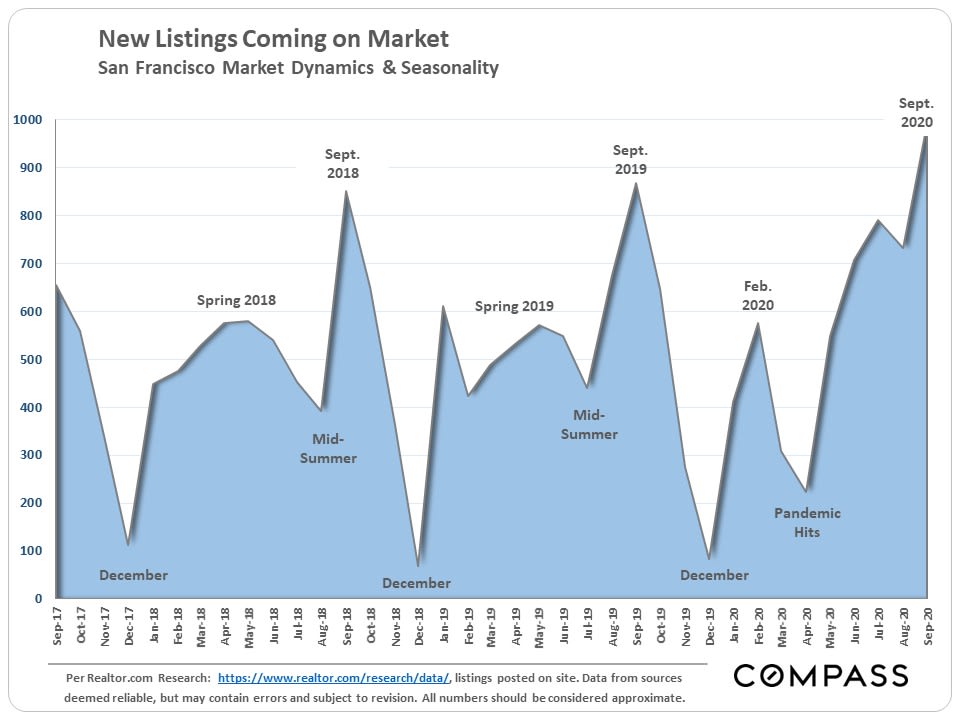
San Francisco new listings chart, September 2017–September 2020, with seasonal peaks and lows and a sharp rise in September 2020.

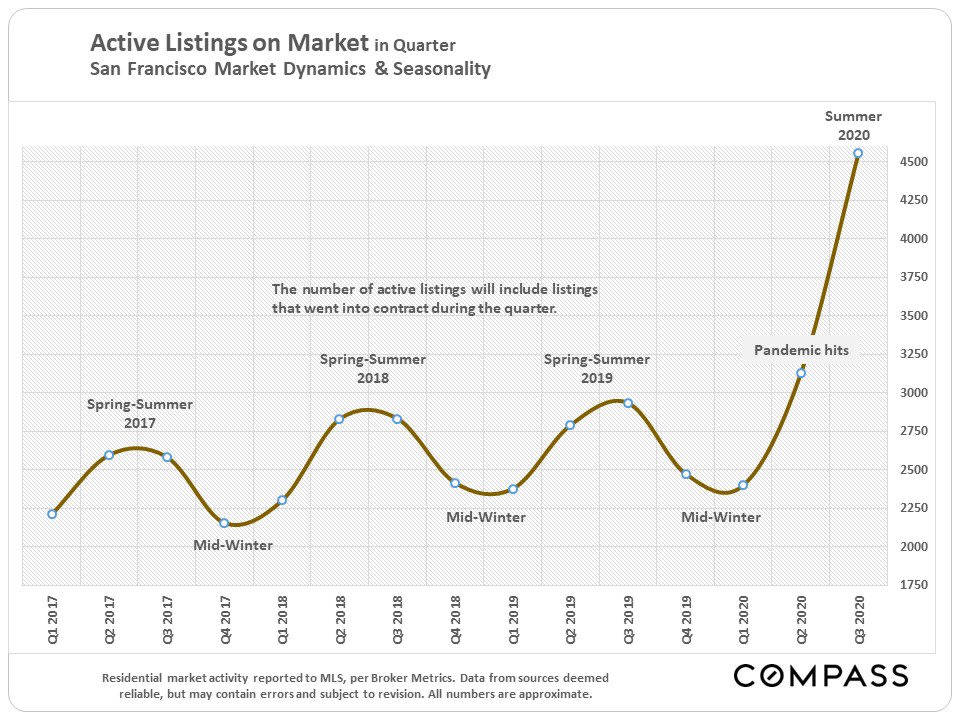
San Francisco quarterly active-listings chart, showing seasonal patterns and a sharp rise in summer 2020.

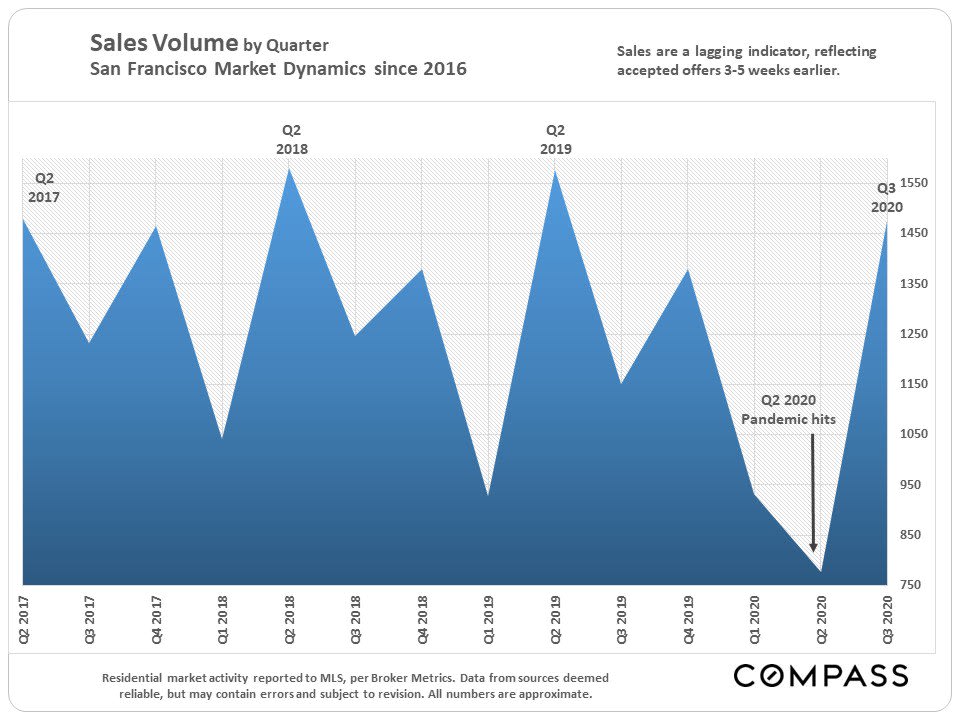
Chart of San Francisco quarterly sales volume, showing a sharp pandemic-era drop in Q2 2020 and a rebound in Q3.

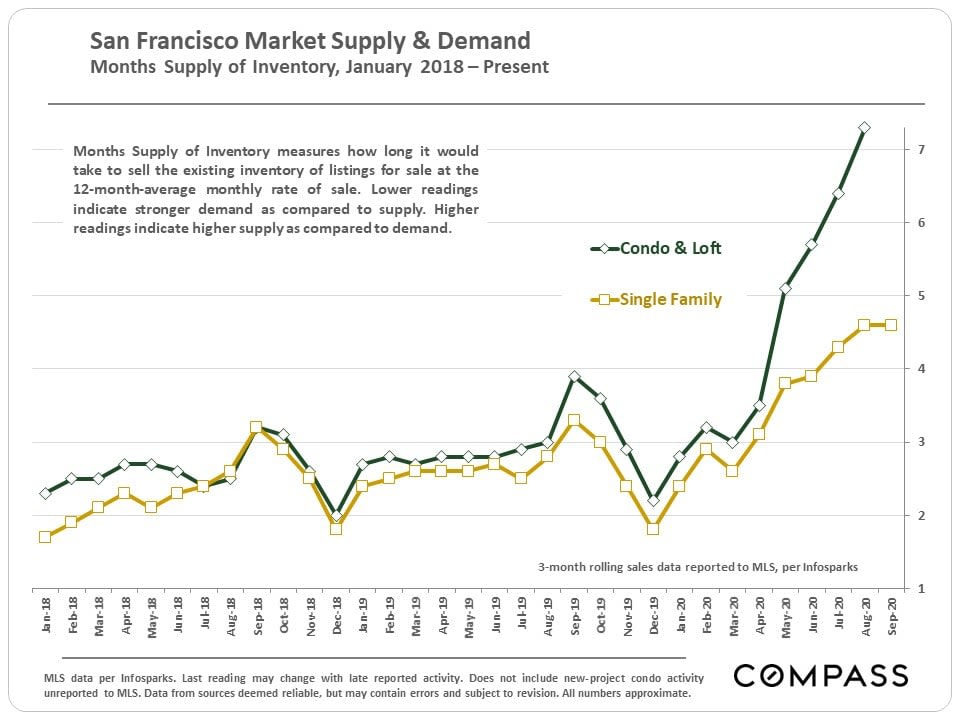
San Francisco inventory chart comparing condo and loft supply with single-family supply from 2018 to 2020.

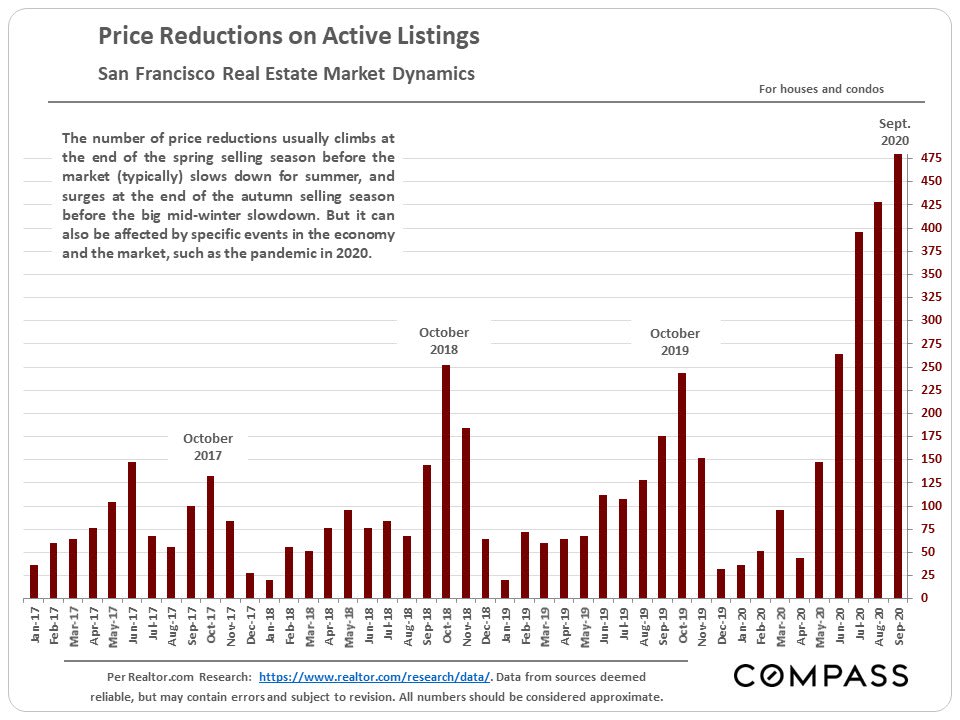
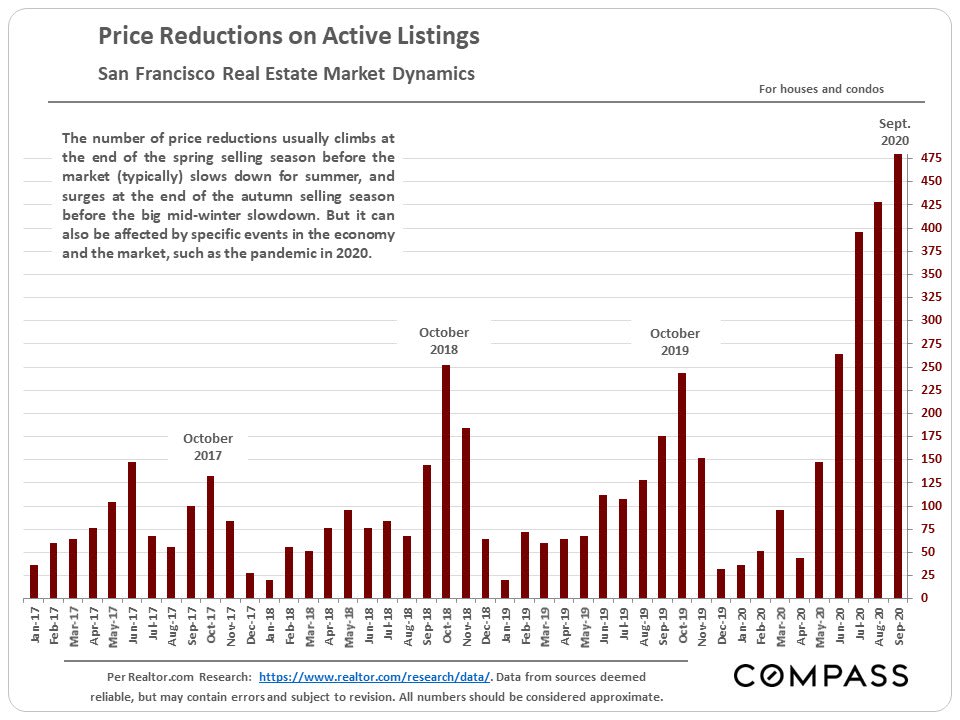
San Francisco active-listing price reductions by month, 2017–2020, with a sharp rise in summer 2020.

Bar chart of San Francisco listing price reductions, rising to about 475 in September 2020.

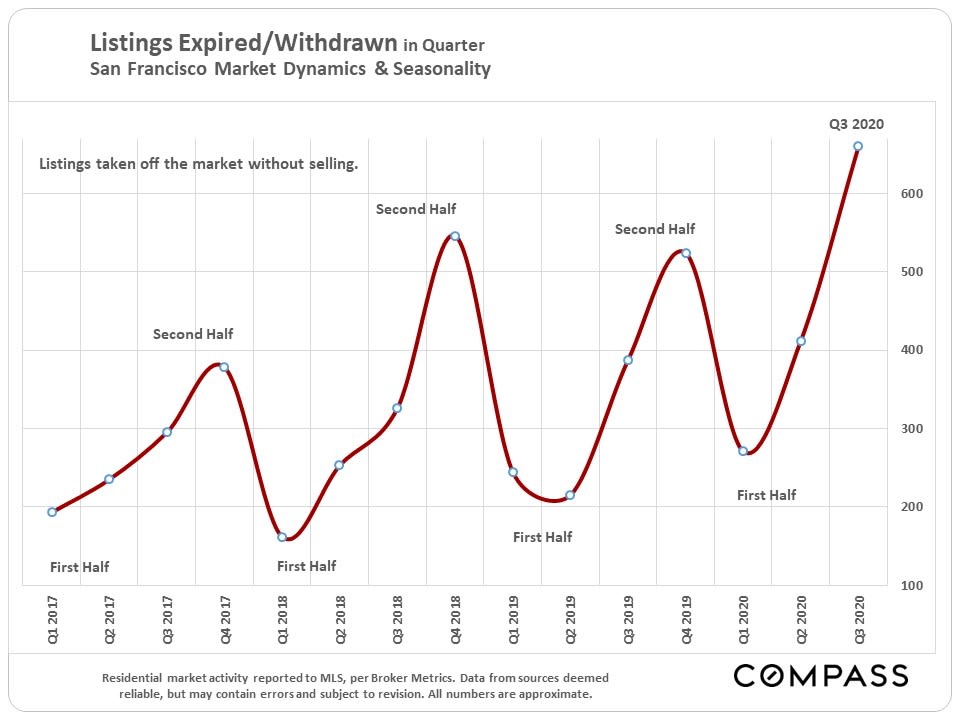
San Francisco expired or withdrawn listings fluctuated from 2017 and peaked above 600 in Q3 2020.

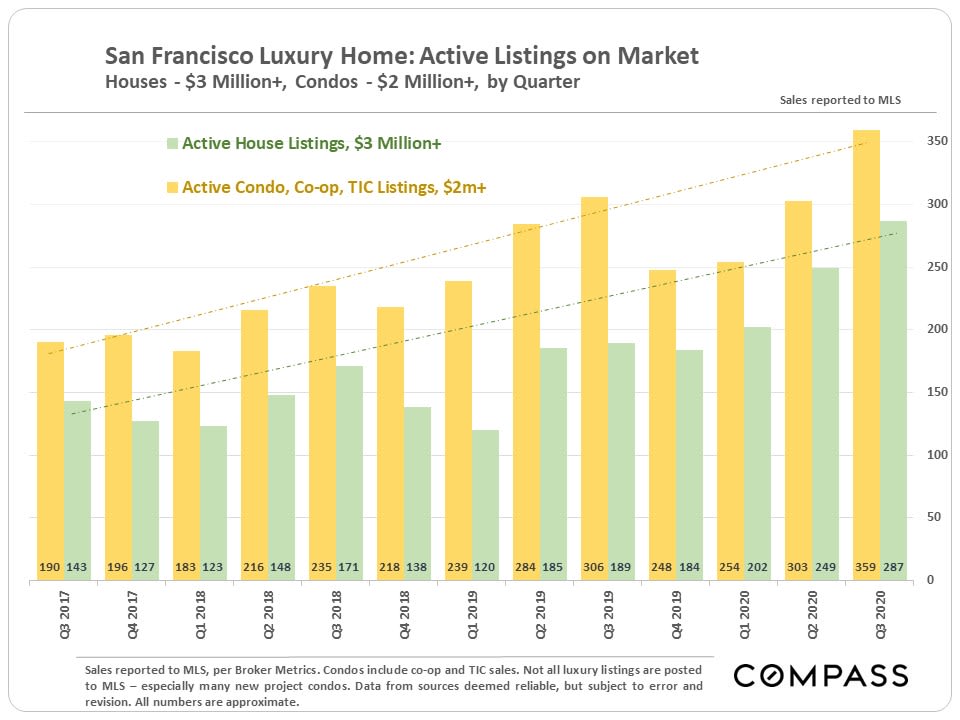
Bar chart comparing San Francisco luxury house and condo listings by quarter, Q3 2017–Q3 2020.

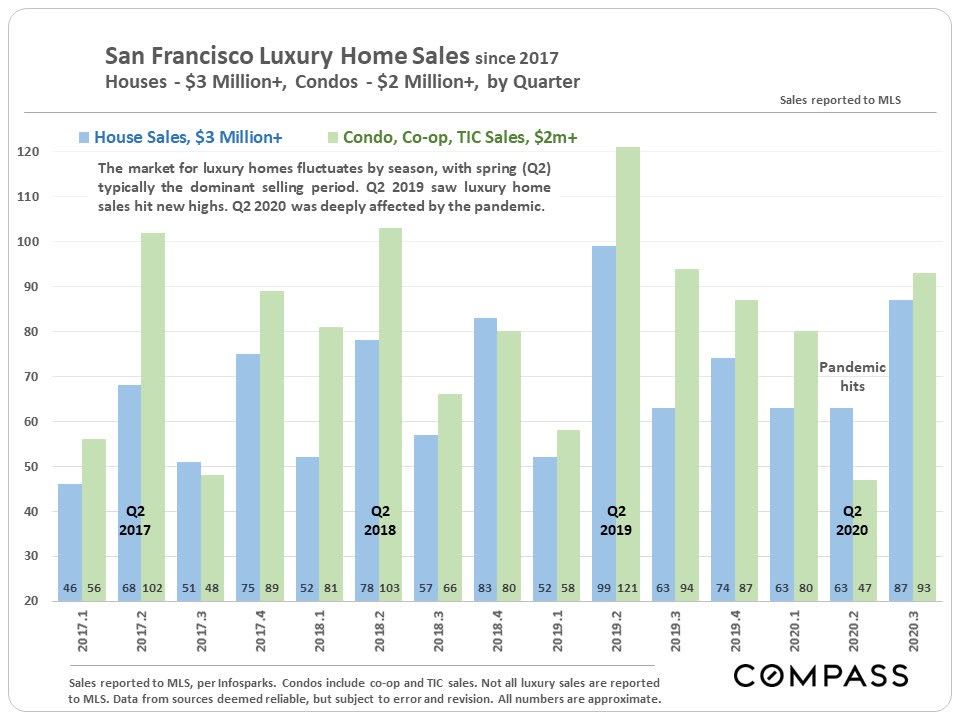
Chart comparing quarterly San Francisco luxury house and condo sales from 2017 to Q3 2020.

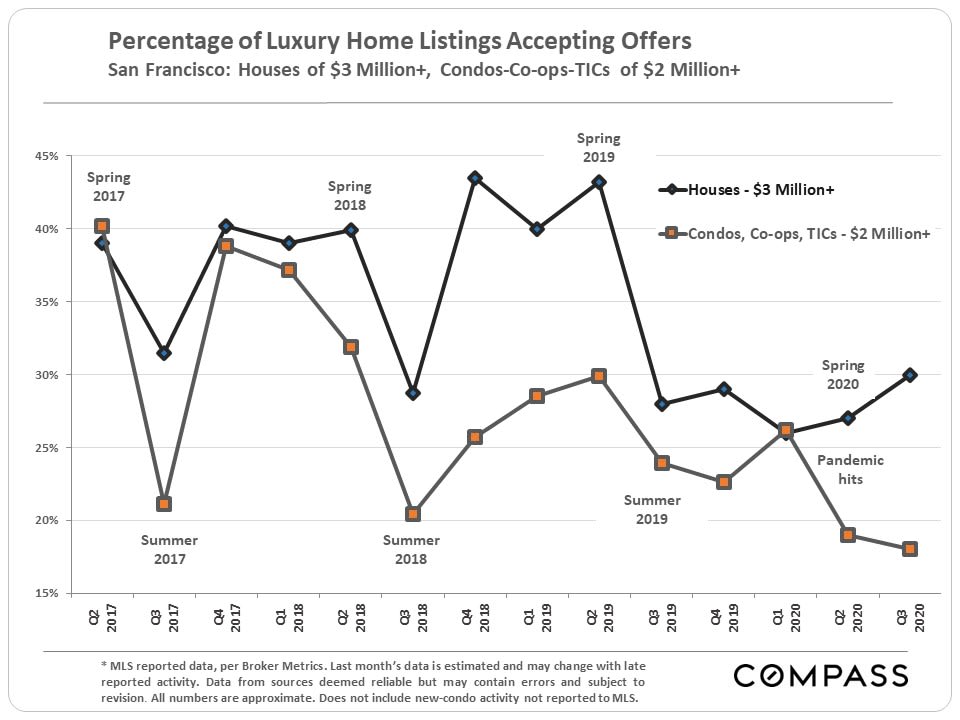
Chart comparing luxury San Francisco house and condo listing offer acceptance rates from Q2 2017 to Q3 2020.

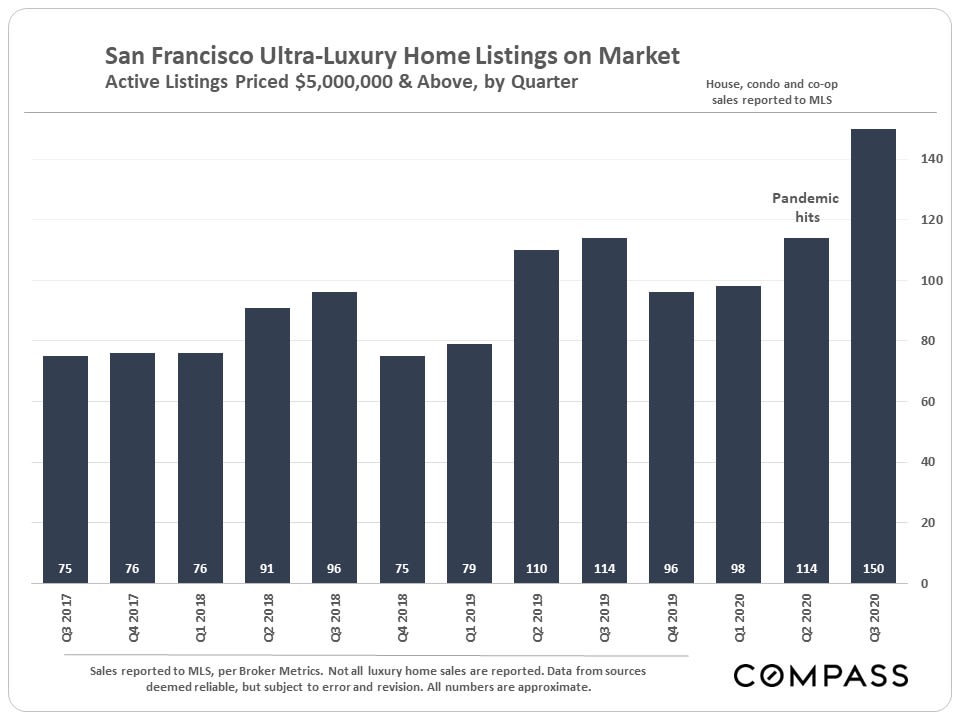
Bar chart of San Francisco ultra-luxury listings, rising to 150 in Q3 2020.

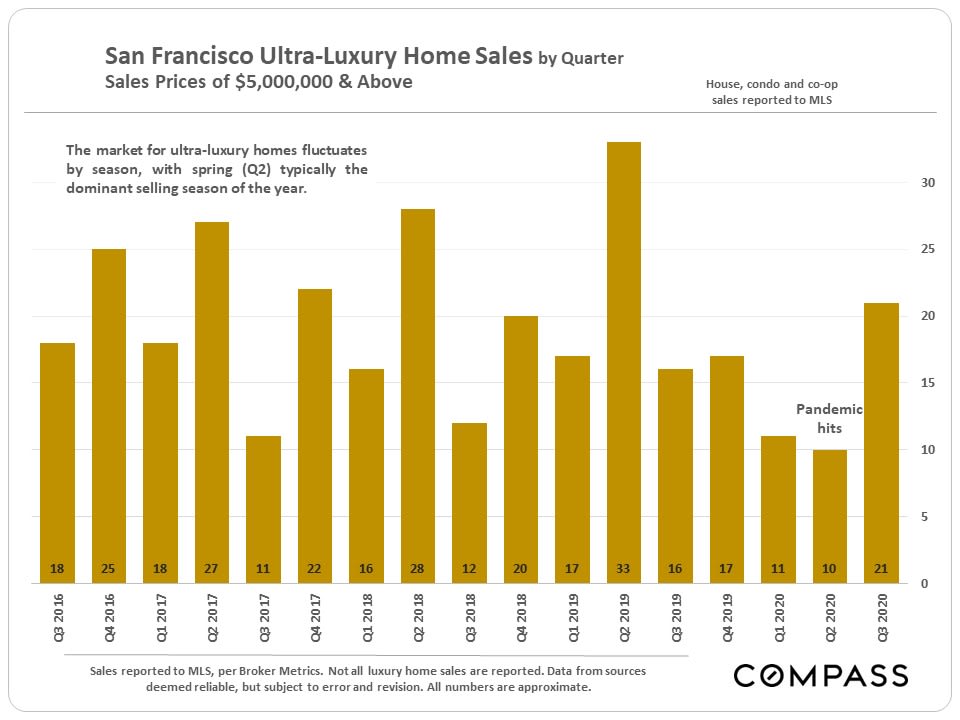
Bar chart of San Francisco ultra-luxury home sales by quarter, peaking at 33 in Q2 2019.

Compass San Francisco Bay Area market report disclaimer and data-analysis notice.


Have questions on the market?

Contact us at [email protected]

Two women and two real estate professionals review a tablet in a bright white kitchen.

The Key To Your Dreams ®

As your trusted real estate advisors, we are committed to delivering the highest level of service and marketing, sharing our experience and expertise to help you achieve exceptional results.
Follow Us