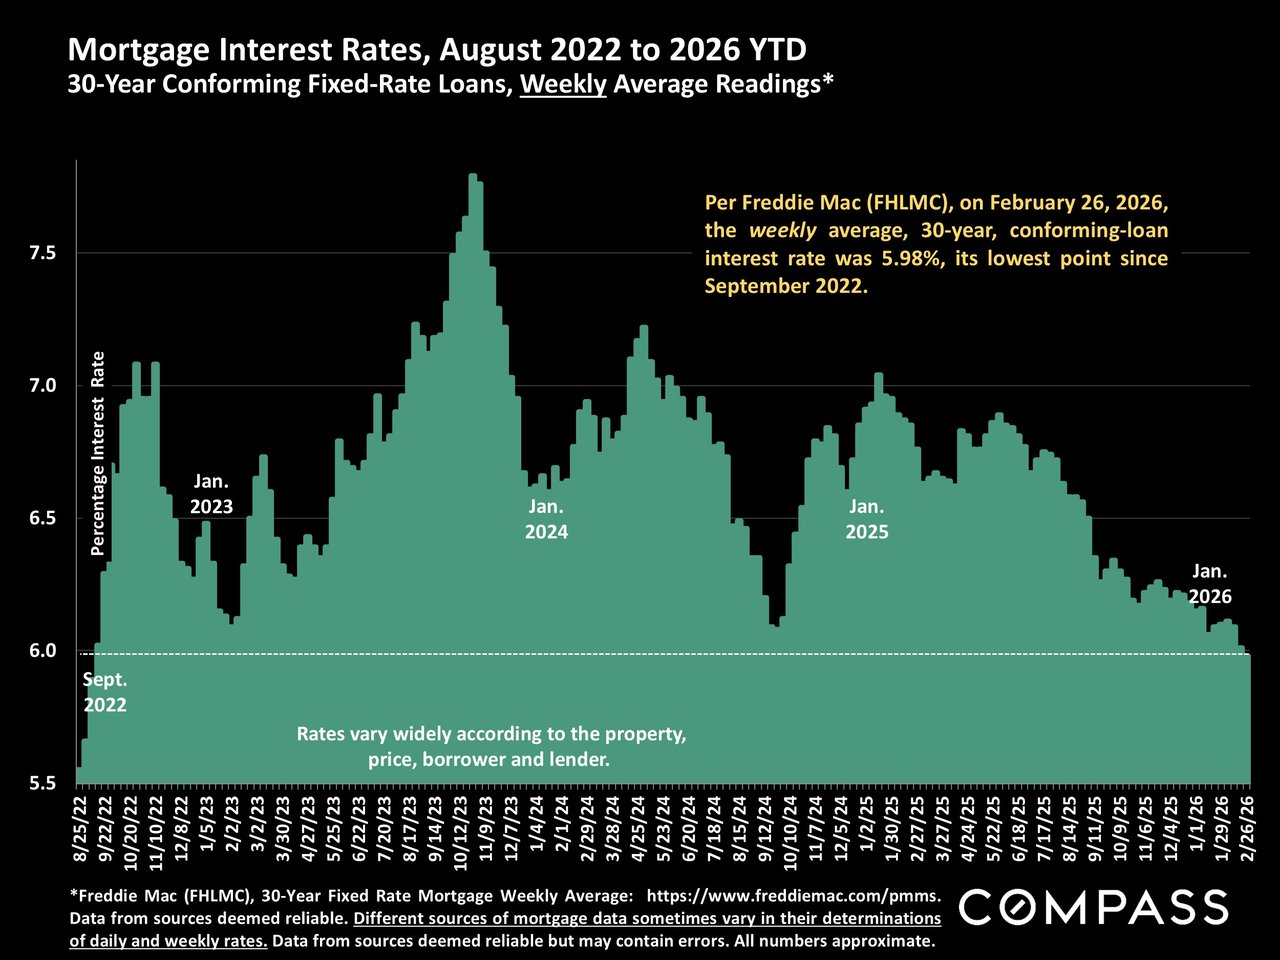
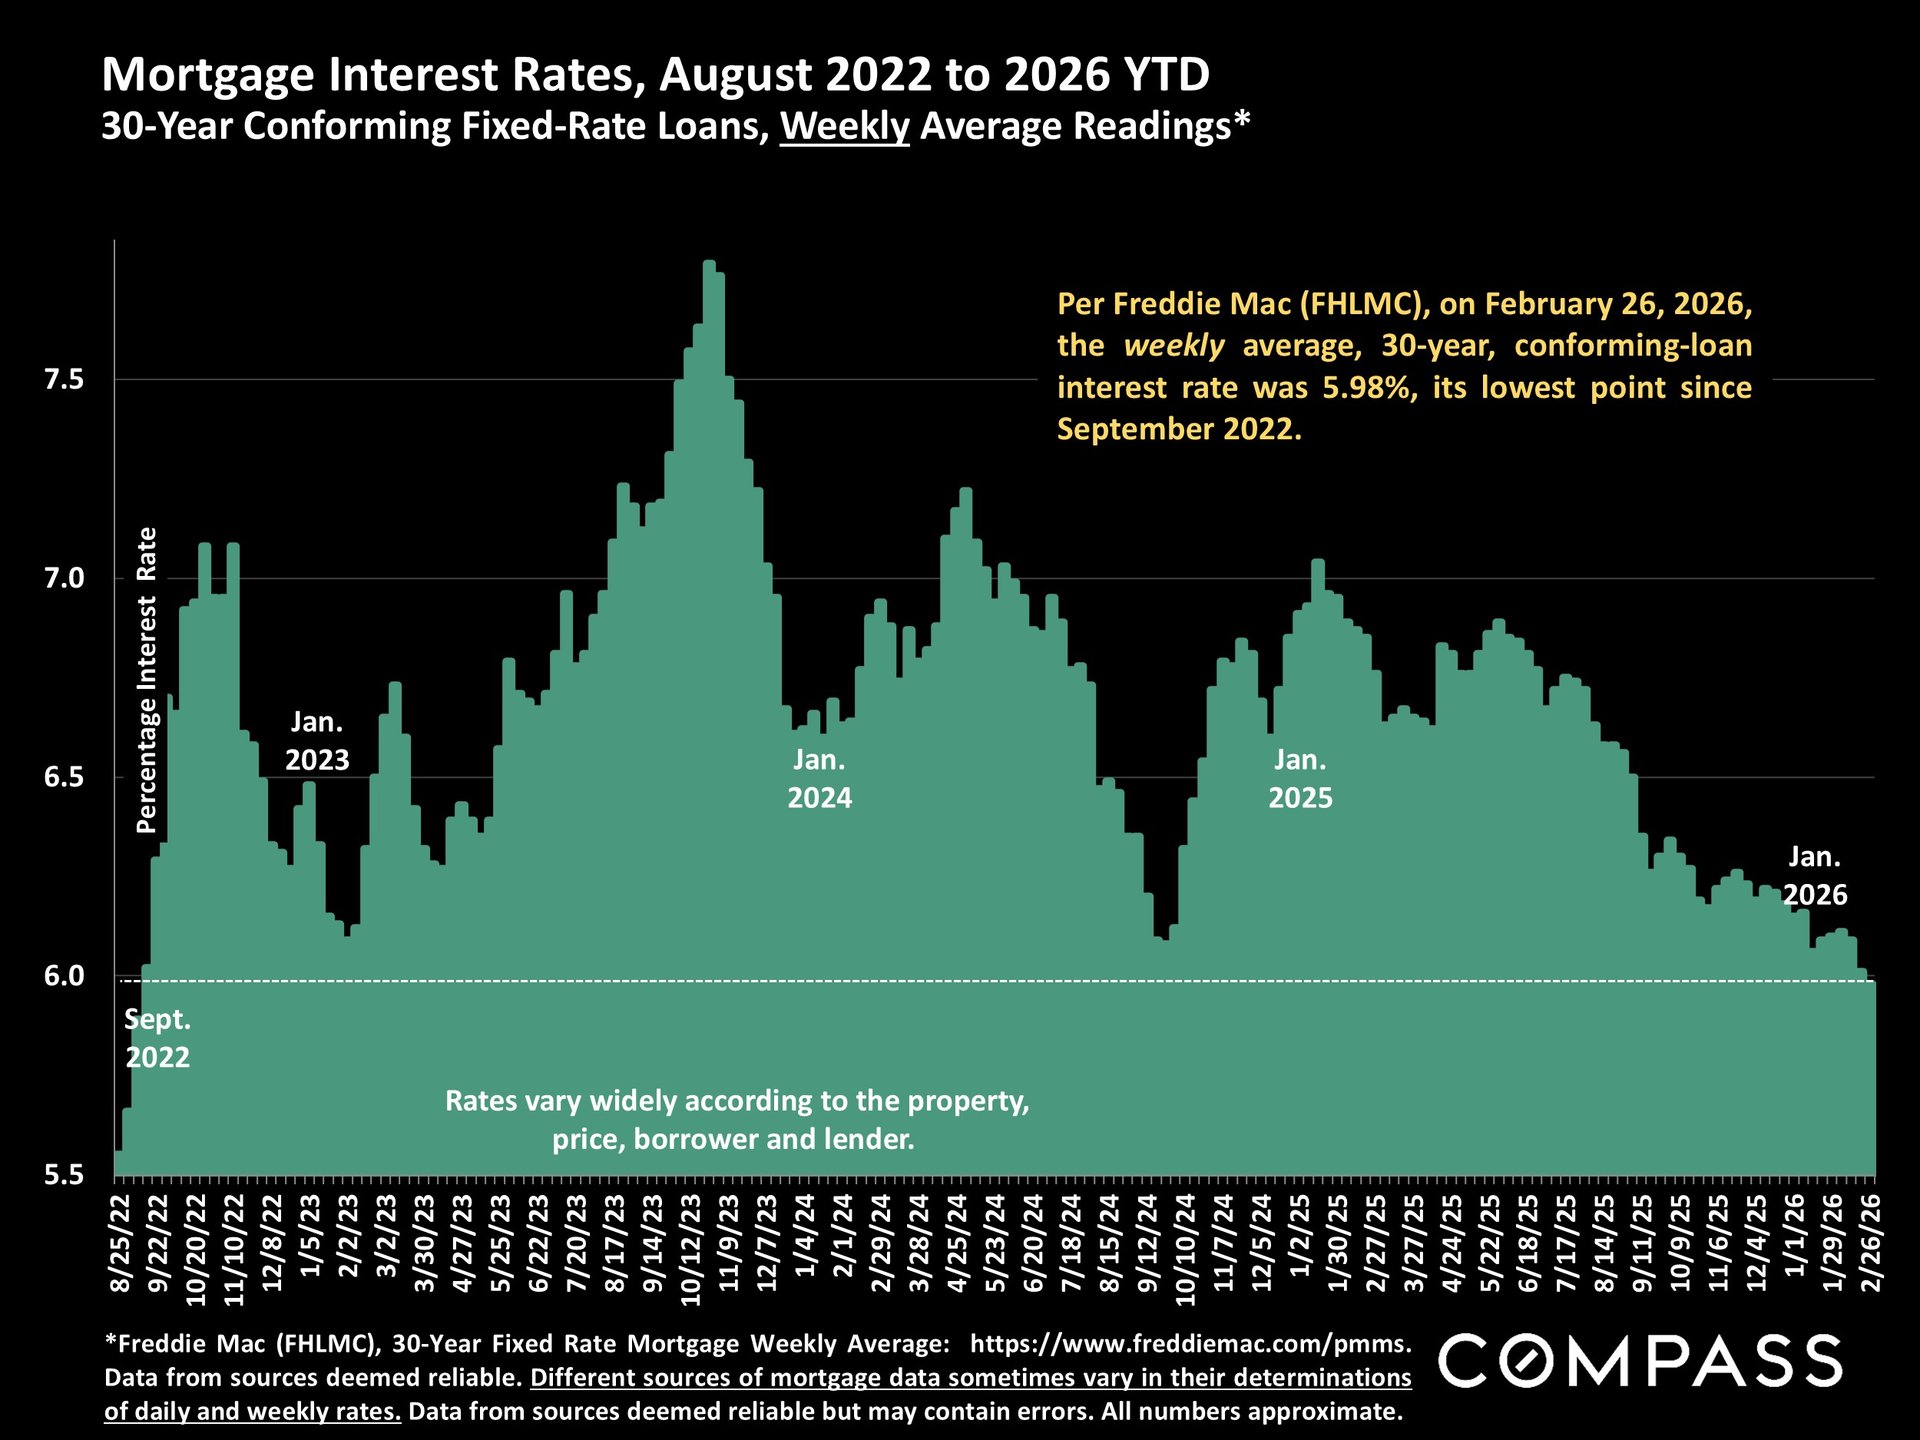
30-year mortgage interest rates have hit their lowest point since September 2022:
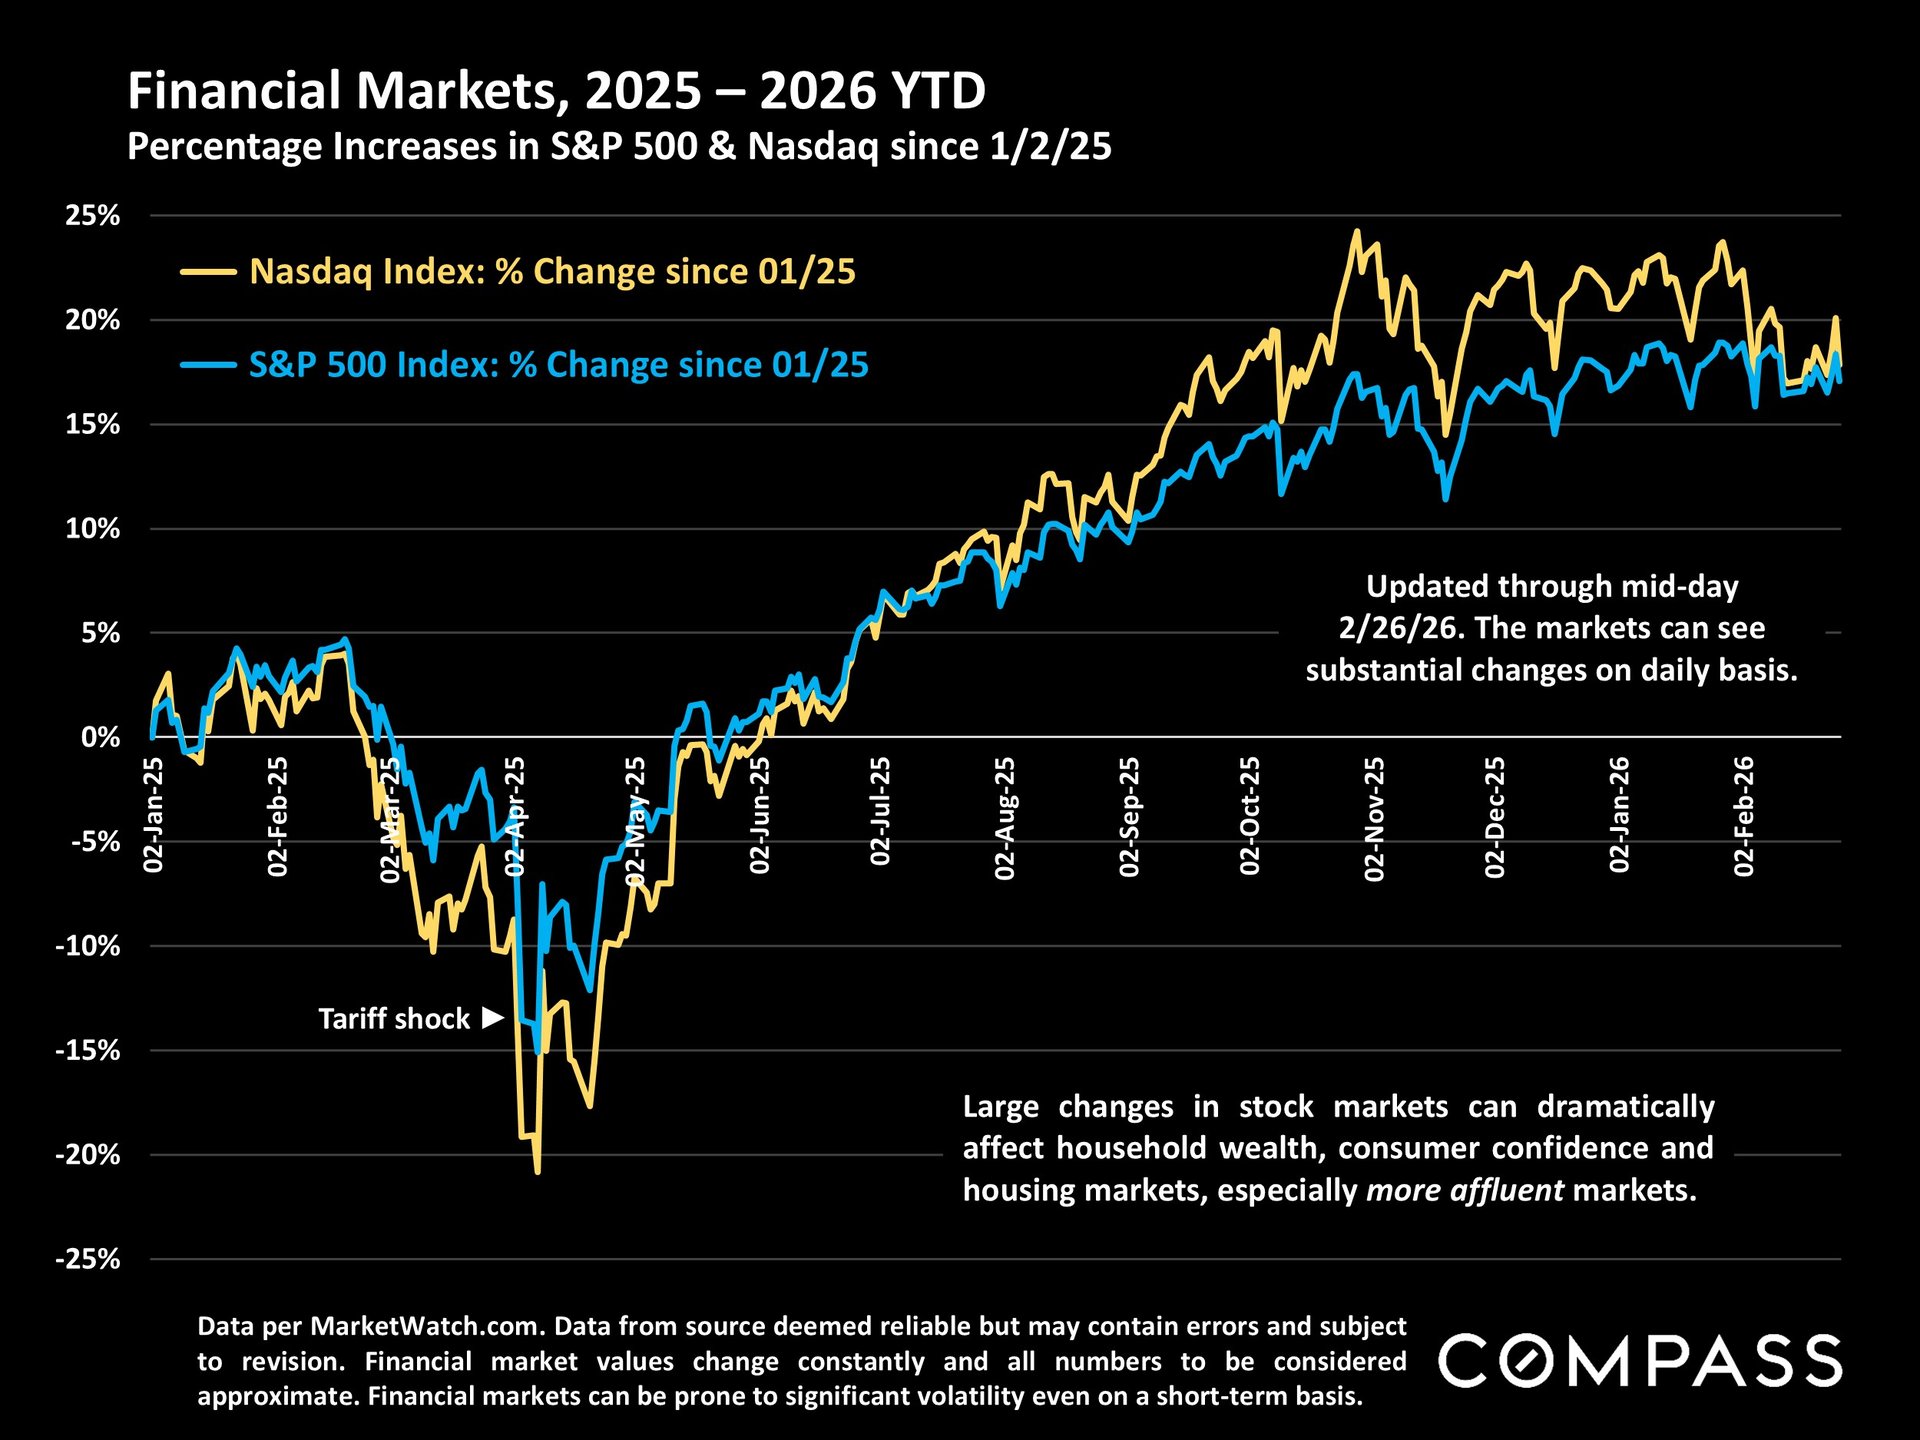
Stock markets have been quite volatile, but remain high on long-term basis. Some specific industry segments - including software, financial services, logistics, professional services like legal and HR, and real estate - have been hit hard recently by AI-effect fears.
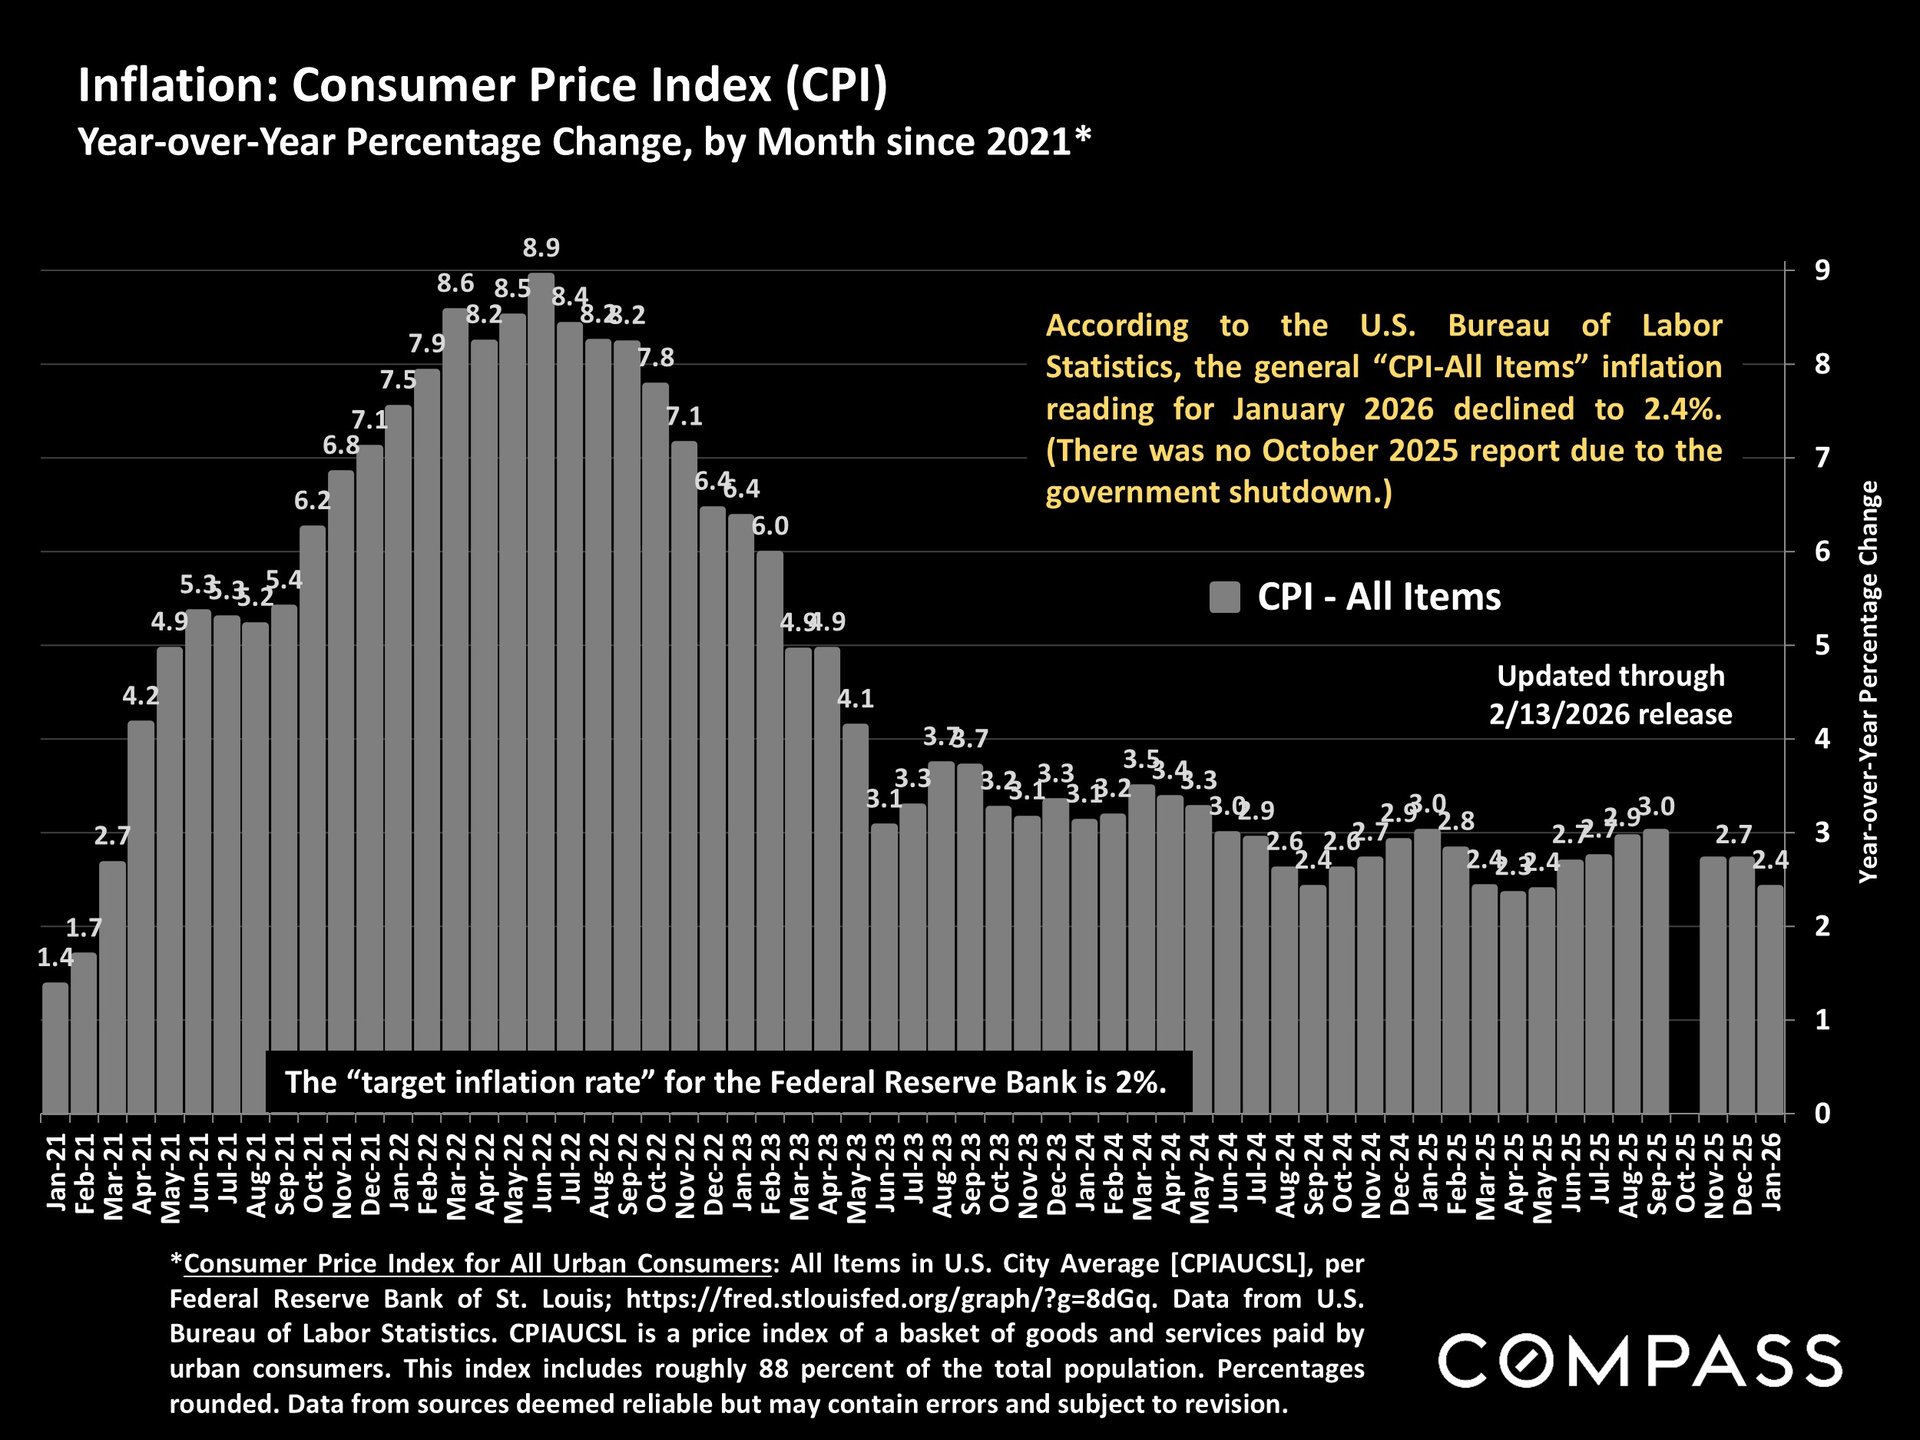
According to the federal government, inflation ticked down in the latest reading. But many basic household costs have seen large jumps over recent years, including housing, insurance, utilities, transportation and food, which are of significant concern to consumers.
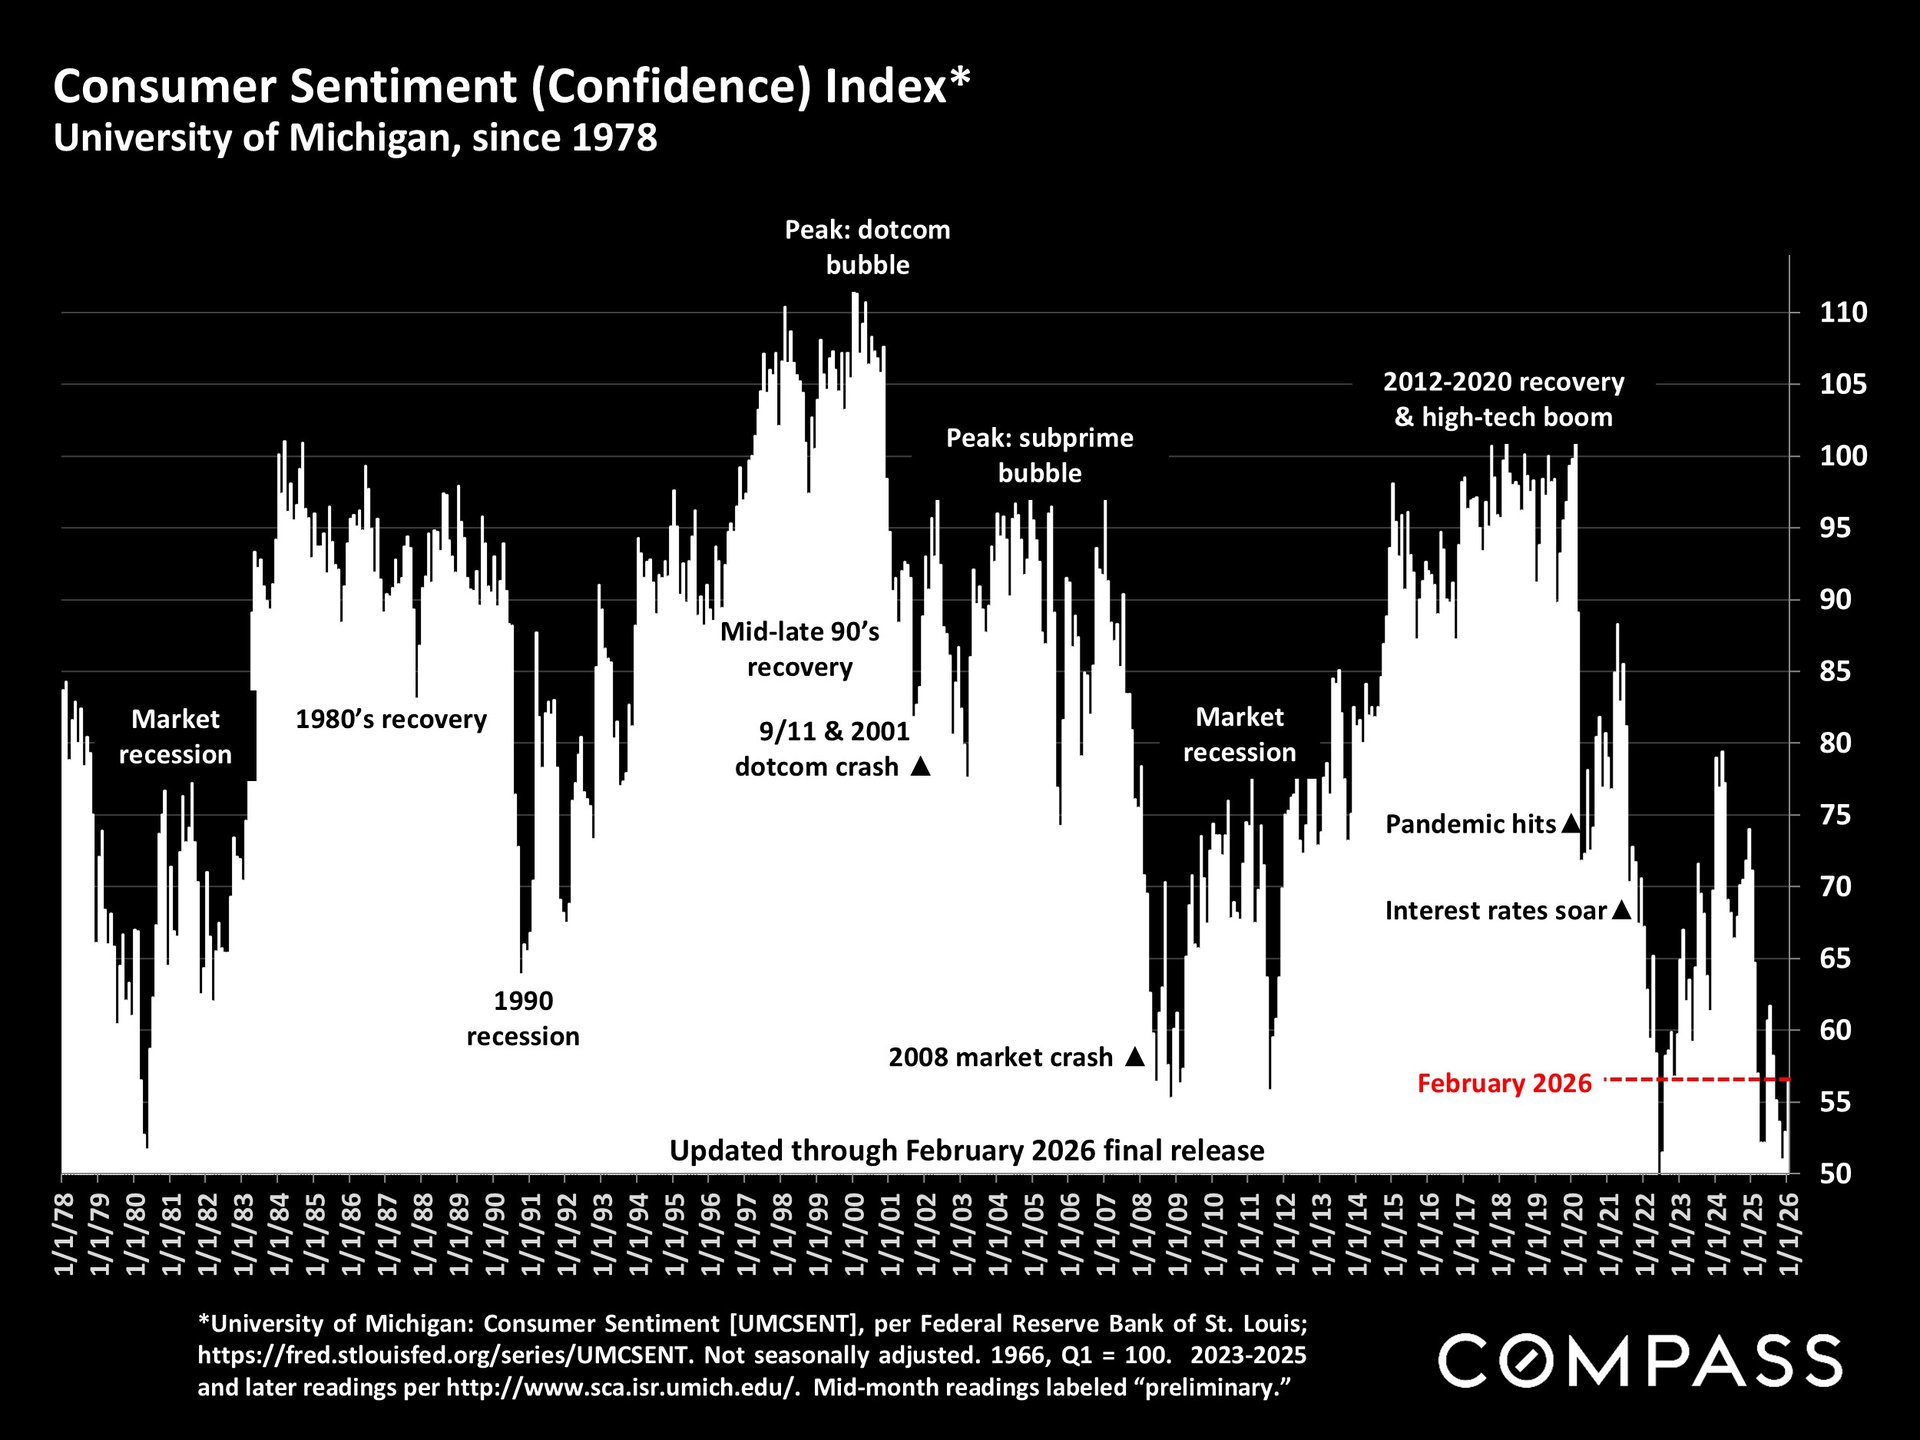
Consumer Sentiment, University of Michigan: "Consumer sentiment stagnated this month with very little change...About 46% of consumers spontaneously mentioned high prices eroding their personal finances...Sentiment is about 13% below a year ago and 21% below January 2025. That said, views vary considerably across the population. A sizable month-to-month increase in sentiment for the largest stockholders was fully offset by a decline among consumers without stock holdings. Similar divergences were seen across income and education, where higher-income or college educated consumers exhibited increases in sentiment while lower-income or less-educated counterparts did not. With their much stronger income prospects and investment porfolios, wealthier and higher-income consumers feel better insulated from any possible risks to the economy."
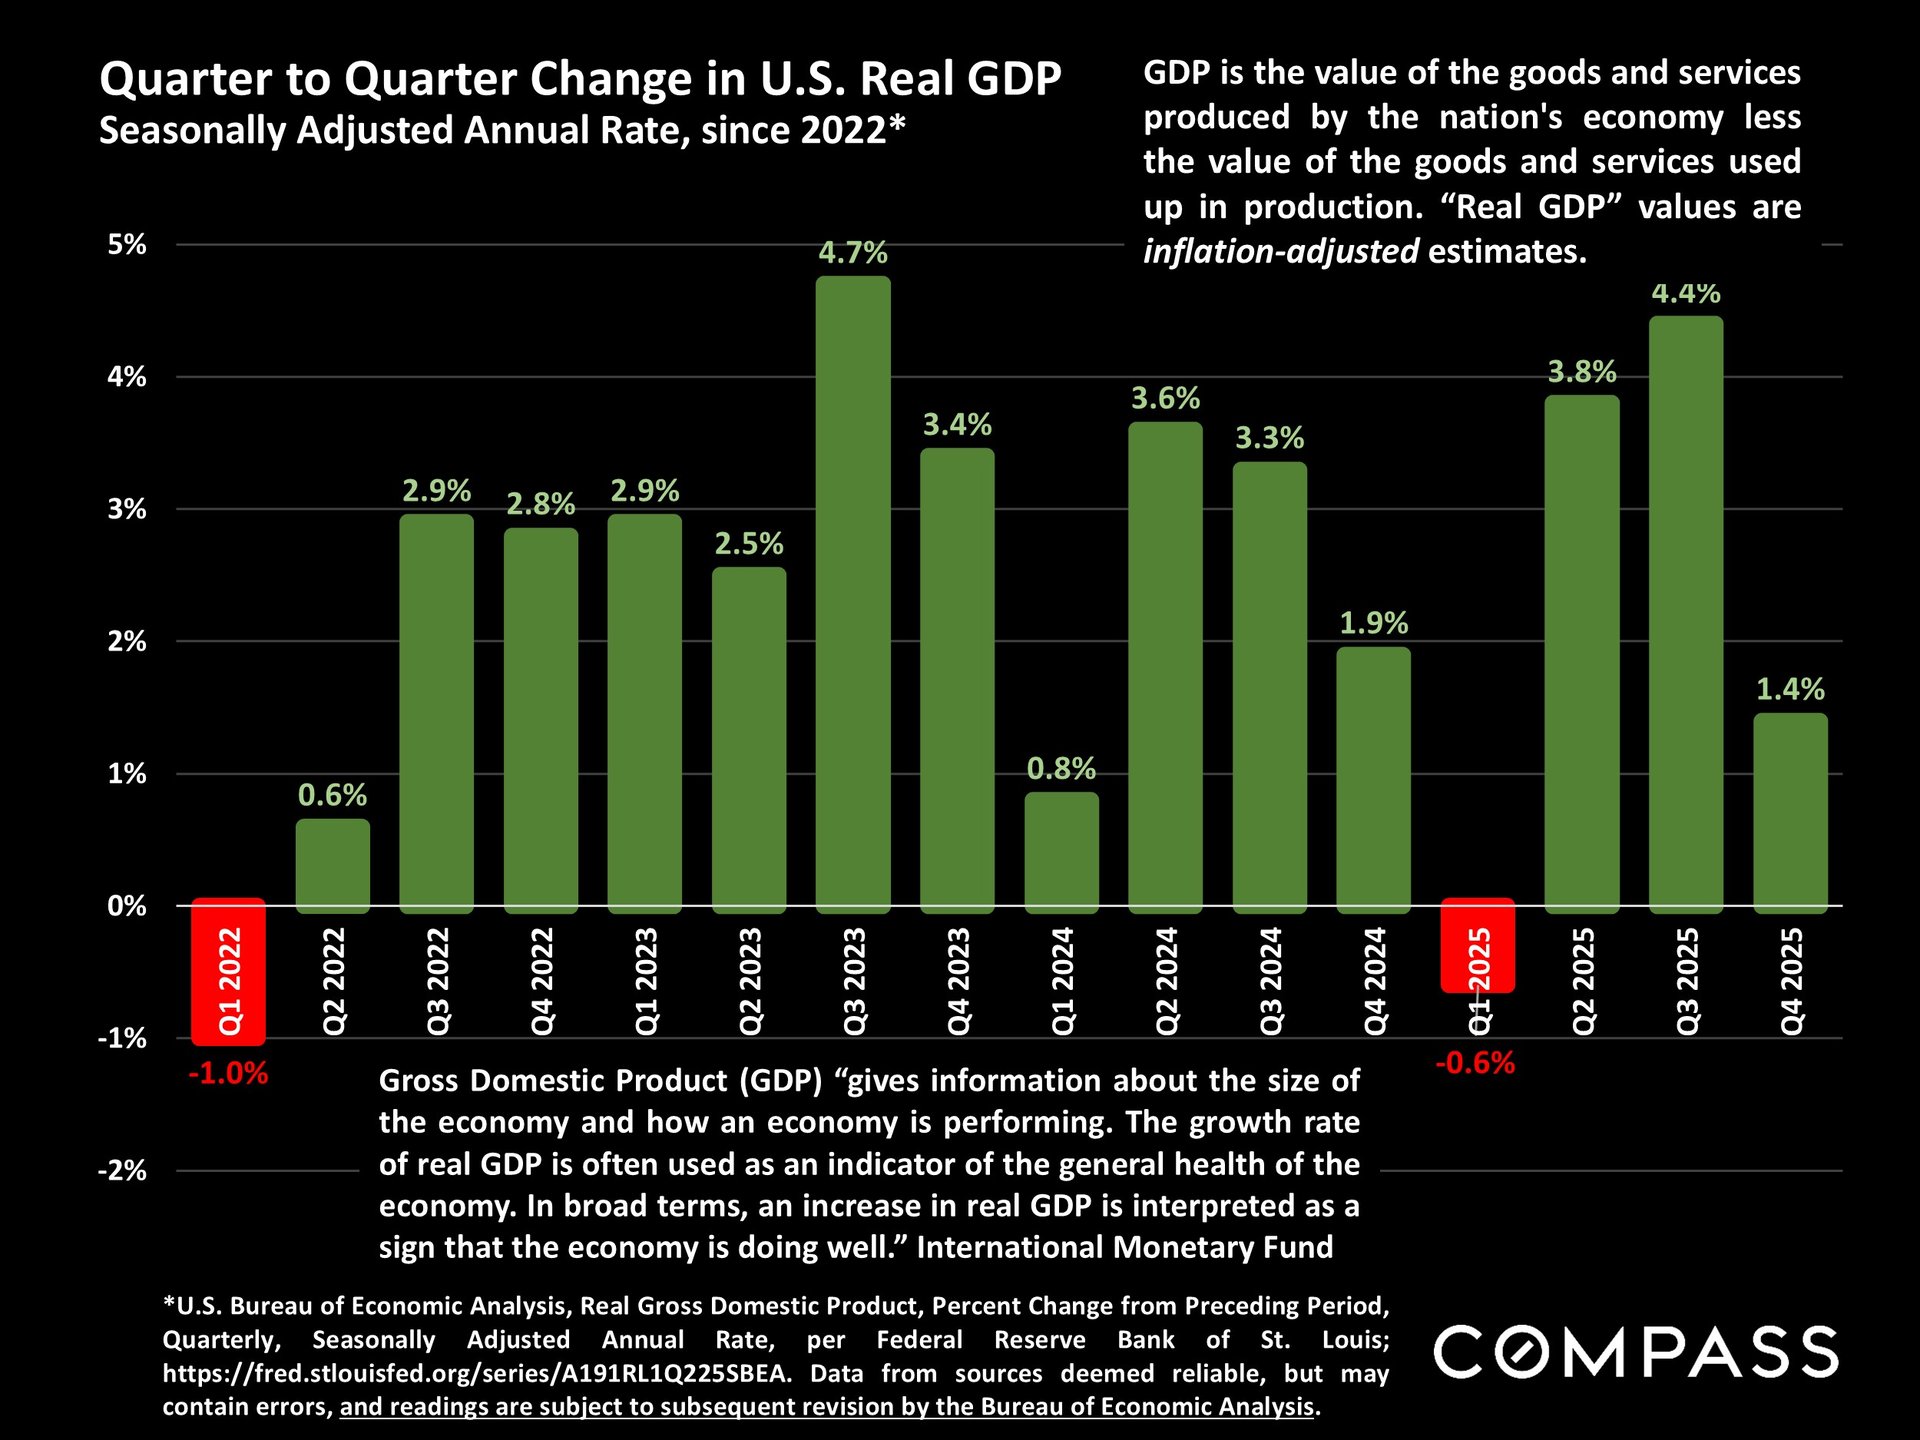
GDP fell dramatically in Q4: The president said the government shutdown was to blame.
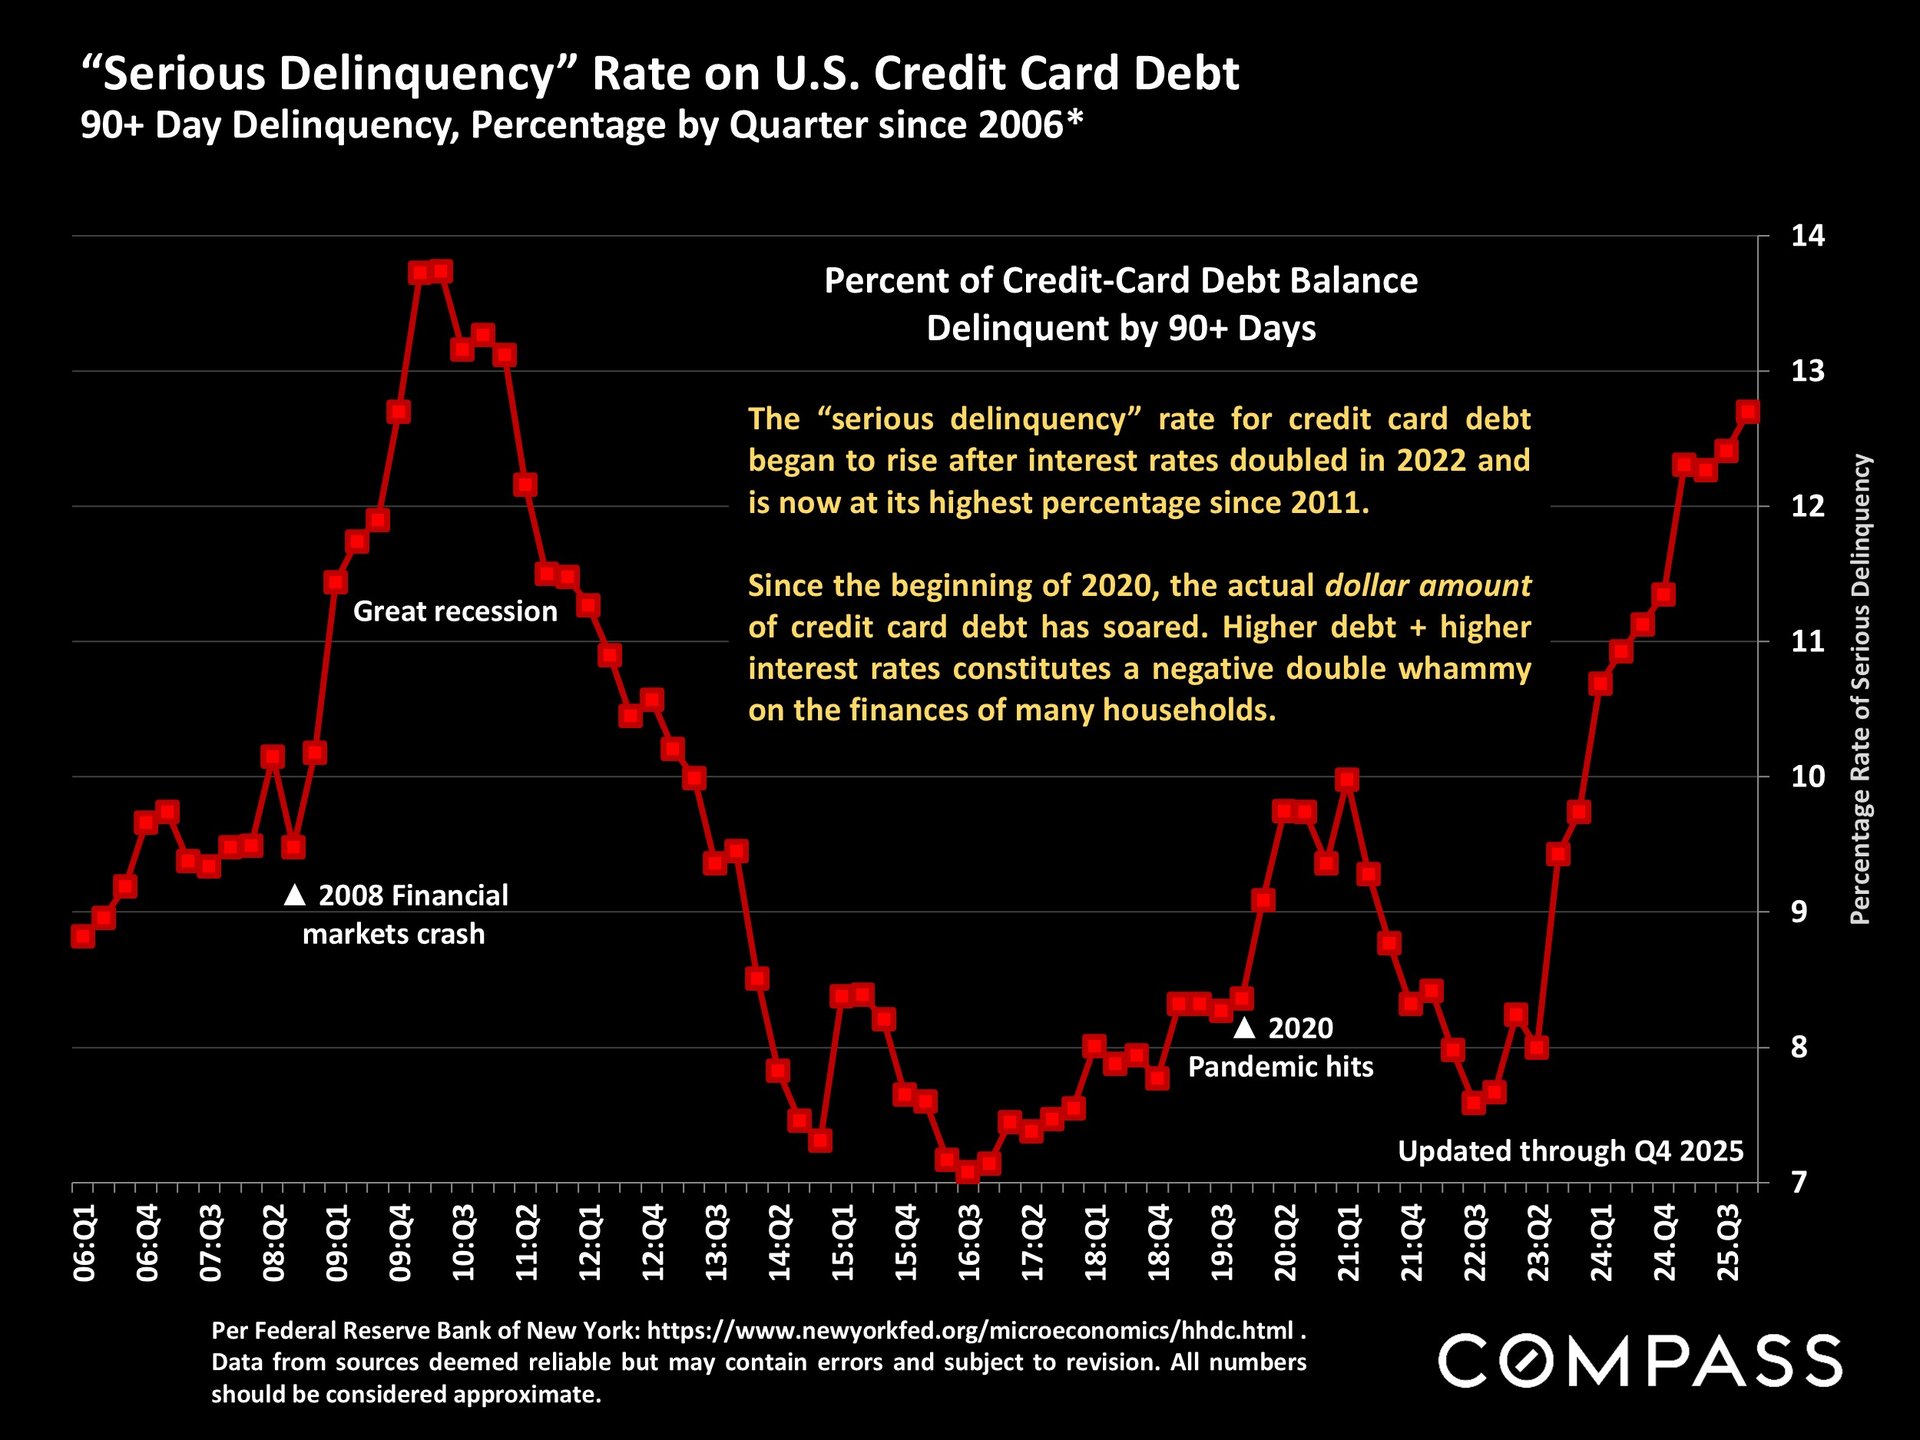
Consumer, corporate and government debt levels are of significant concern to many economists.
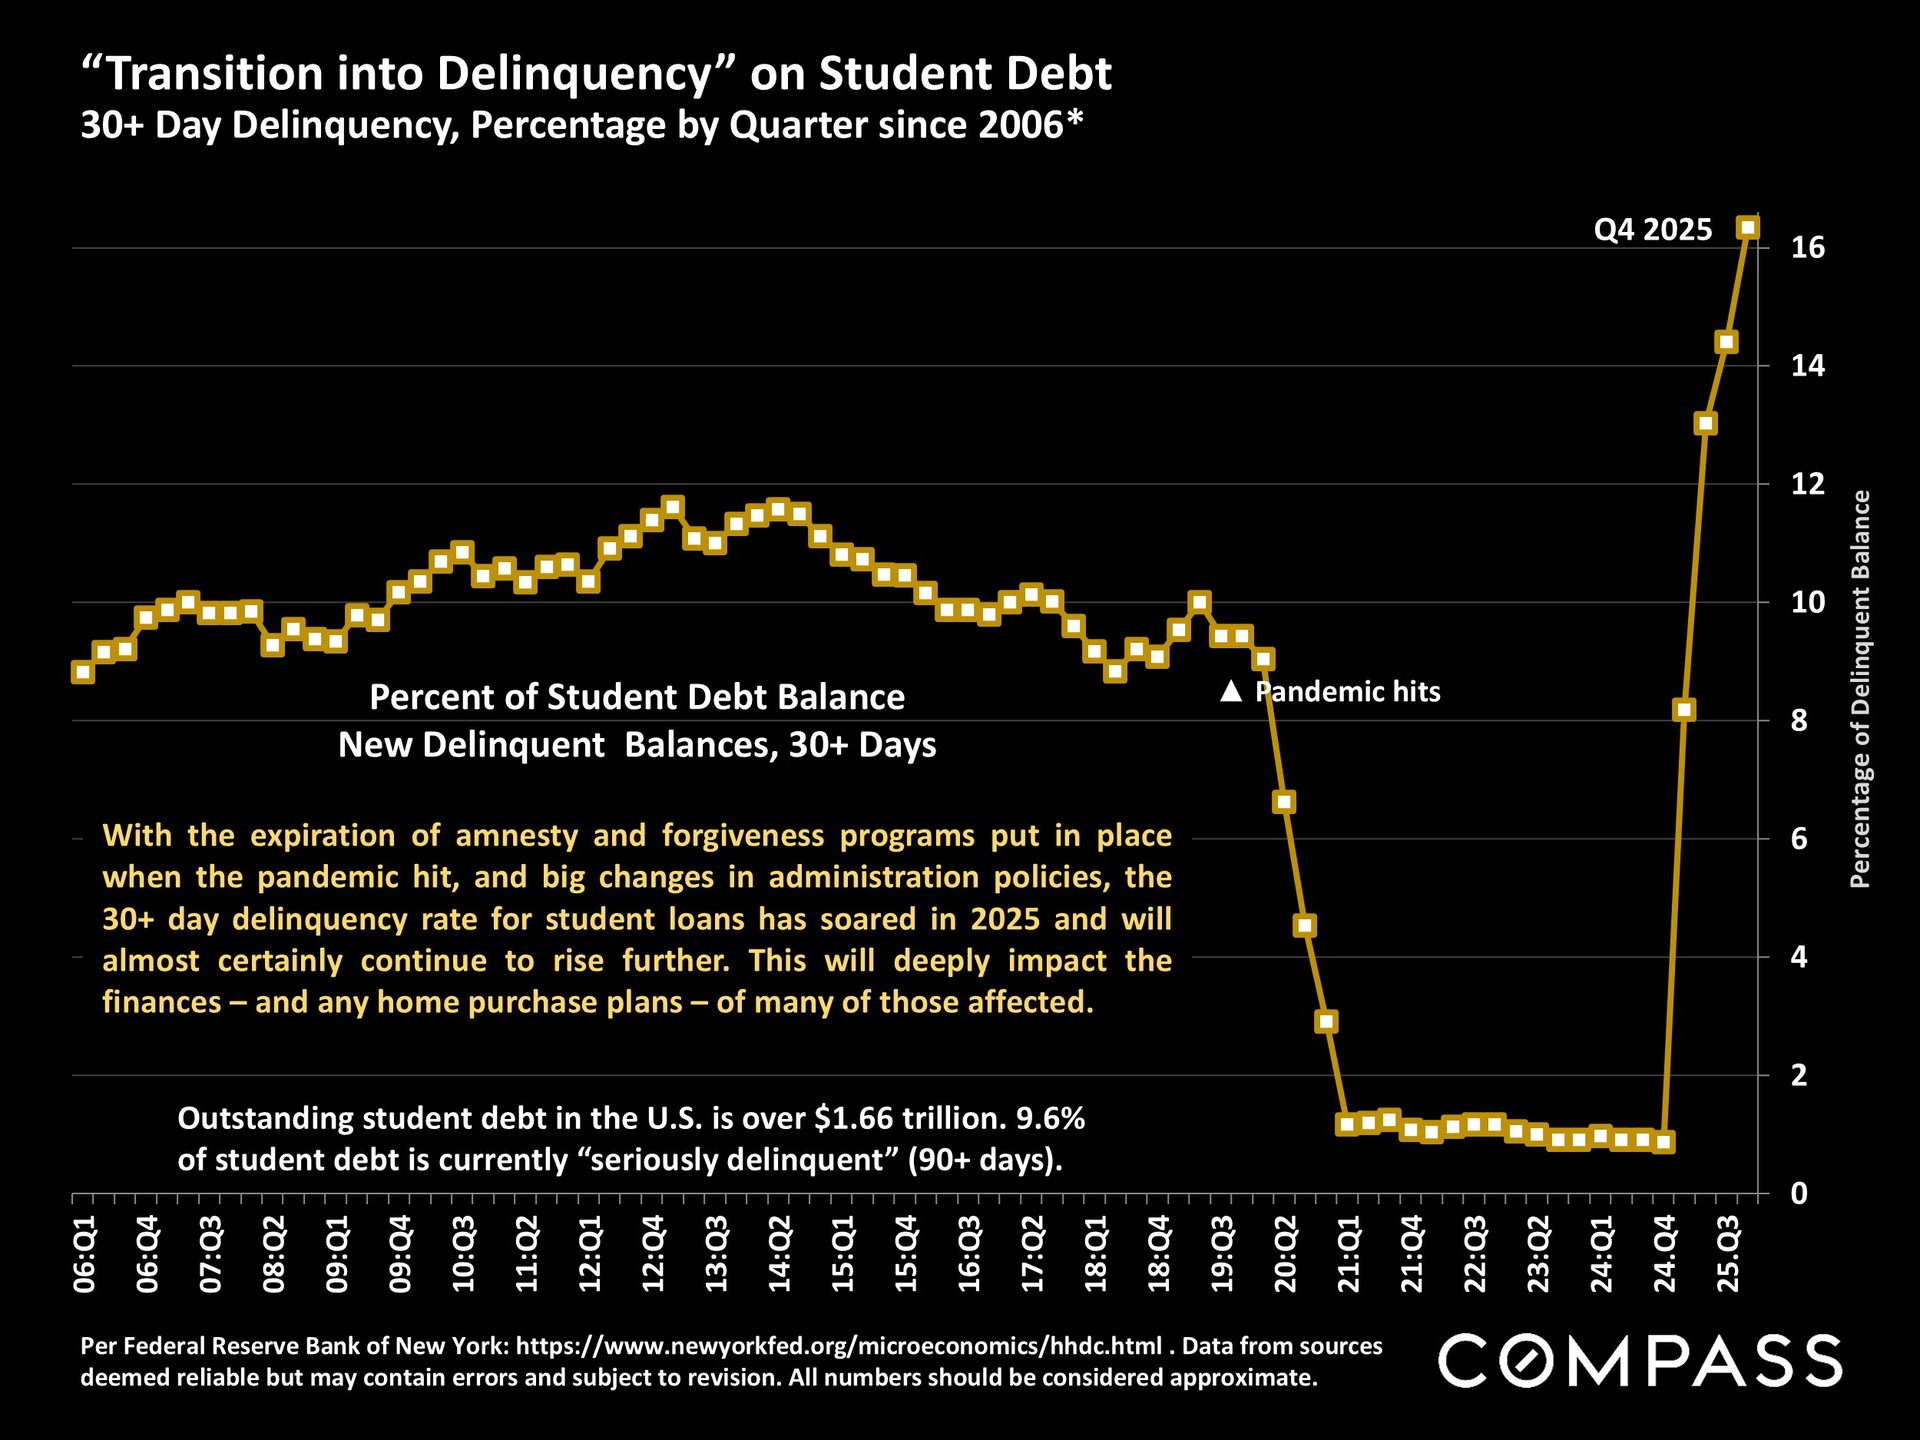
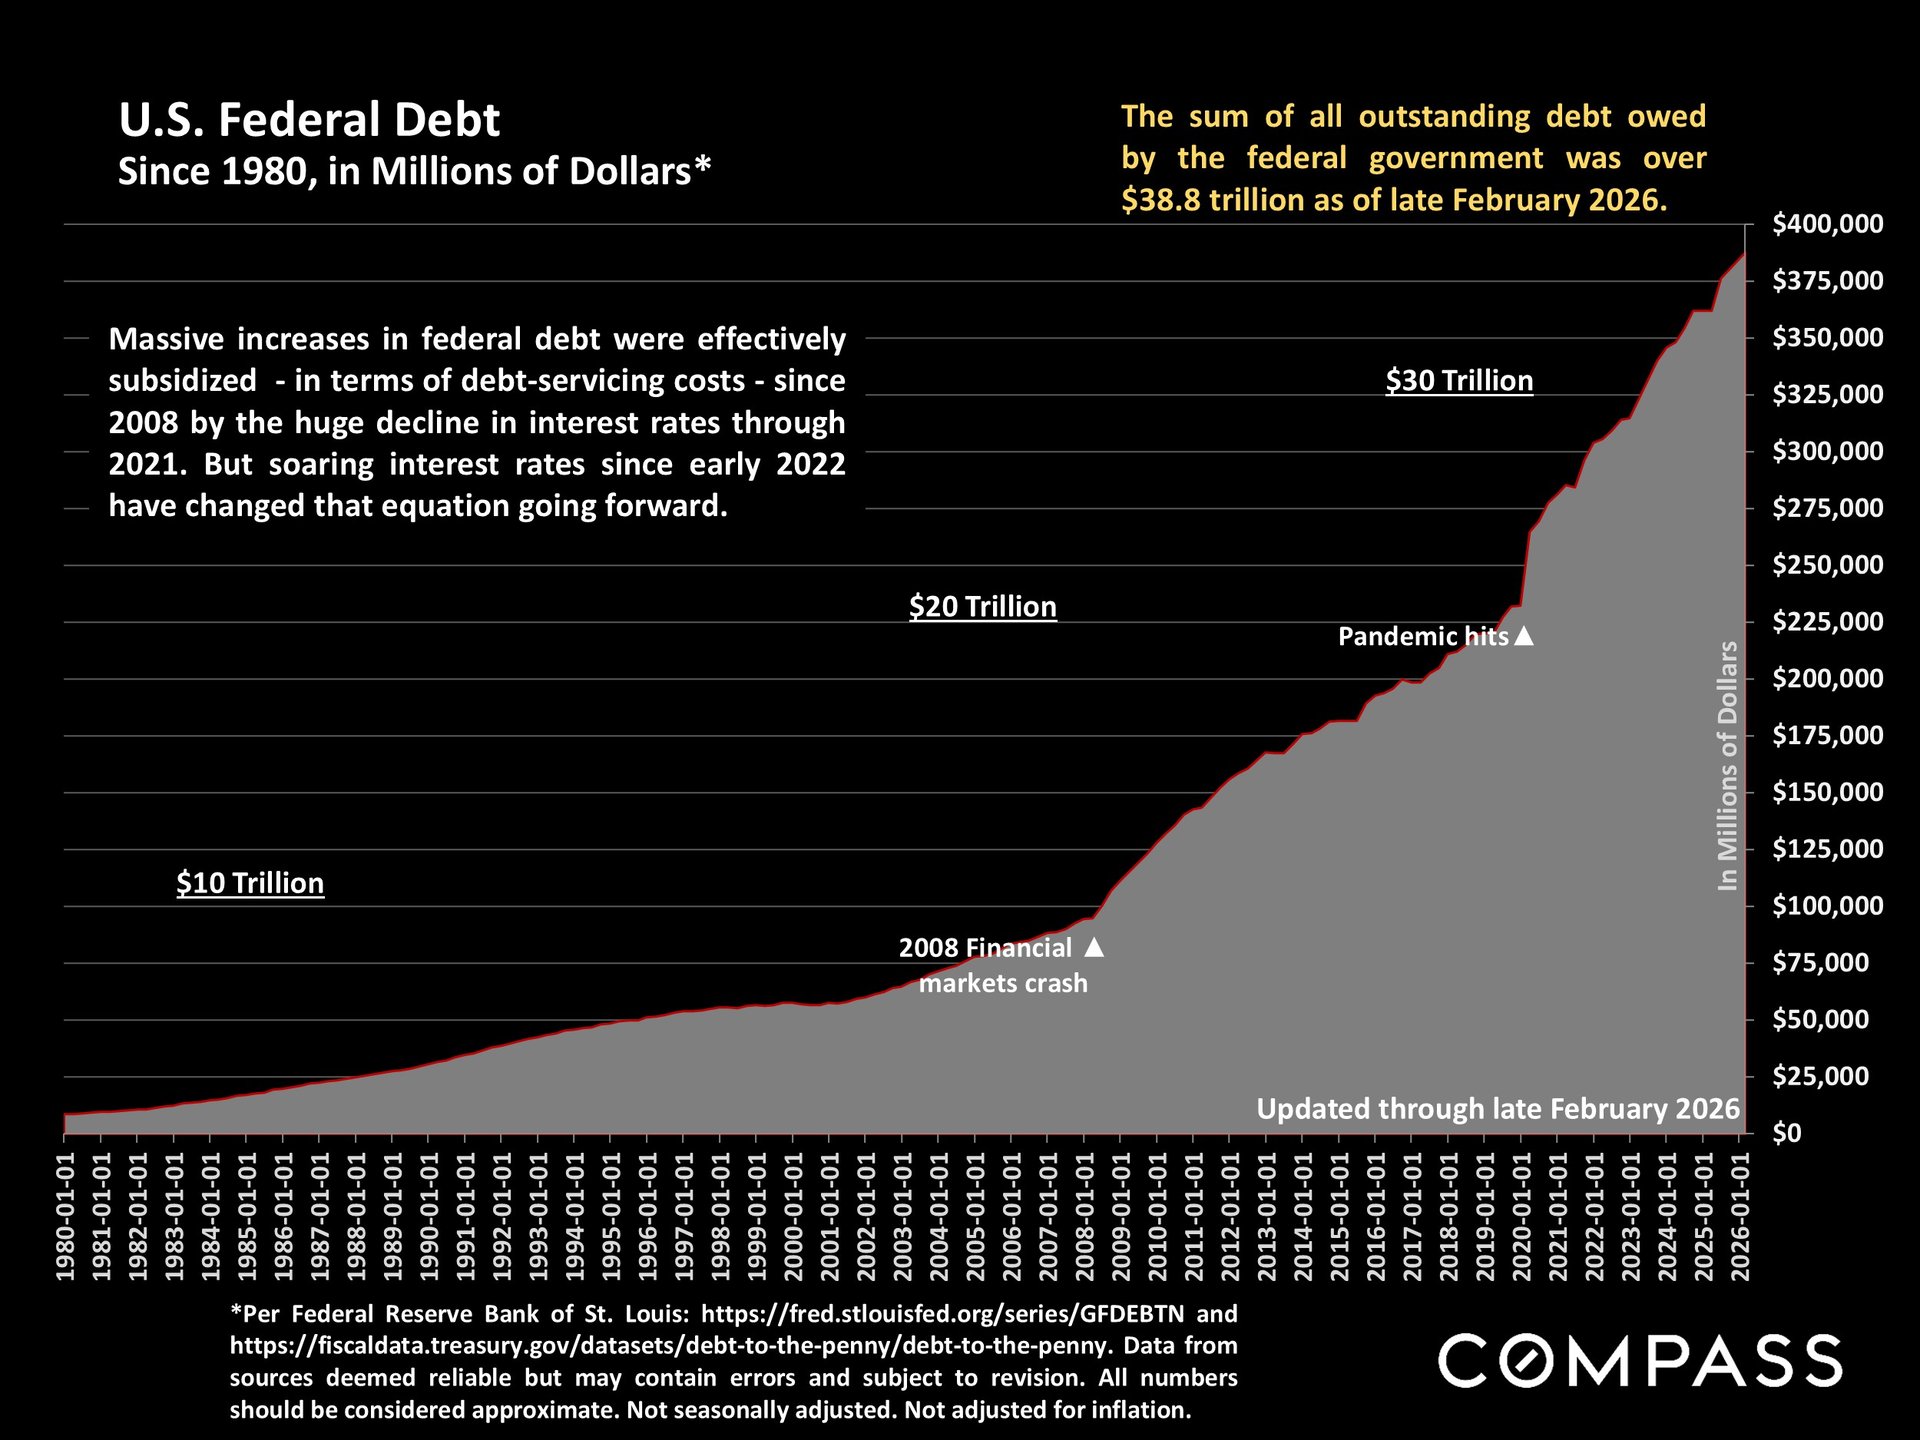
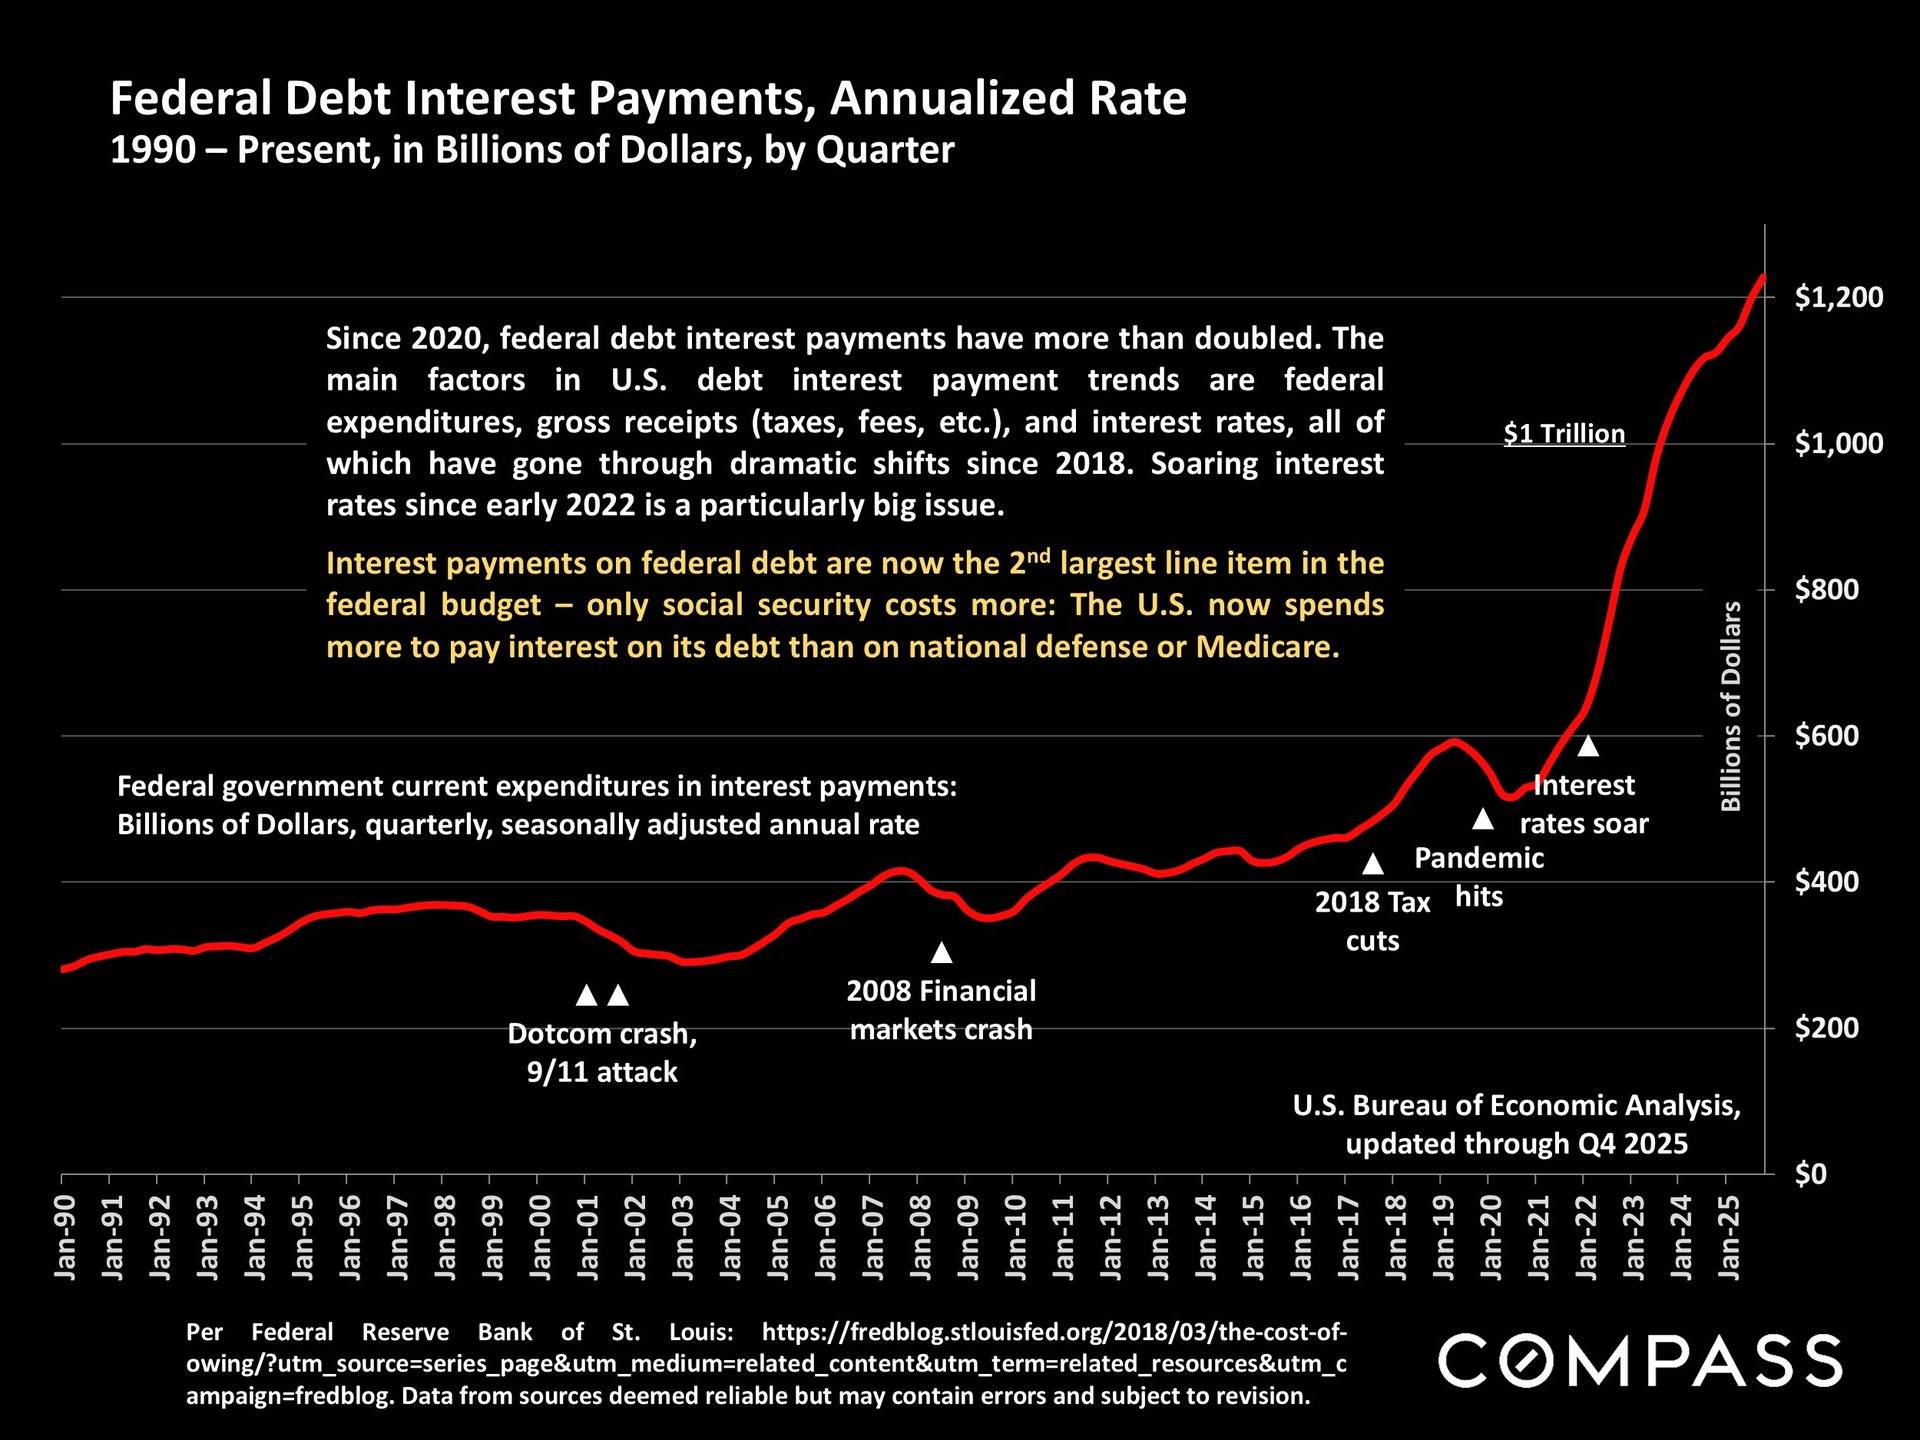
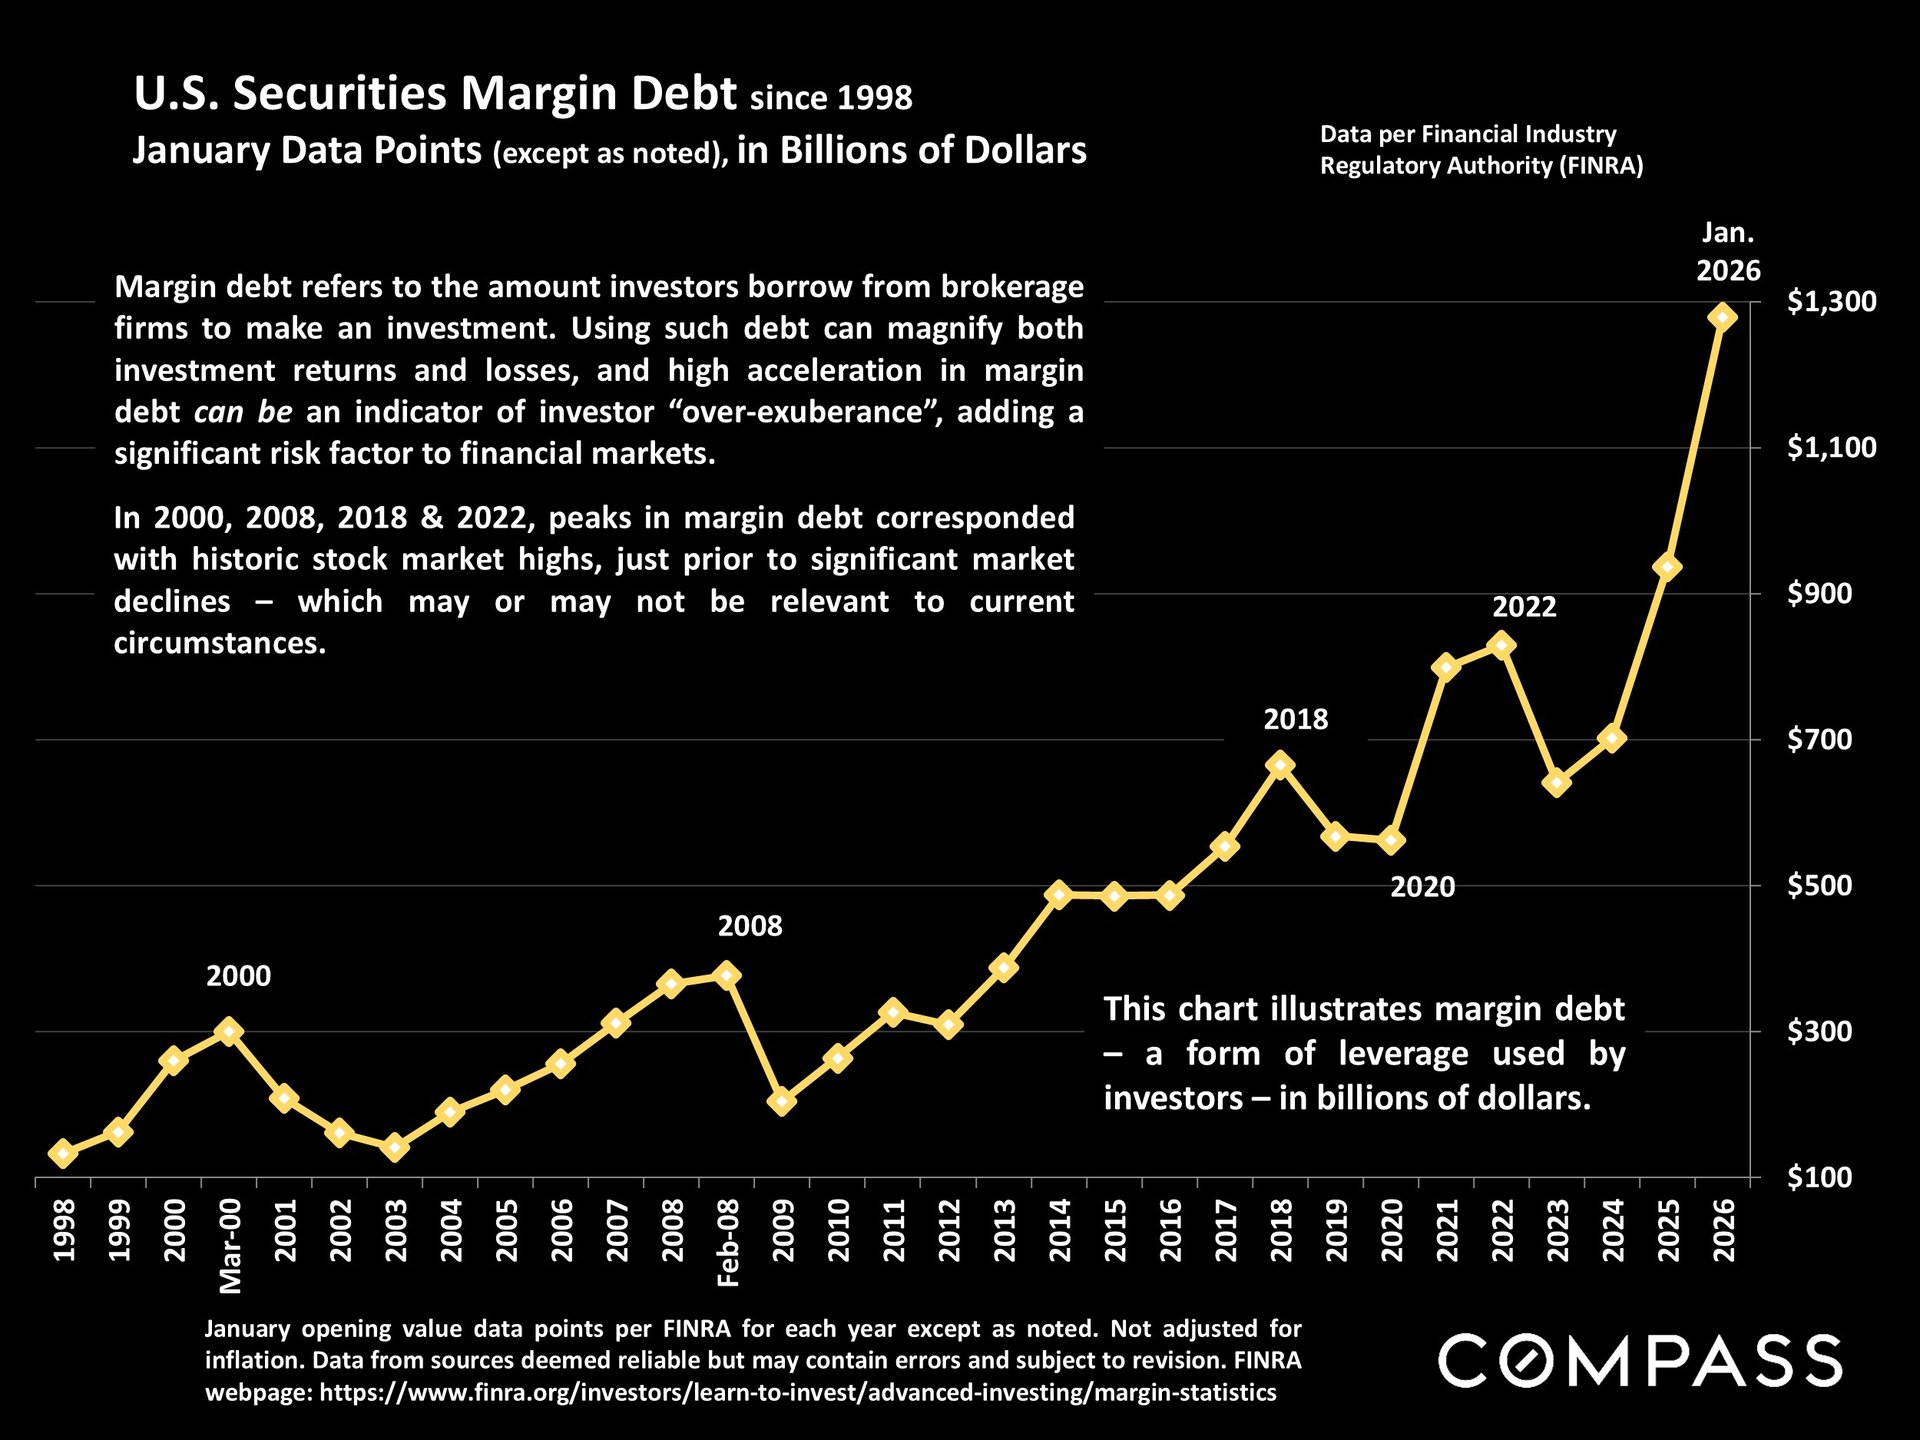
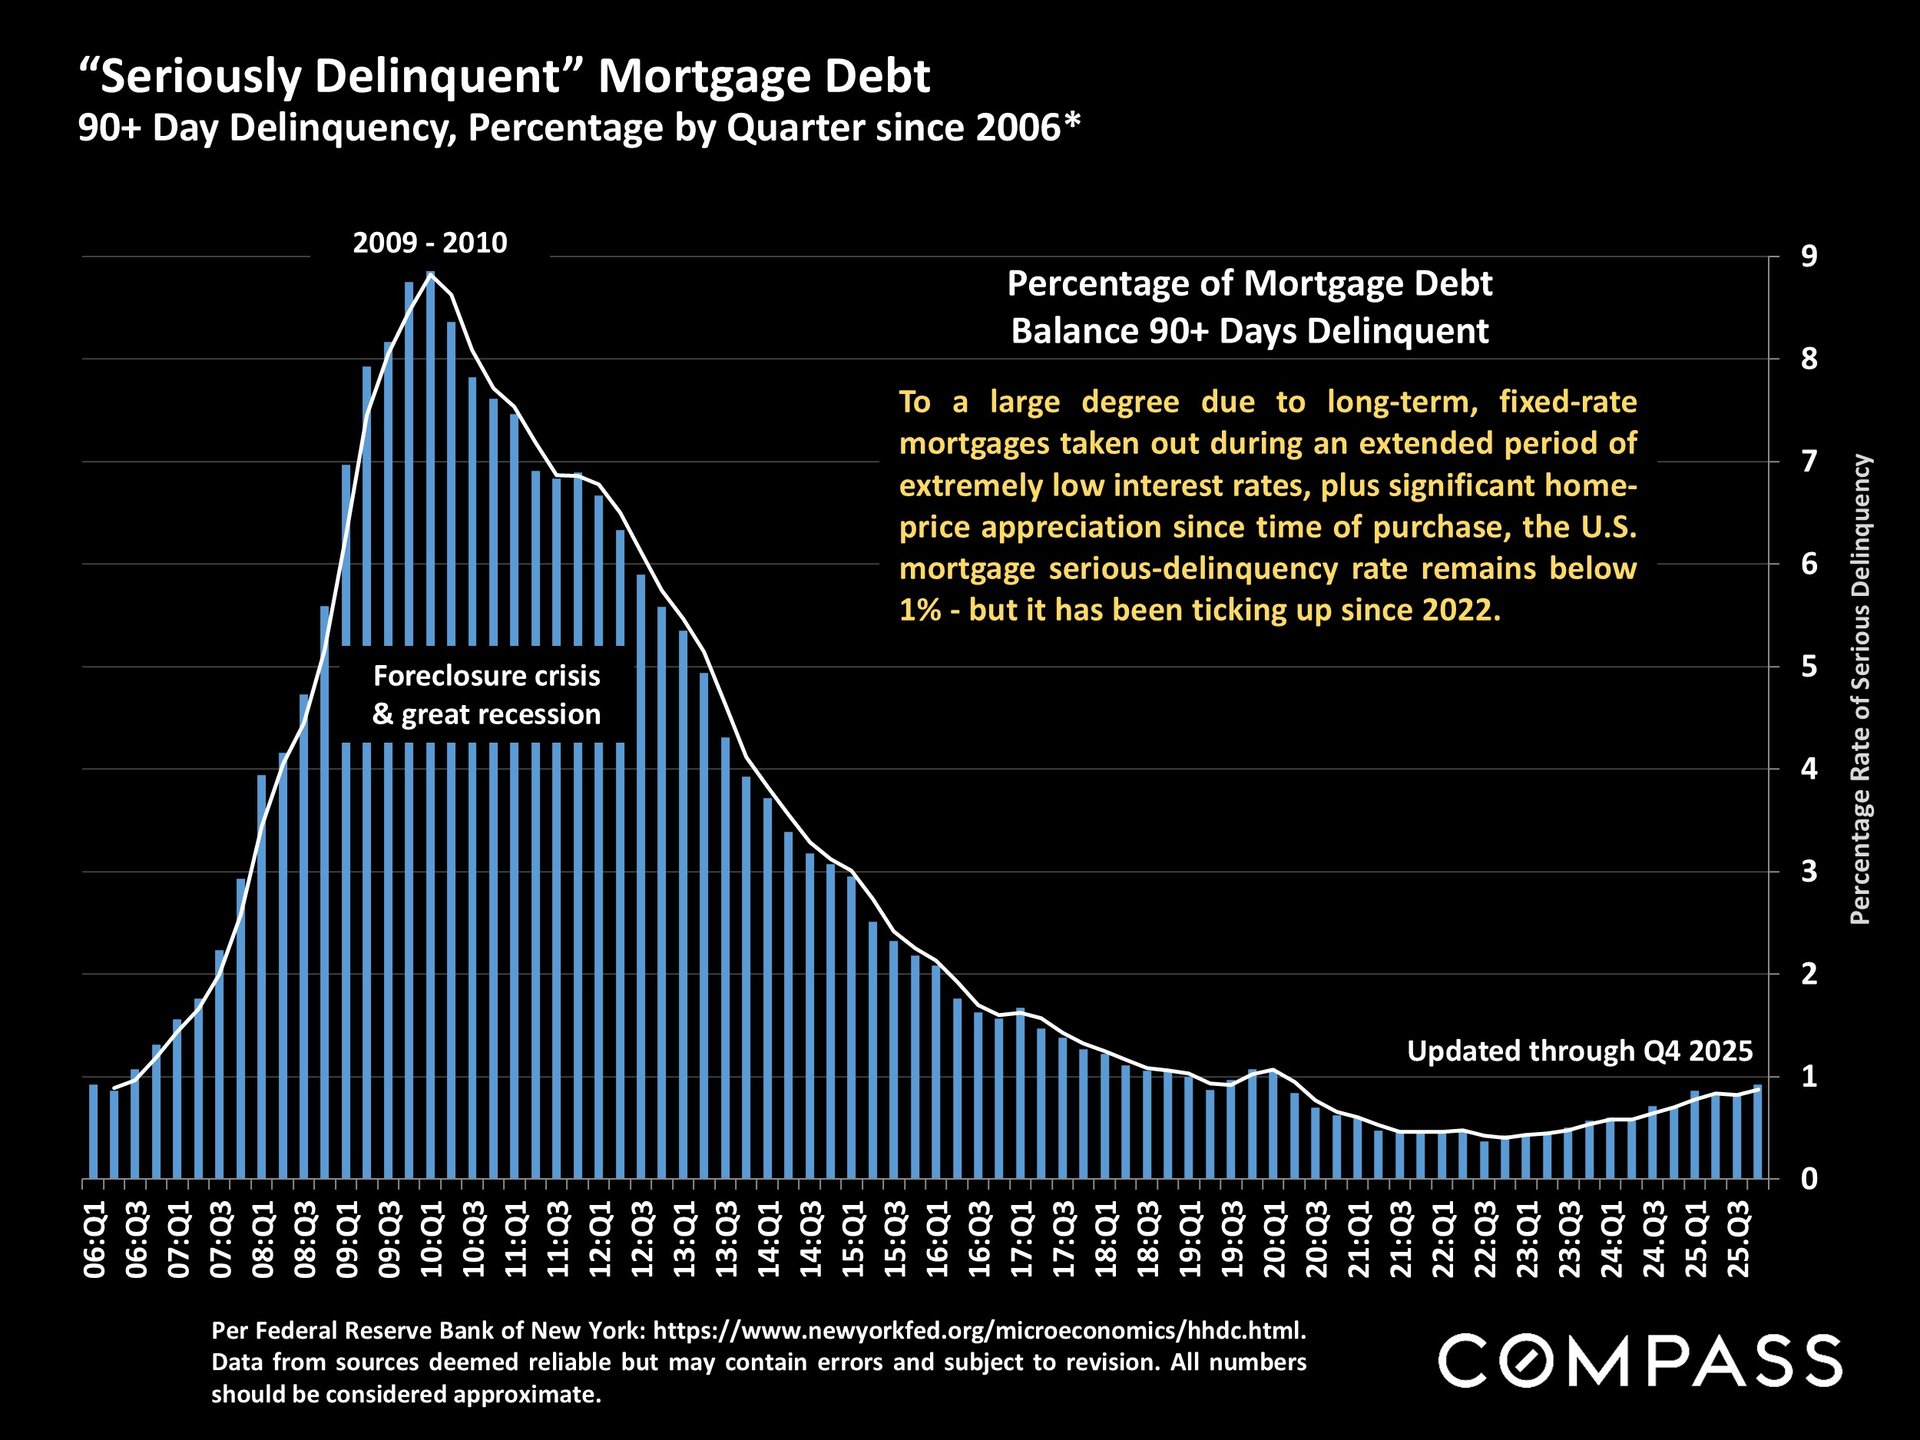
Mortgage debt delinquency remains very low by long-term standards, as illustrated below, but delinquencies for the lowest-income bracket rose from 0.5% in 2021 to nearly 3% by the end of 2025, more than triple the overall rate.
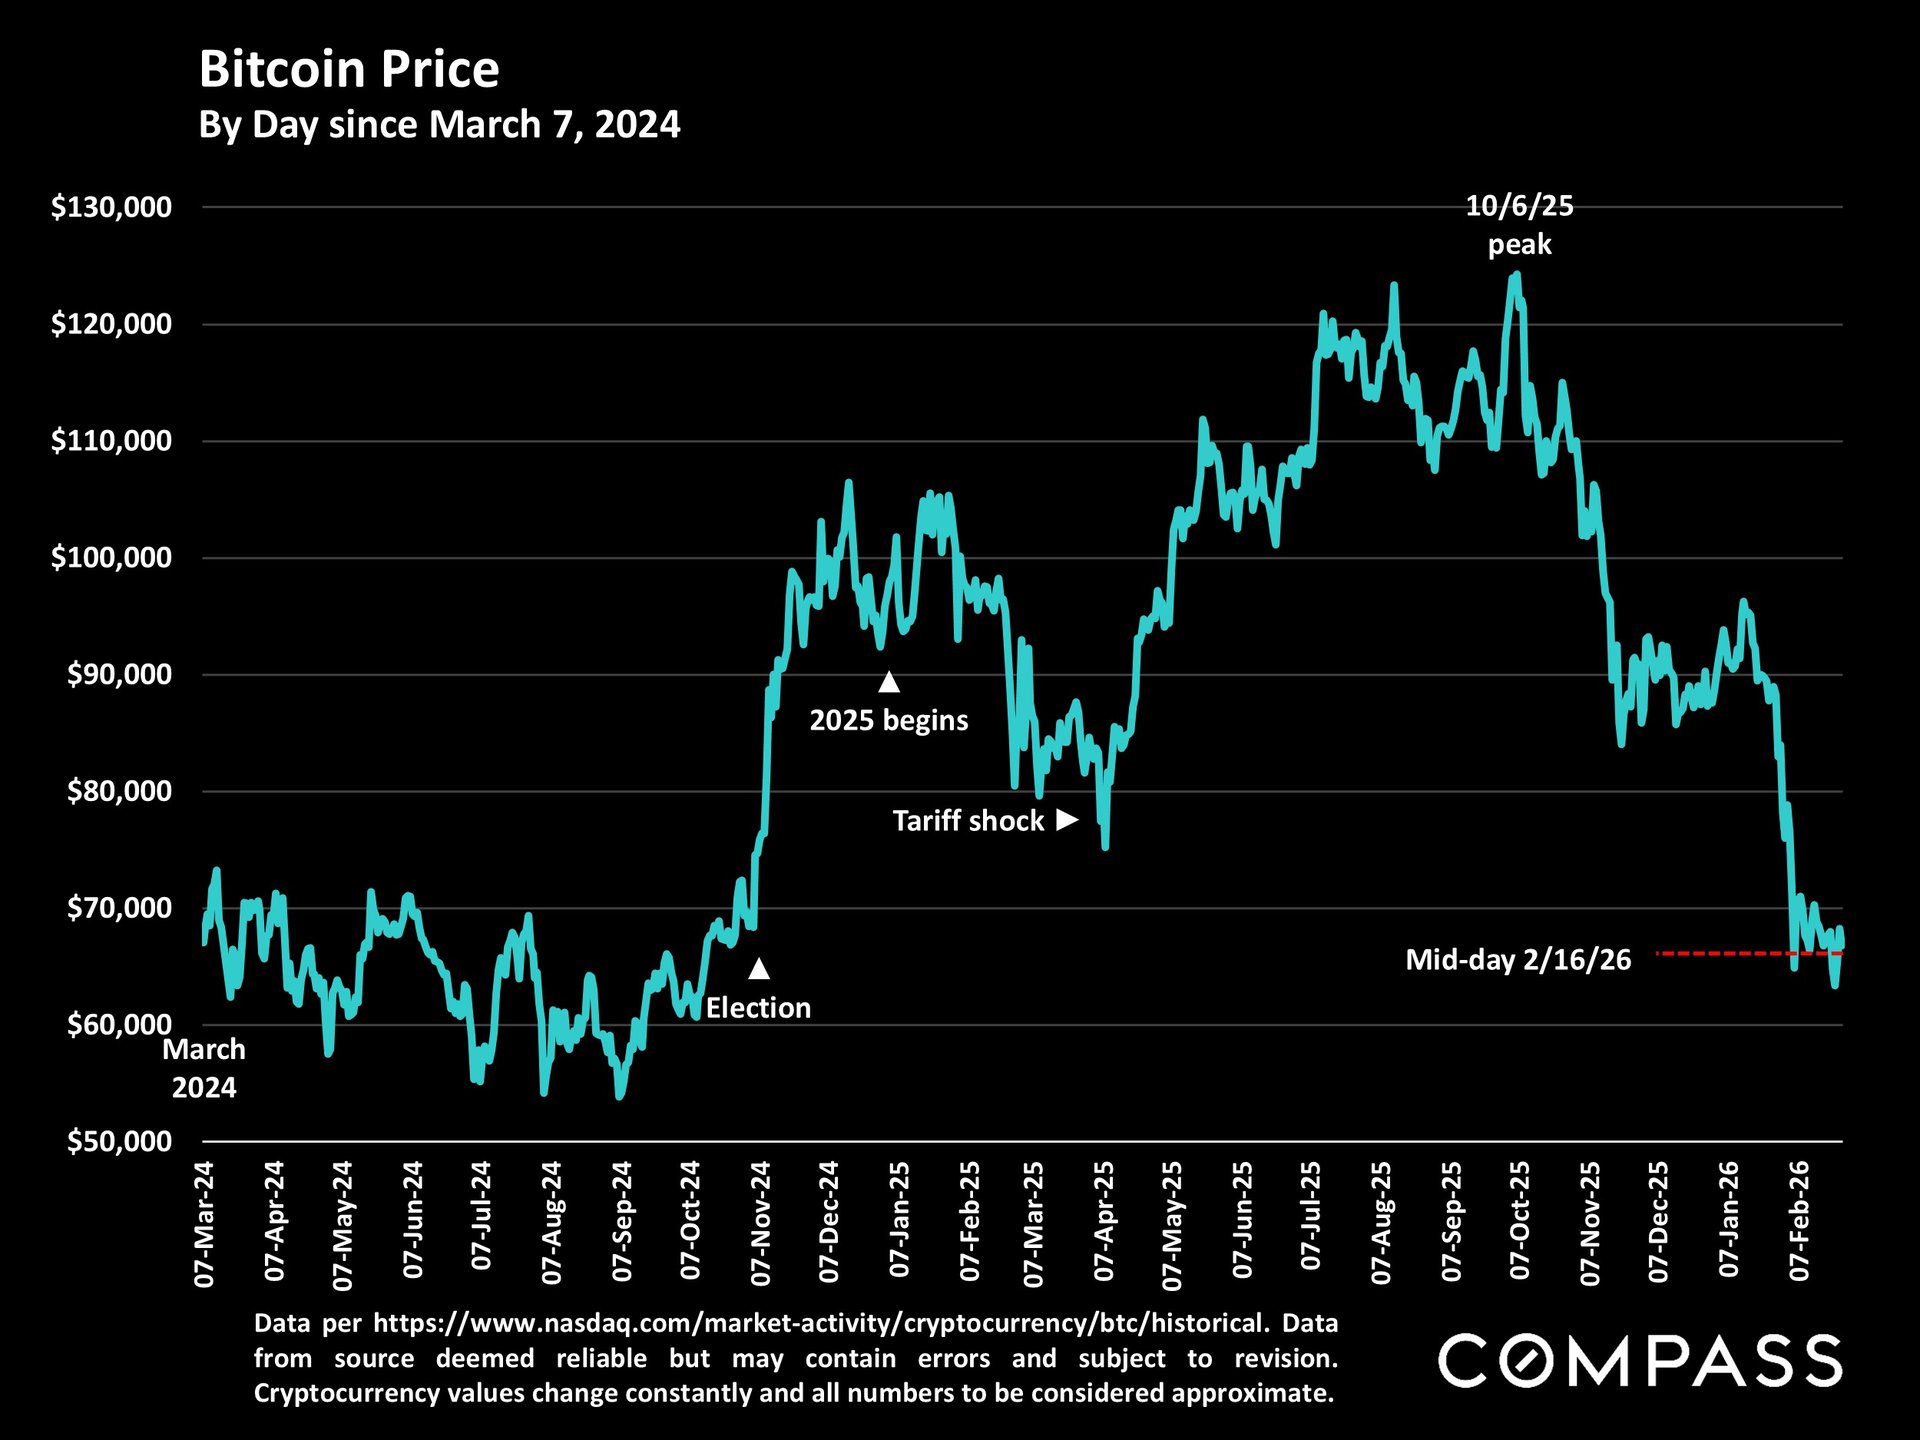
Price of Bitcoin: