
Though Covid-19 upended many normal seasonal trends this year, the market did begin its typical “holiday season” slowdown in November - however activity remained well above levels of last year. It is unknown how the latest pandemic circumstances may affect the market in December, which is usually by far the slowest month of the year.
More importantly, we hope you and your loved ones stay safe and well during this challenging holiday season.
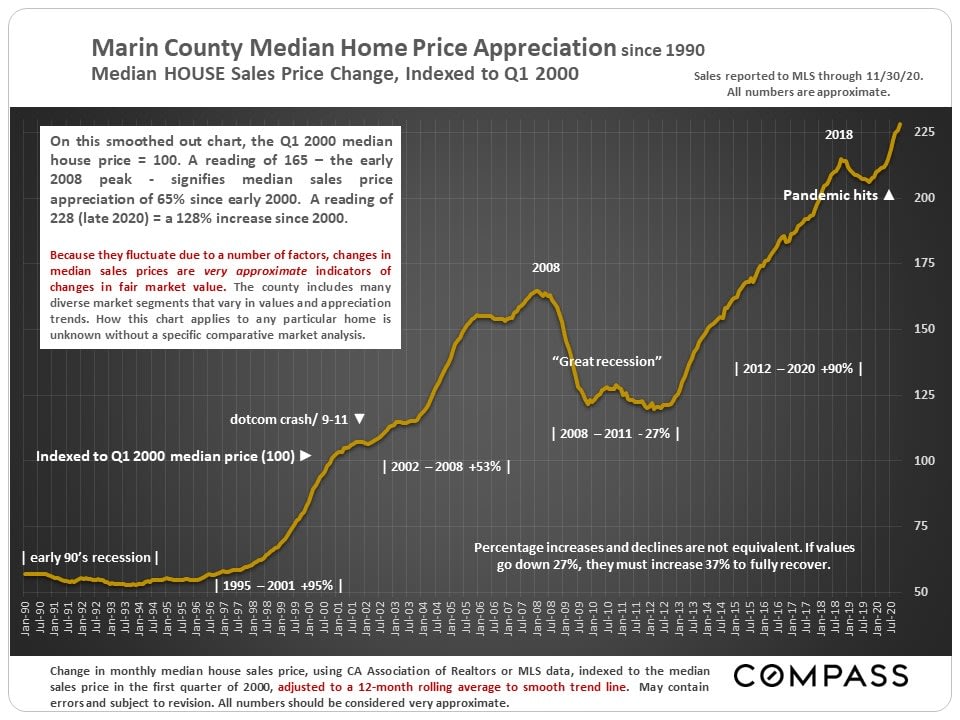
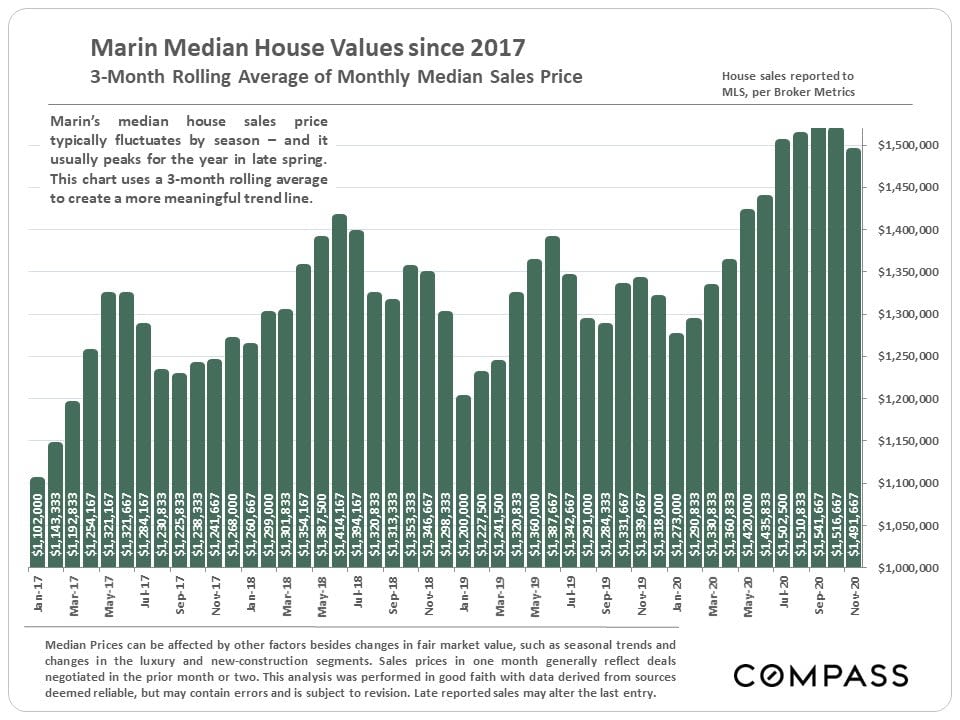
This first chart below tracks percentage changes in median house sales price since 1990. It is based upon the Q1 2000 price being indexed to 100: A reading of 50 signifies a median price half that in Q1 2000; 200 means the price has doubled since then. In early 1990, the Marin median house price was about $350,000; it is currently running about $1,525,000.
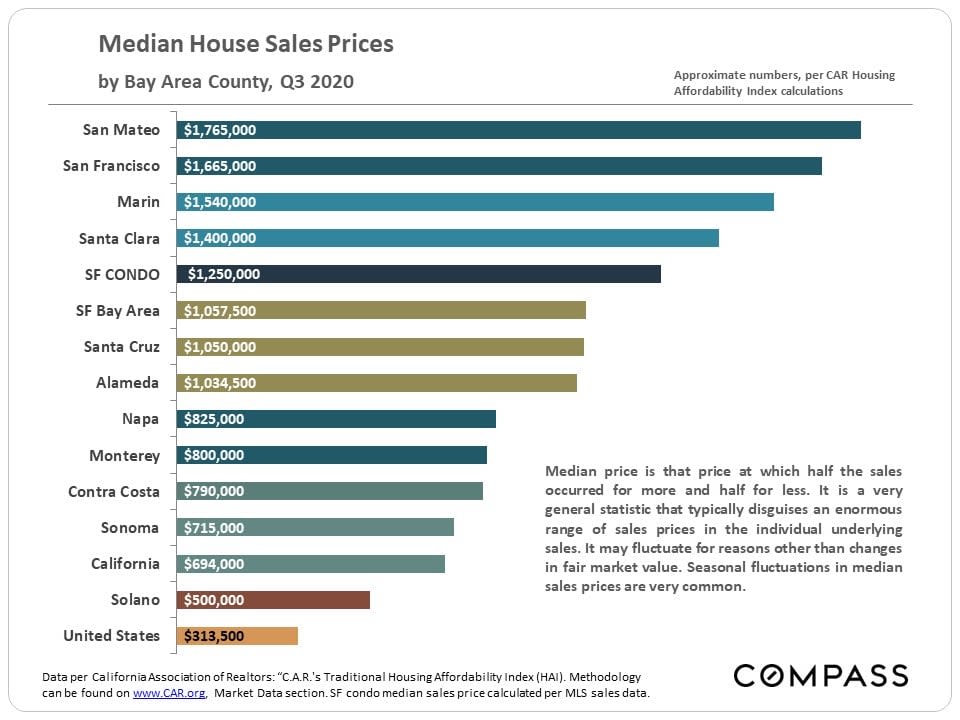
Below is a survey of Q3 2020 median home prices around the Bay Area.
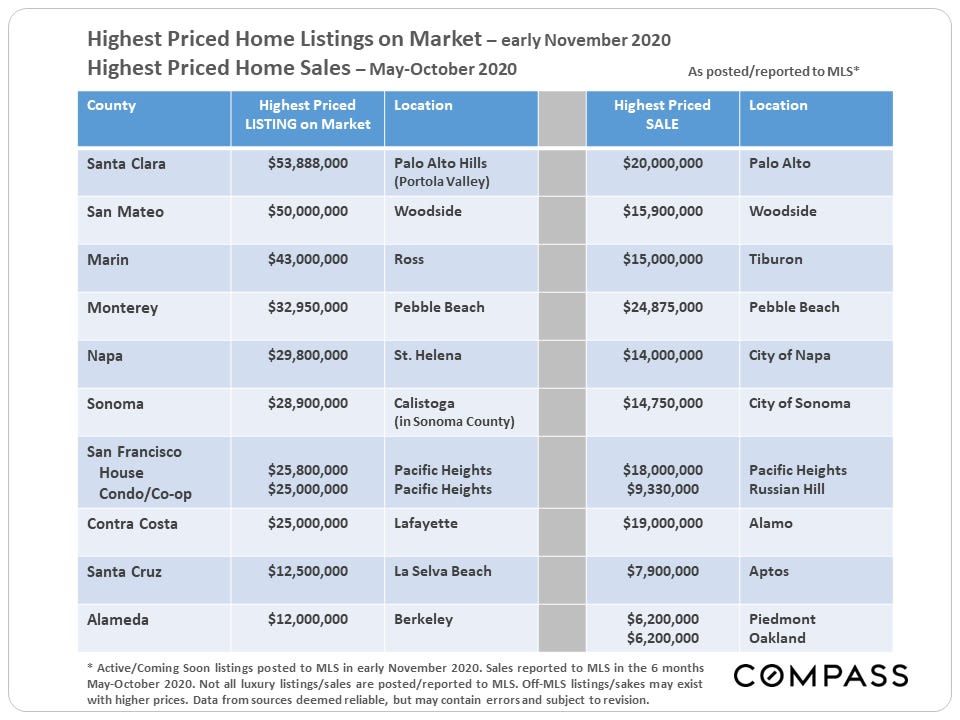
Highest priced listings on the market in early November, and the highest priced MLS home sales occurring May through October 2020, by Bay Area County.
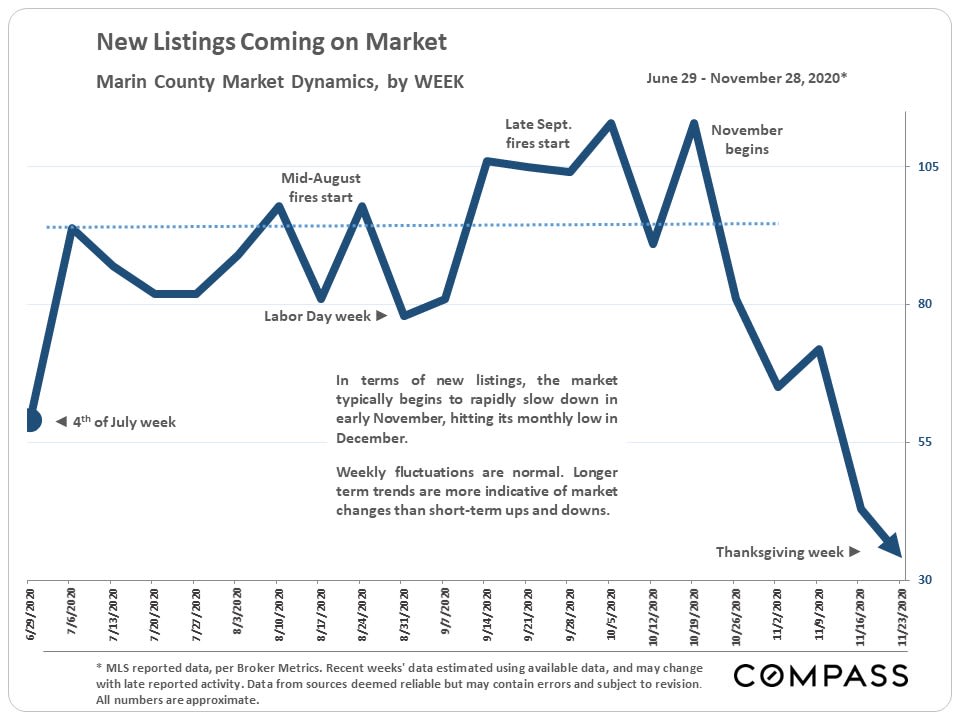
As is typical, the number of new listings plunged in November. In the first week of December - not illustrated on this chart - new listing activity ticked back up from the short Thanksgiving week, but remained well below pre-November numbers. December is usually the month with the fewest new listings coming on market.
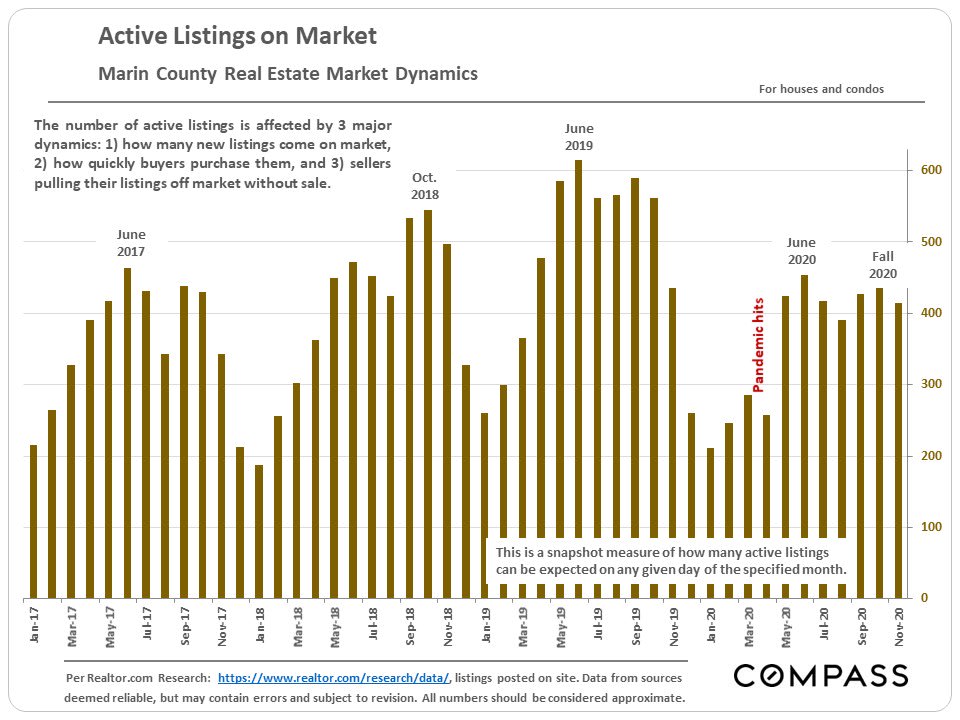
A major factor in the Marin market has been the relatively low number of active listings available for purchase.
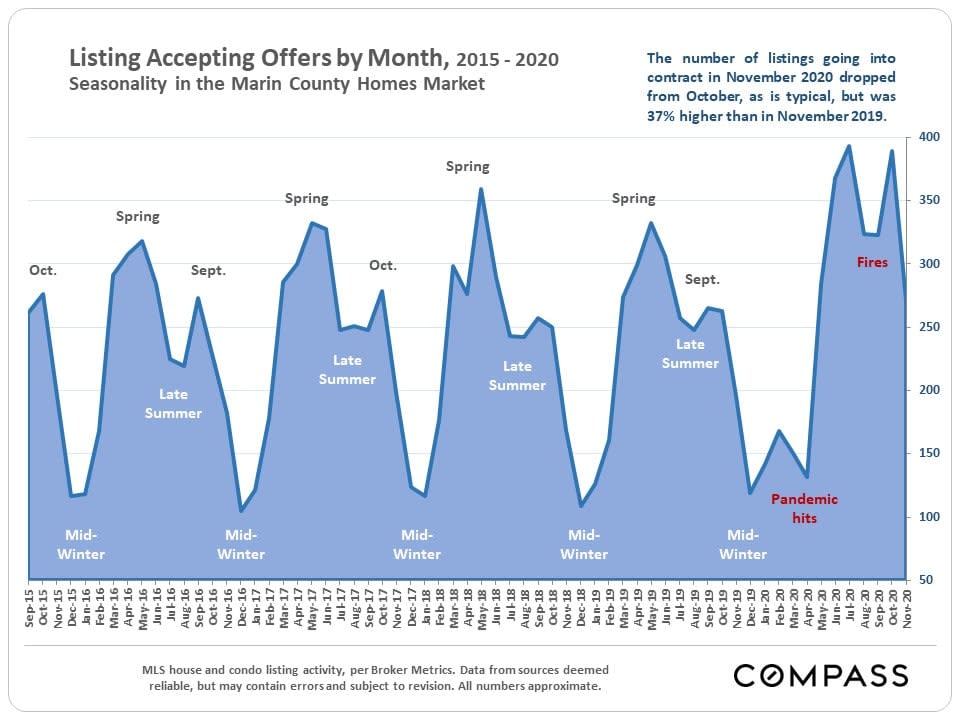
Market activity as measured by the number of listings going into contract, though dropping in November - as is the normal seasonal trend - was significantly higher on a year-over-year basis: 37% higher than in November 2019.
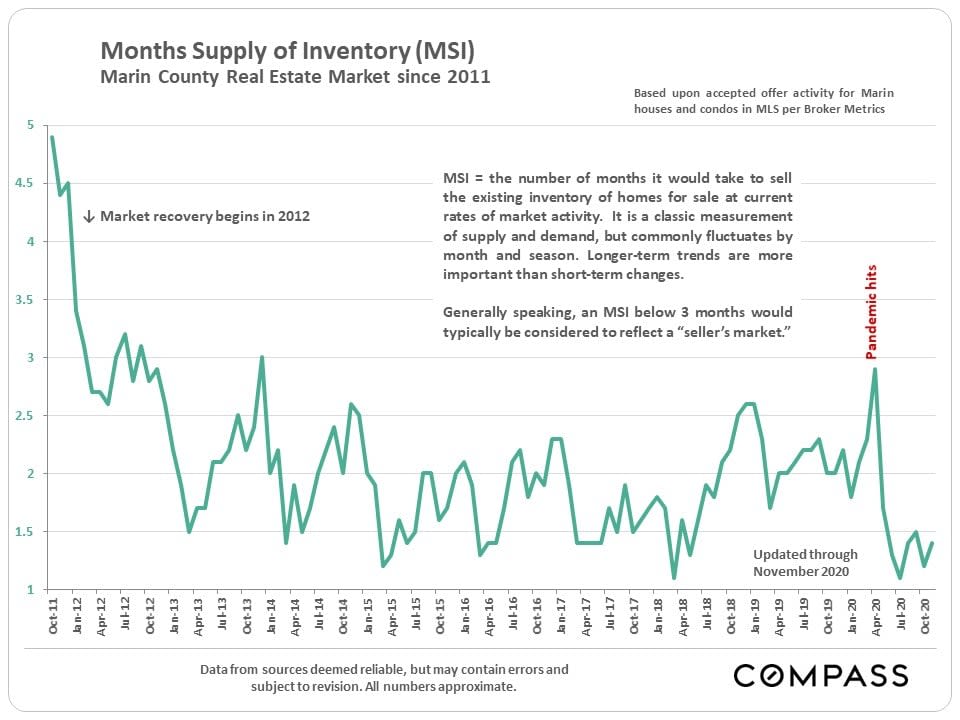
A standard measure of supply and demand, months-supply-of-inventory has been bumping along at extremely low levels in recent months.
A stronger, higher demand market = fewer price reductions.
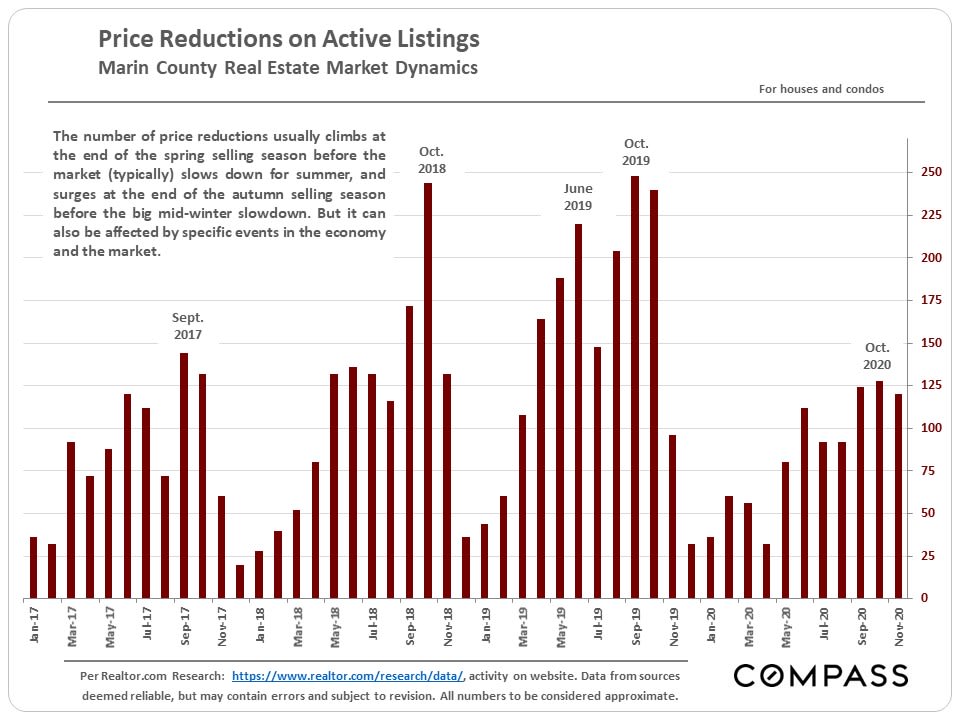
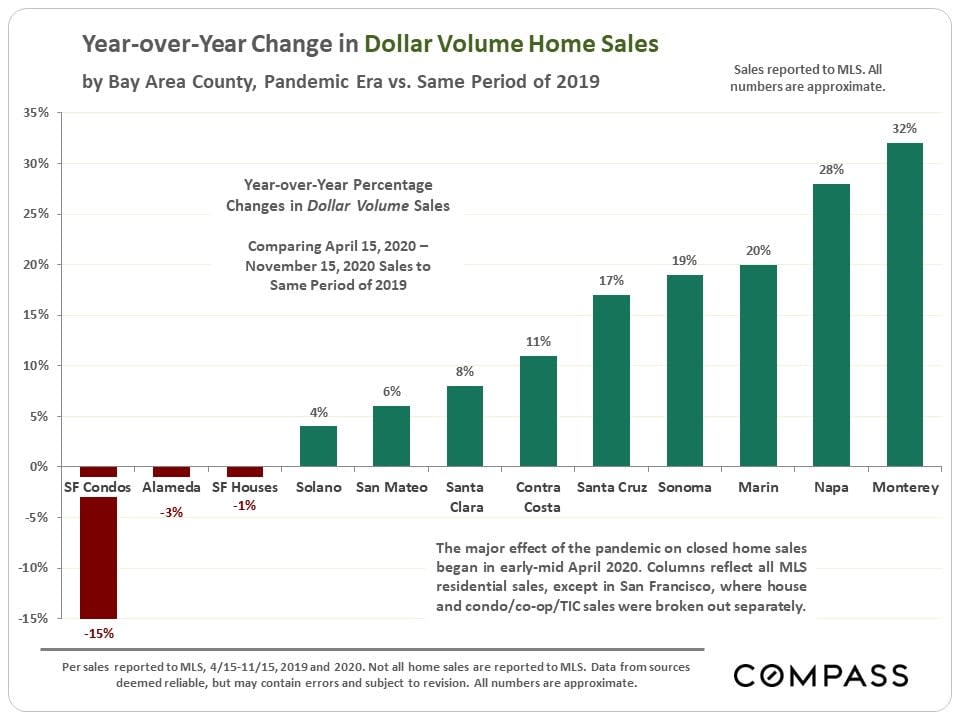
Marin County has seen one of the highest year-over-year increases in dollar volume sales, exceeded only by Napa and Monterey Counties.
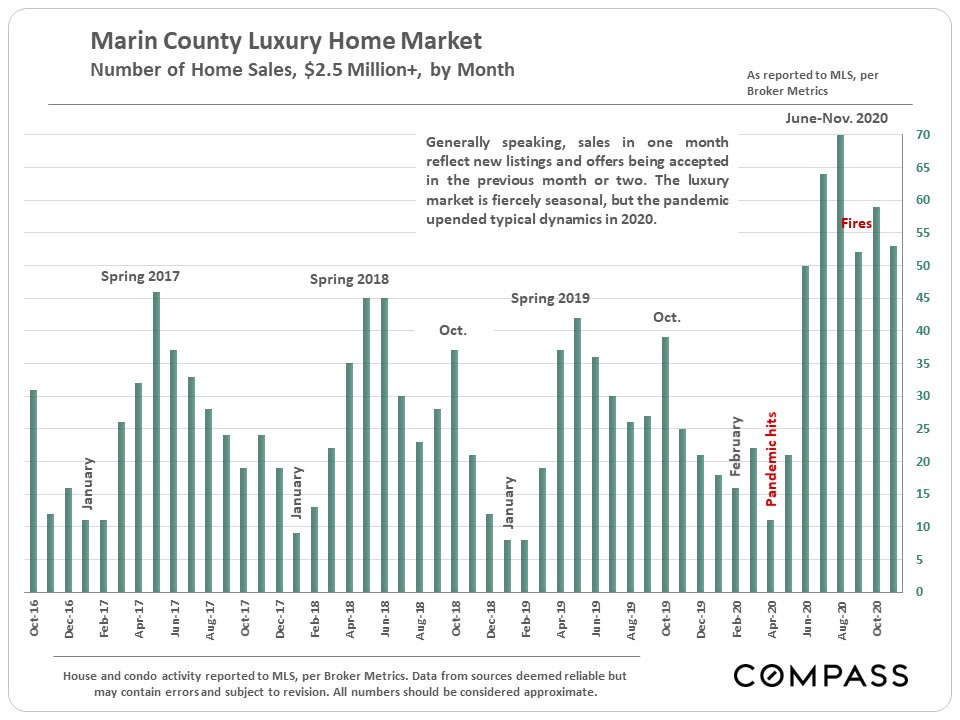
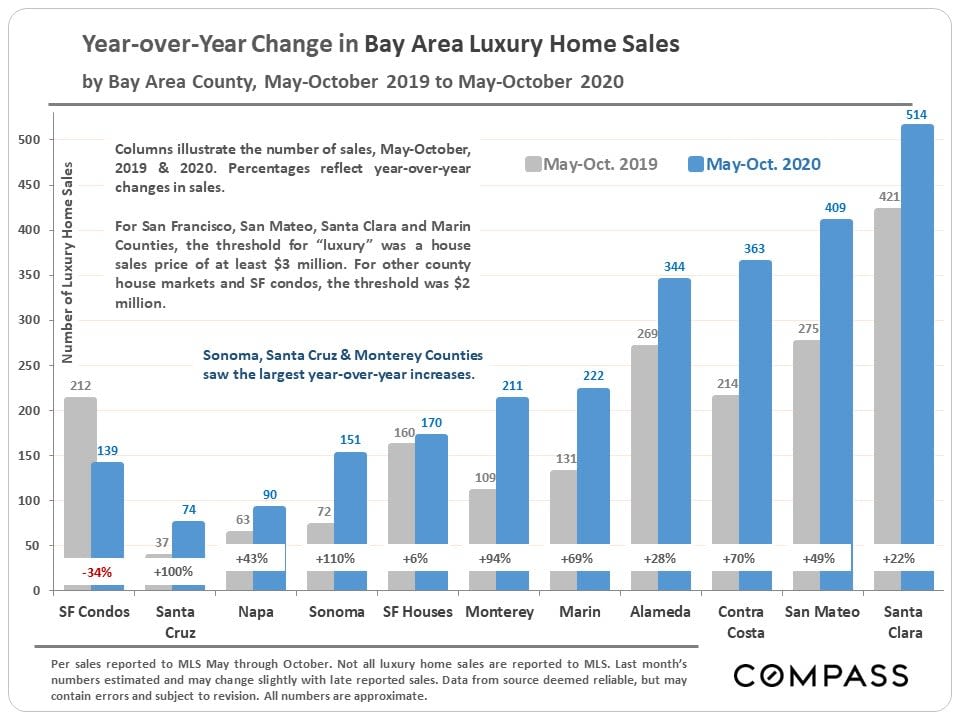
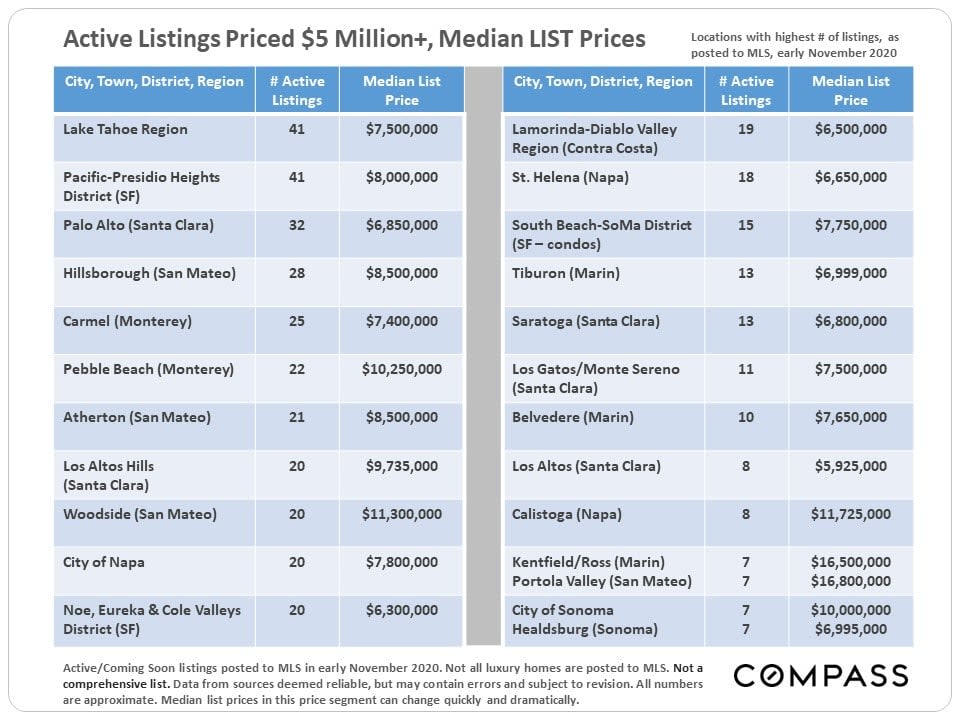
4 charts and tables on the Marin County and Bay Area luxury home markets. Most counties have seen an explosion of demand for big homes in exclusive locations. Sales volumes in several counties would certainly have been higher if not for the terrible fires.
Annual median sales prices for houses of 5+ bedrooms, 3+ baths, 3500+ square feet in the more expensive communities of the 4 most expensive counties.
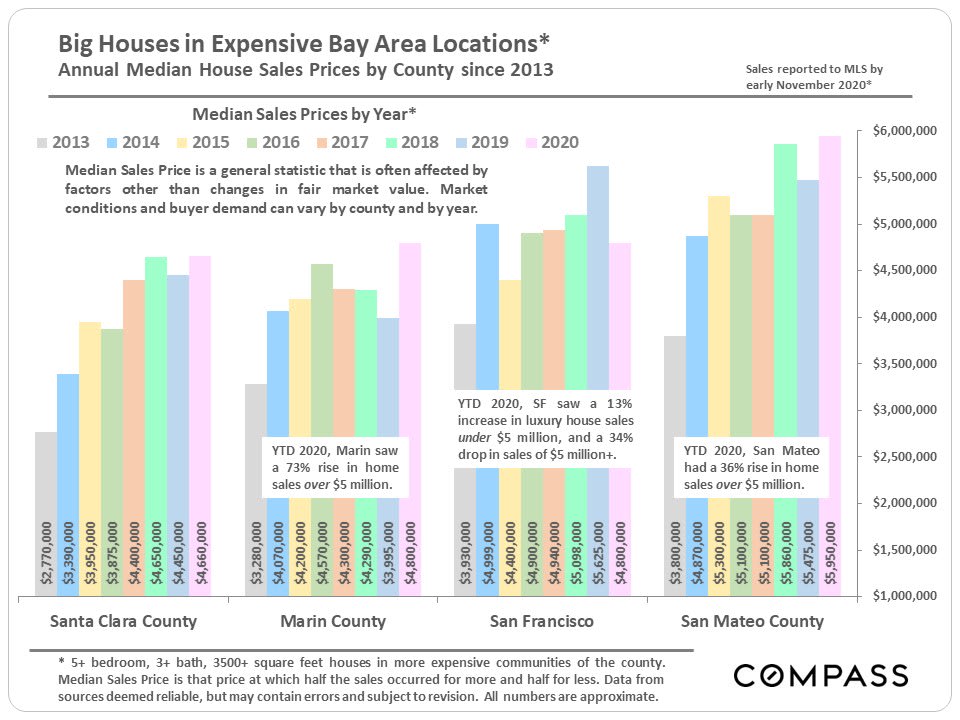
If you're looking for a home priced $5 million and above, these are the places where you will have the greatest choice of listings. In Marin, most of the highest priced markets are quite small as measured by the number of listings and sales.
Want a hyper local market update?
Contact us at [email protected]