Marin County Real Estate Market Seasonality

Marin County Real Estate Market Seasonality

  • Faber Real Estate Team
  • September 21, 2020

Marin County real estate market seasonality graphic with four seasonal landscape photos and a Compass logo.

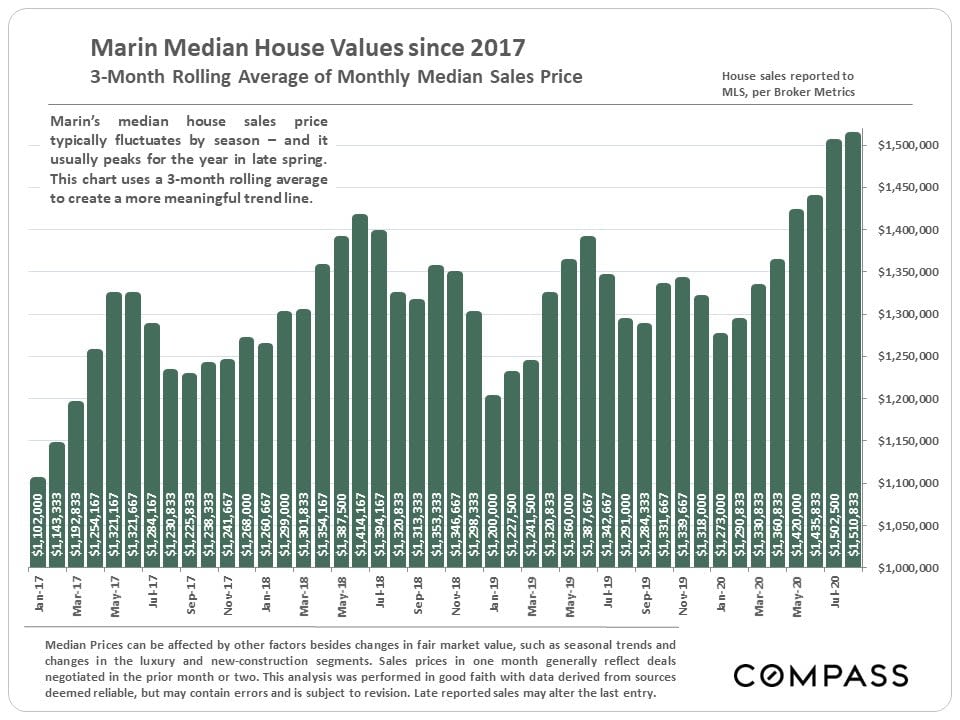
Bar chart of Marin County median house prices from 2017 to 2020, with seasonal peaks and rising values in 2020.

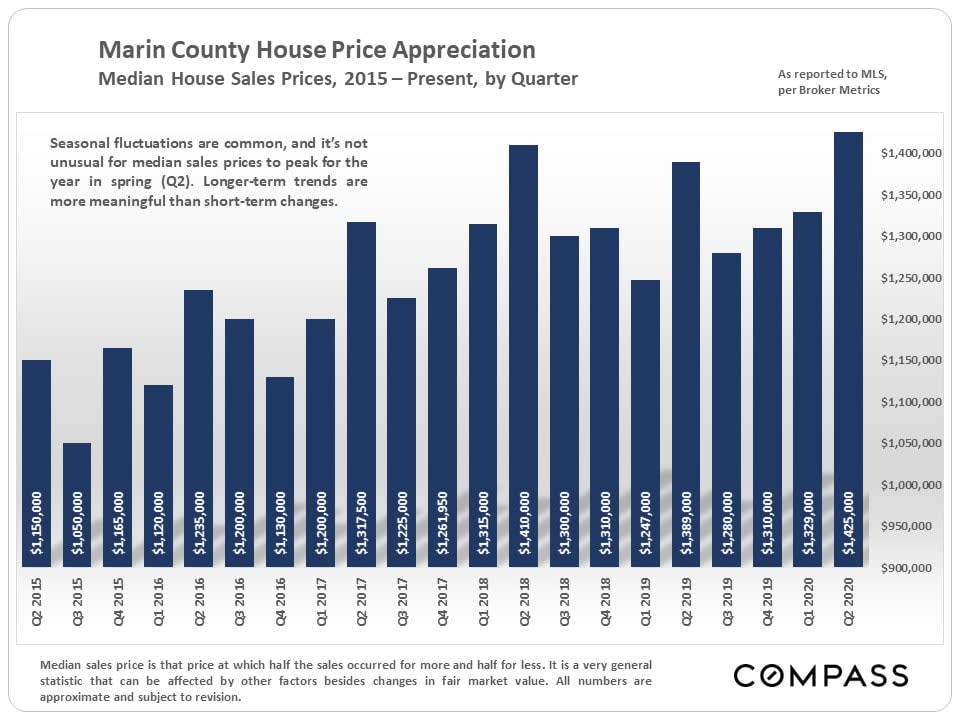
Bar chart of Marin County quarterly median house prices, rising from $1.15 million in 2015 to $1.425 million in Q2 2020.

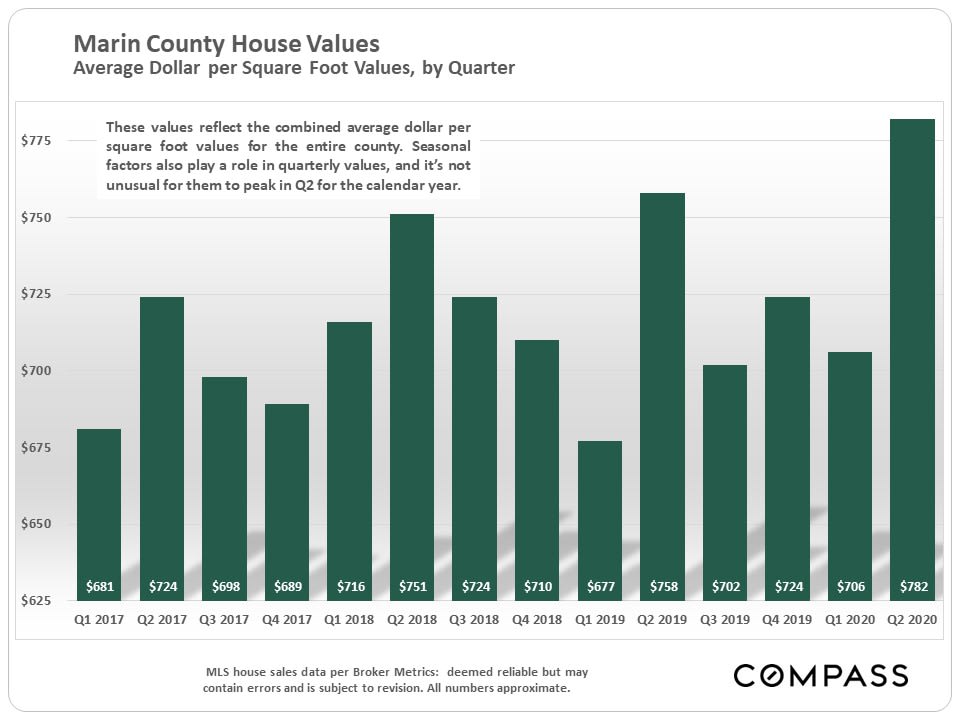
Bar chart of Marin County house values per square foot by quarter, from Q1 2017 to Q2 2020.

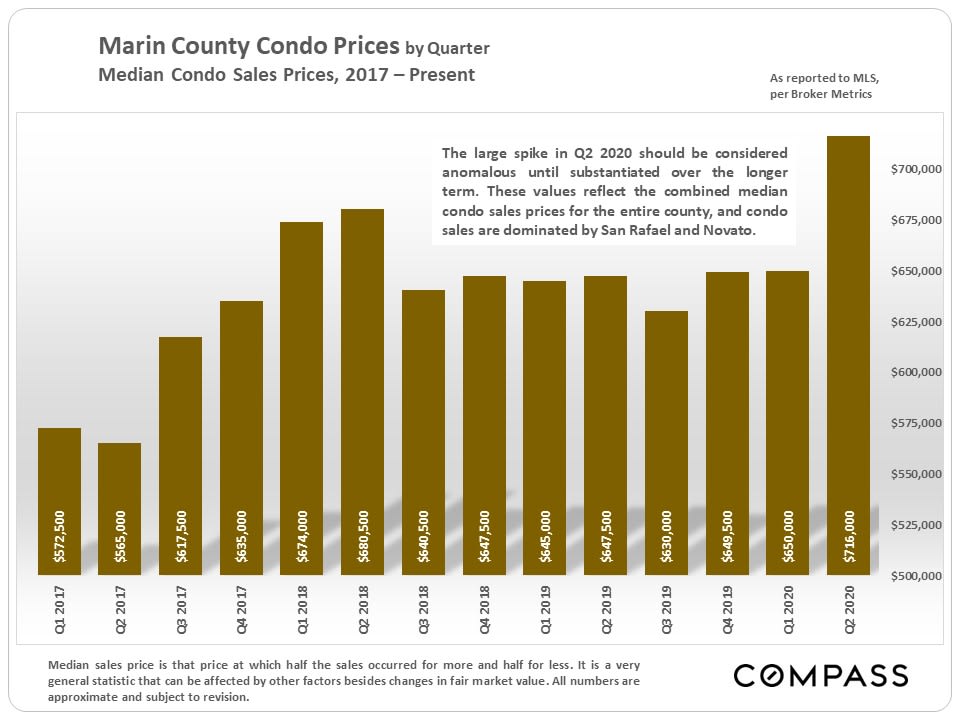
Bar chart of Marin County median condo prices by quarter, with a spike to $716,000 in Q2 2020.

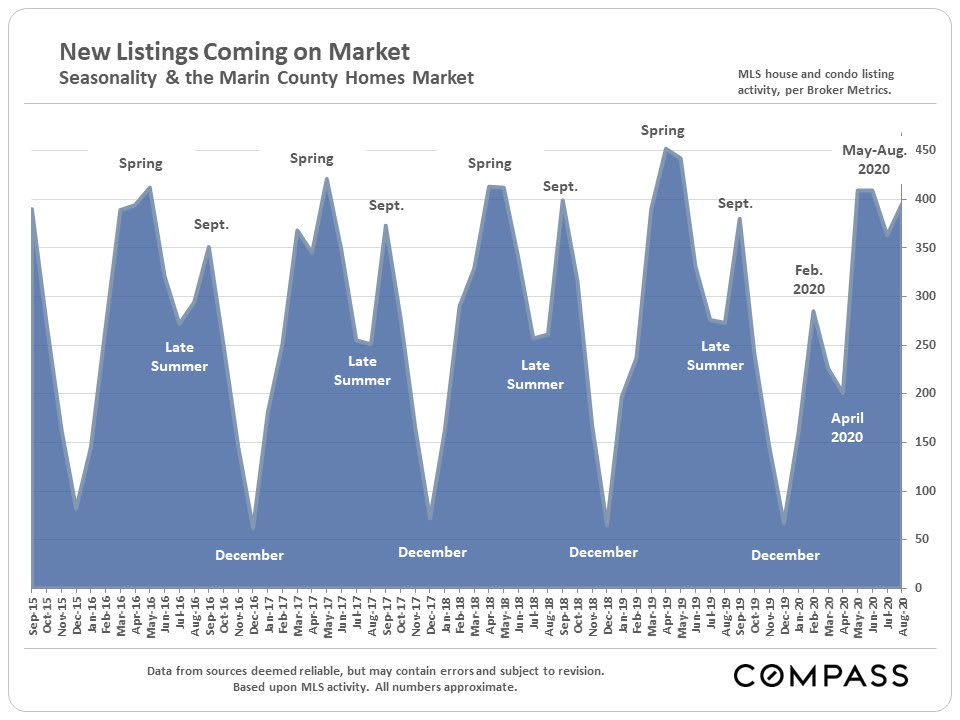
Chart of Marin County new listings, showing recurring spring peaks and December lows from 2015 to 2020.

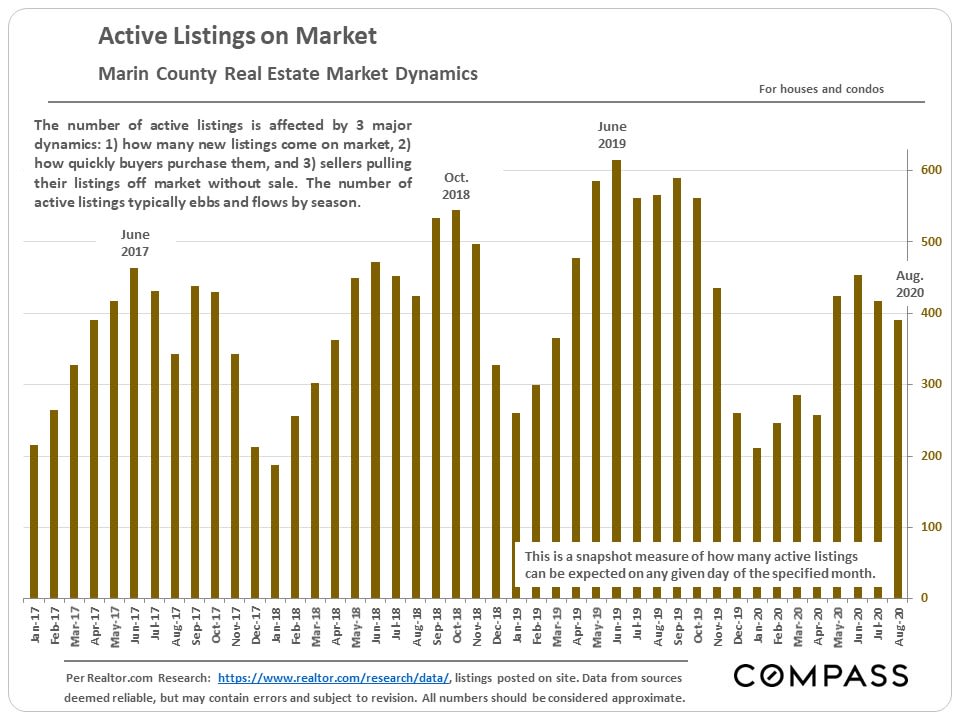
Chart of Marin County active listings, showing recurring spring and summer peaks from 2017 to 2020.

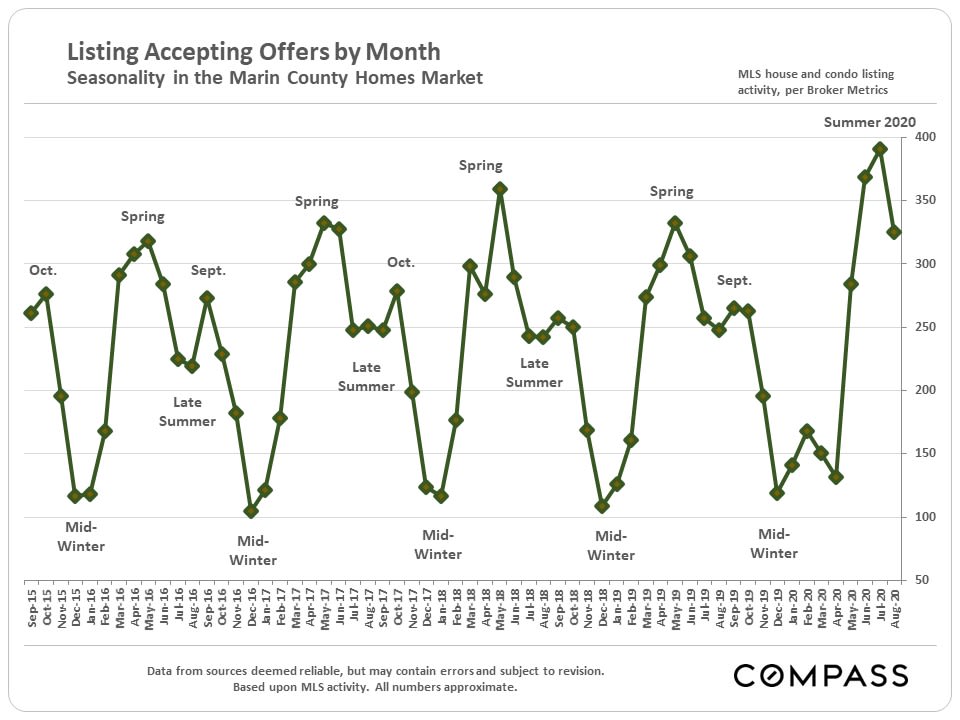
Chart of Marin County listings accepting offers by month, showing recurring spring peaks and mid-winter lows from 2015 to 2020.

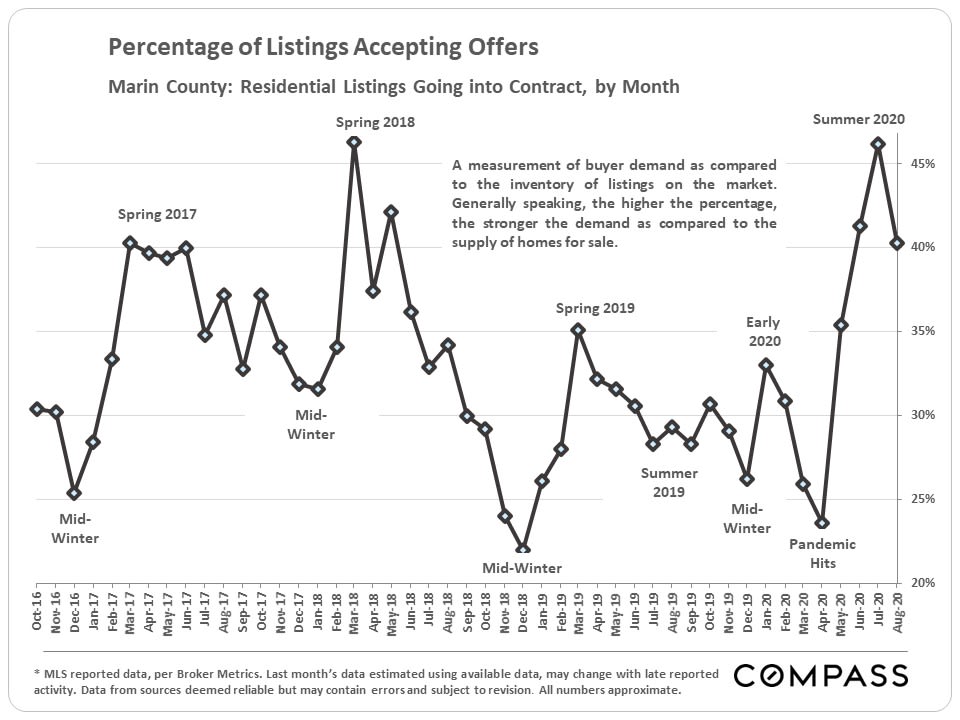
Chart of Marin County listings accepting offers by month, October 2016 to August 2020, with seasonal peaks and lows.

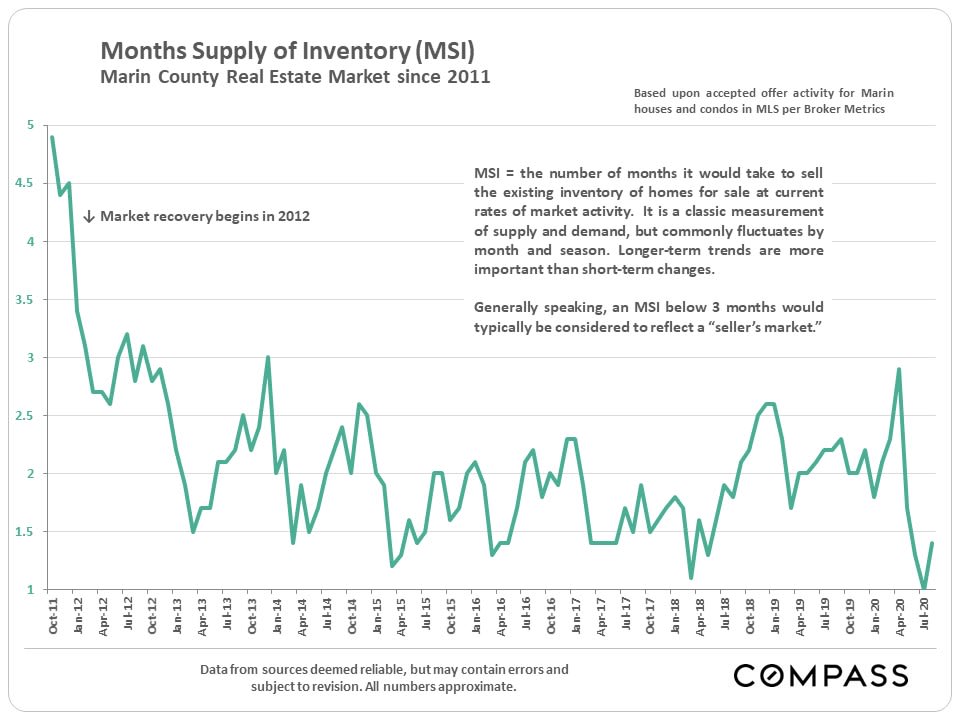
Chart tracking Marin County months of inventory from 2011 to 2020, with the line mostly below three months after 2012.

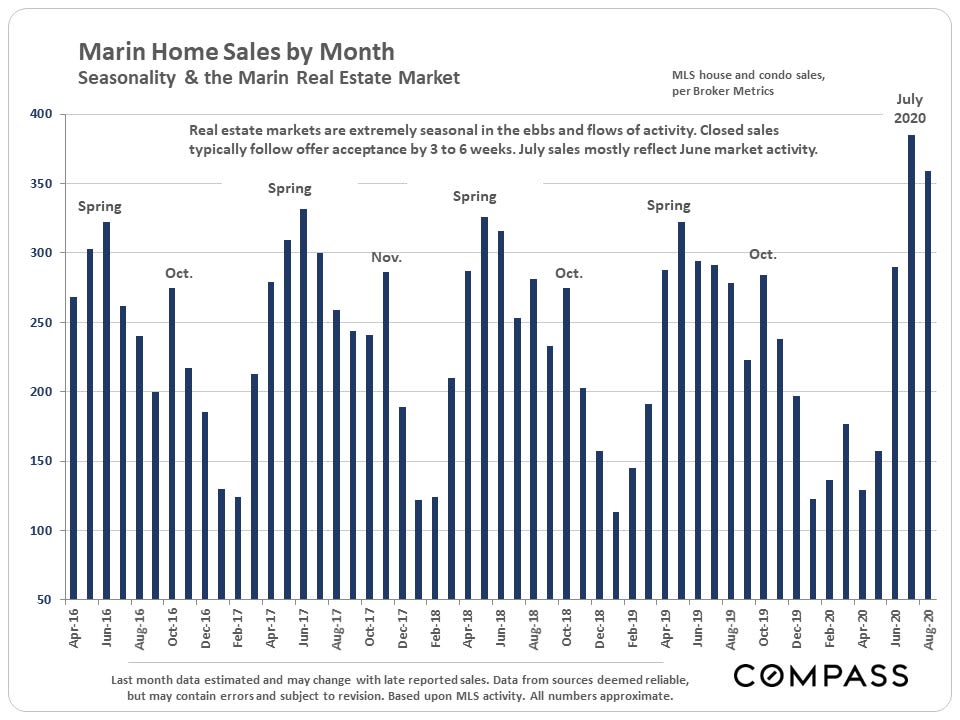
Bar chart of Marin home sales by month, April 2016 to August 2020, with seasonal peaks and a July 2020 high.

Chart of monthly active-listing price reductions in Marin County from January 2017 to August 2020.

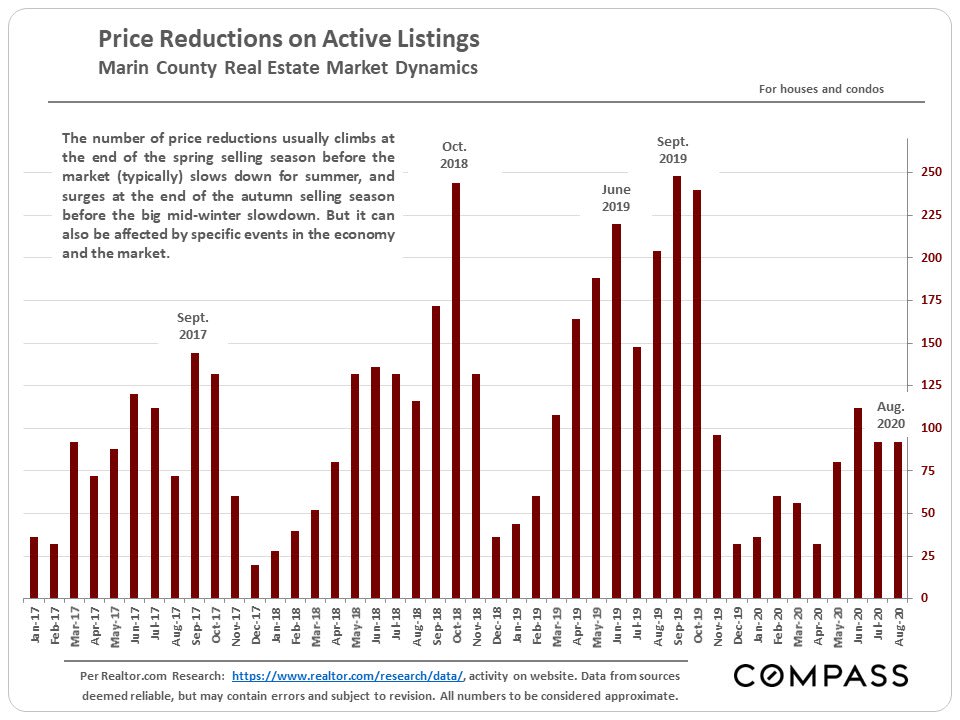
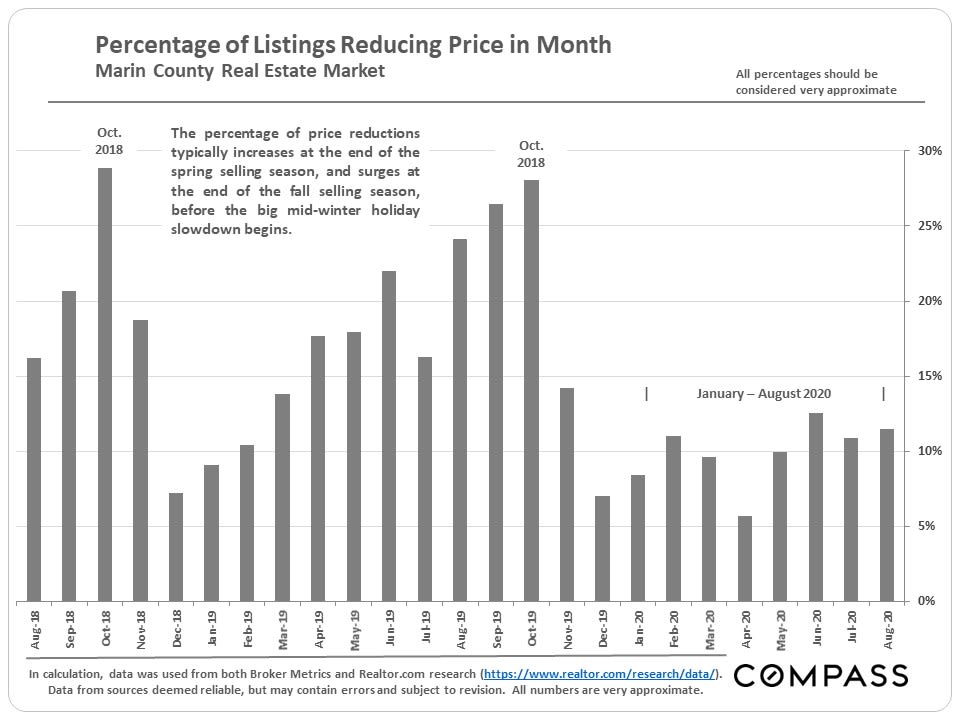
Bar chart of monthly Marin County listings with price reductions, August 2018–August 2020, showing seasonal peaks in fall.

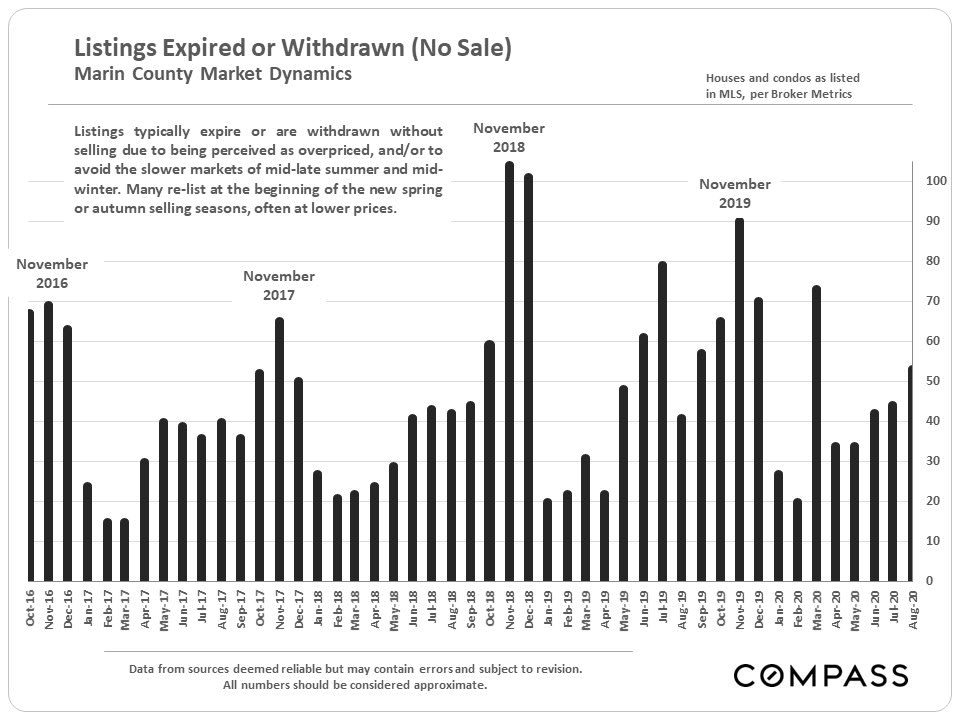
Bar chart of Marin County expired or withdrawn listings by month, October 2016 to August 2020.

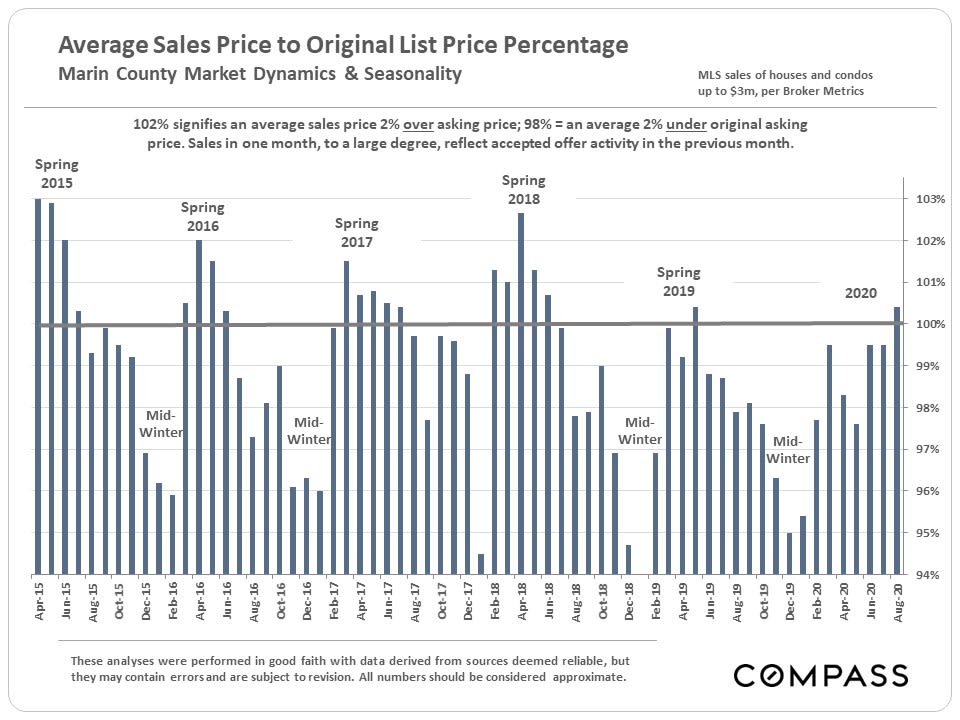
Marin County chart of sales prices relative to original list prices, with spring peaks and mid-winter declines from 2015 to 2020.

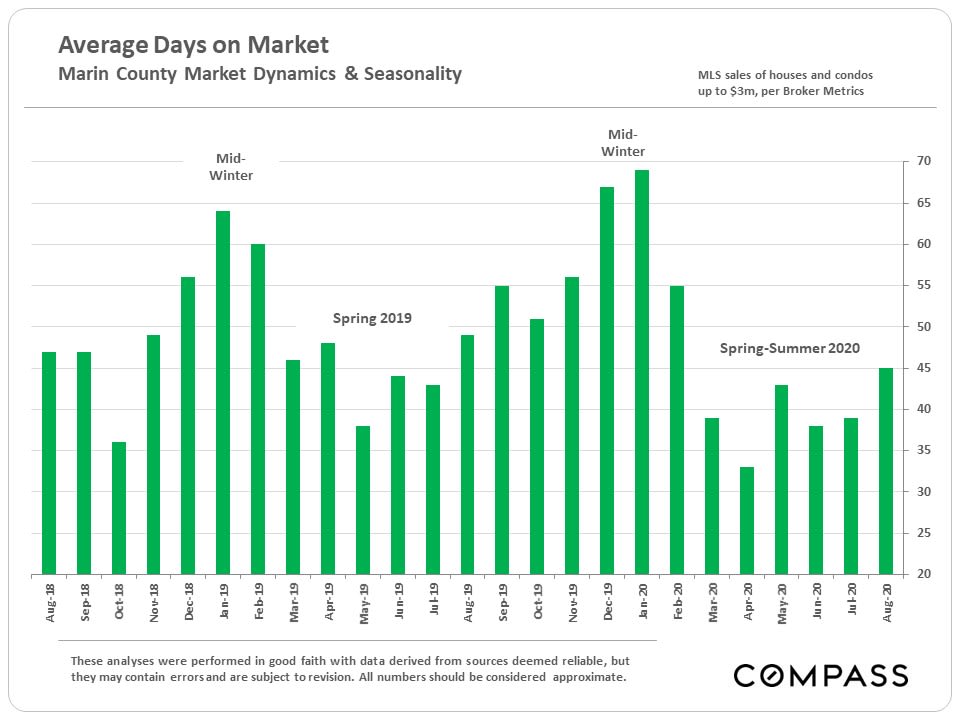
Bar chart of Marin County average days on market, with winter peaks and a spring 2020 low.

Marin County luxury home market seasonality charts.

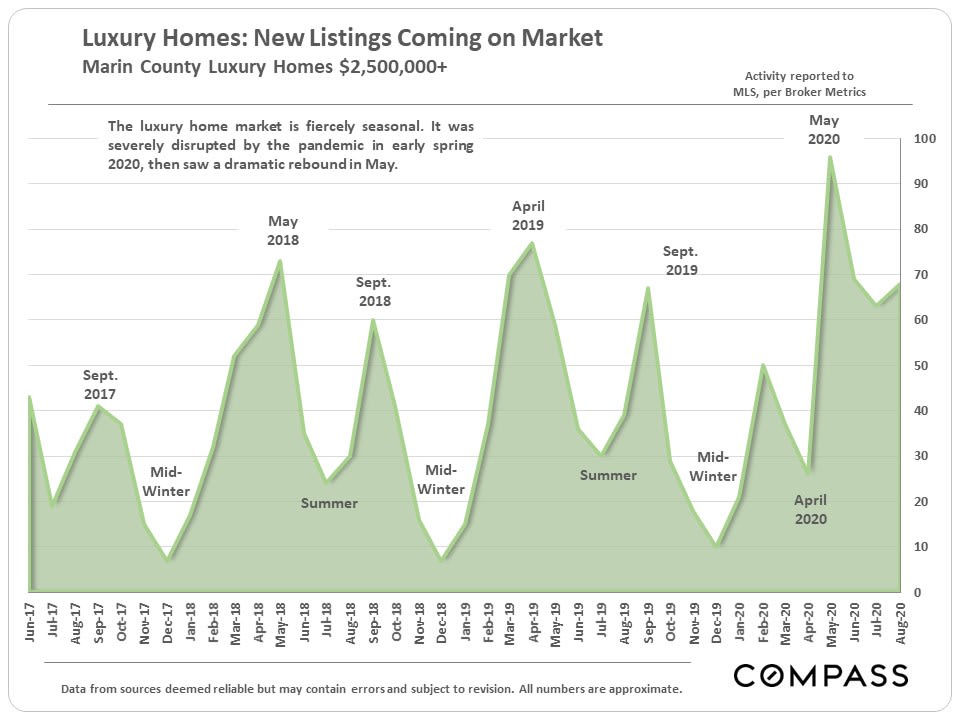
Chart of Marin County luxury home listings showing seasonal peaks and a sharp rebound in May 2020.

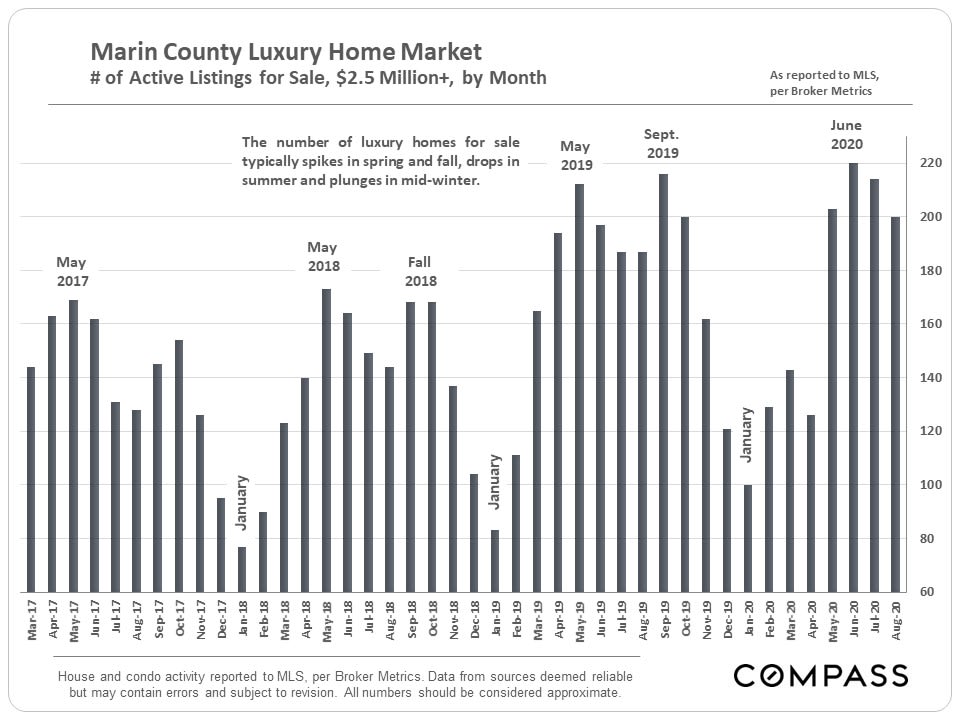
Chart of monthly Marin County luxury listings over $2.5 million, March 2017–August 2020.

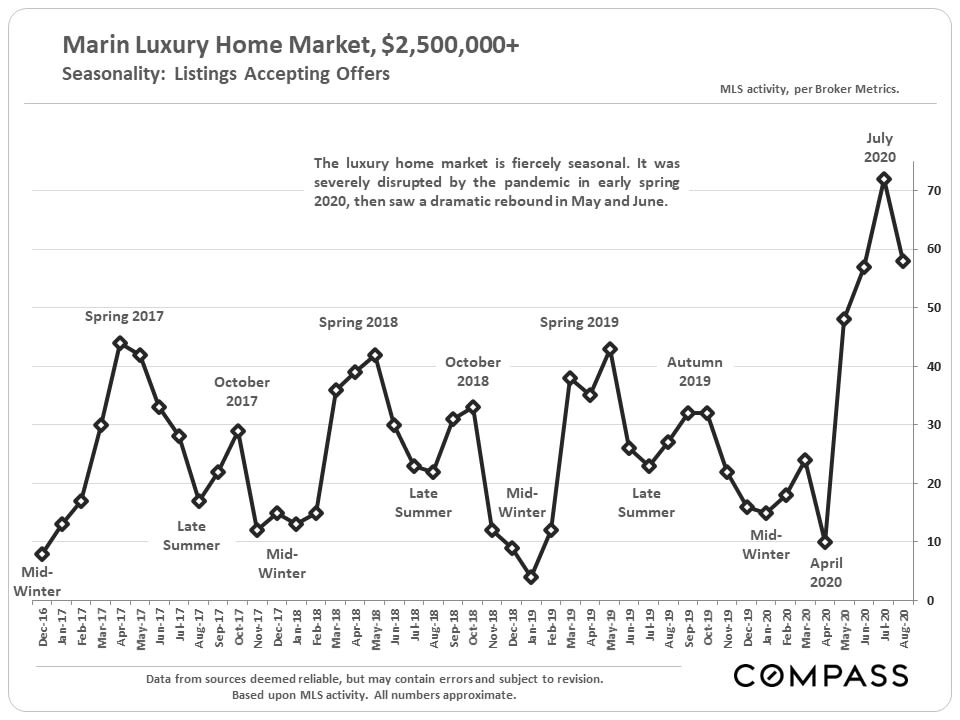
Chart of Marin luxury home listings accepting offers, with a sharp rebound in May and June 2020.

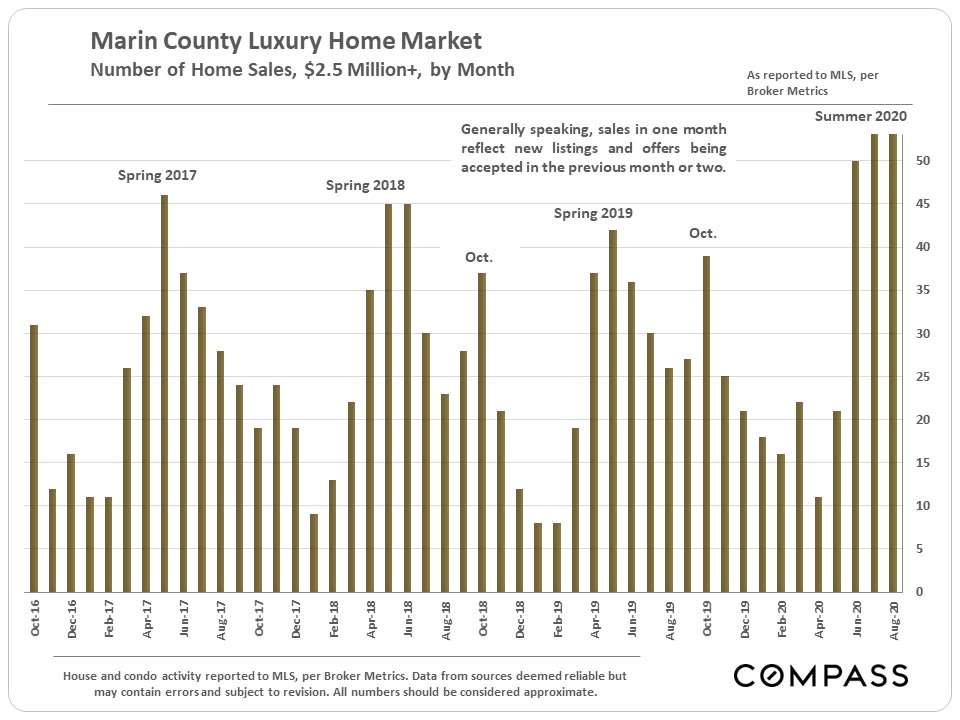
Bar chart of monthly Marin County sales for homes priced at $2.5 million or more, October 2016–August 2020.

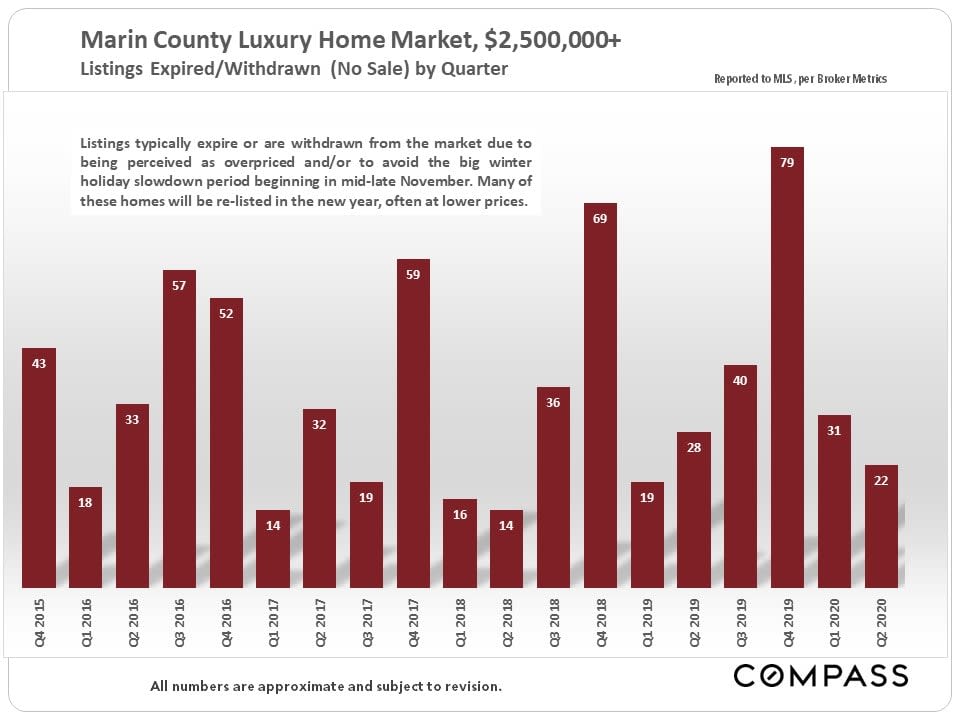
Bar chart of quarterly expired or withdrawn Marin County luxury home listings, with the highest count in Q4 2019.

Compass real estate report disclaimer: licensing, information accuracy, liability, advice, and past-performance notice.


Have questions on the market? Looking to buy or sell?

Contact us. [email protected]
415.686.4980


Considering a Move?

Whether you're thinking about selling, beginning a home search, or simply have a question about the Marin market, let's talk.
Follow Us