Marin County: Quarterly Real Estate Market Dynamics - Q2

Marin County: Quarterly Real Estate Market Dynamics - Q2
  • Faber Real Estate Team
  • July 21, 2020

Marin County: Quarterly Real Estate

Market Dynamics

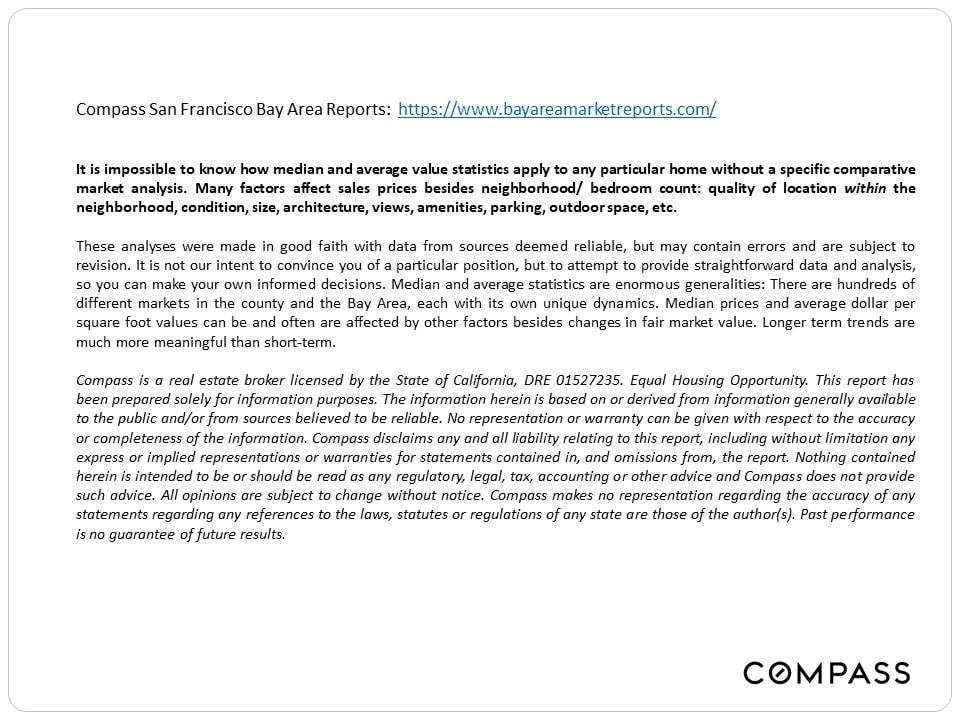
Marin County quarterly real estate market report cover with a panoramic coastal view and Compass branding.
 
New Listings Coming on Market - Seasonality & the Marin County Homes Market 
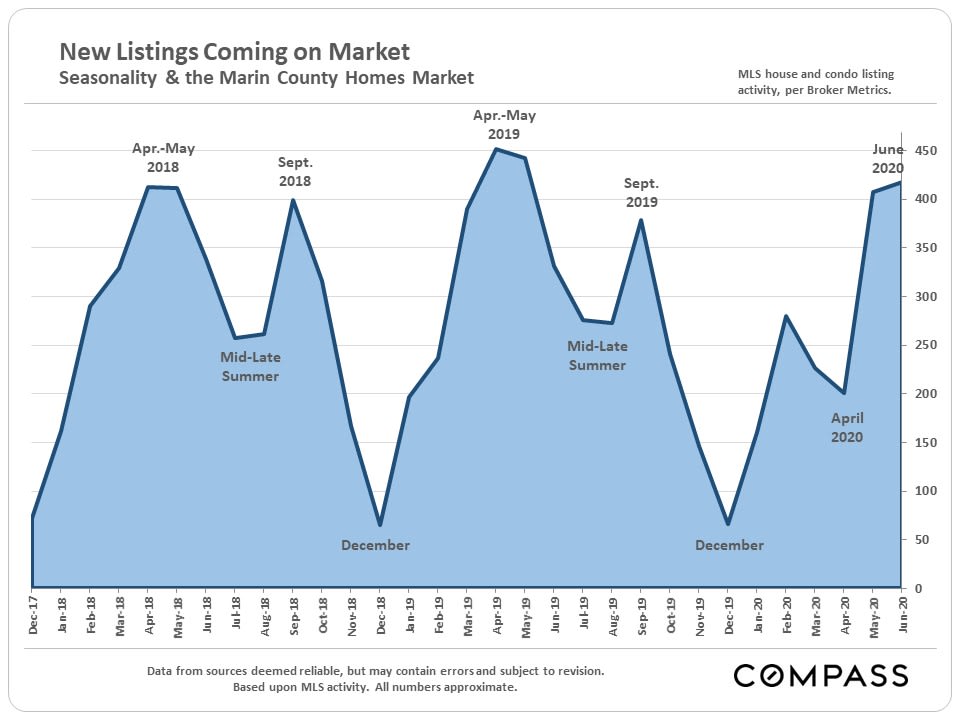
 
Chart of seasonal Marin County home listings, with spring peaks and December lows from 2017 to 2020.
 
Marin County House Price Appreciation - Median House Sales Prices, 2015-Present, by Quarter
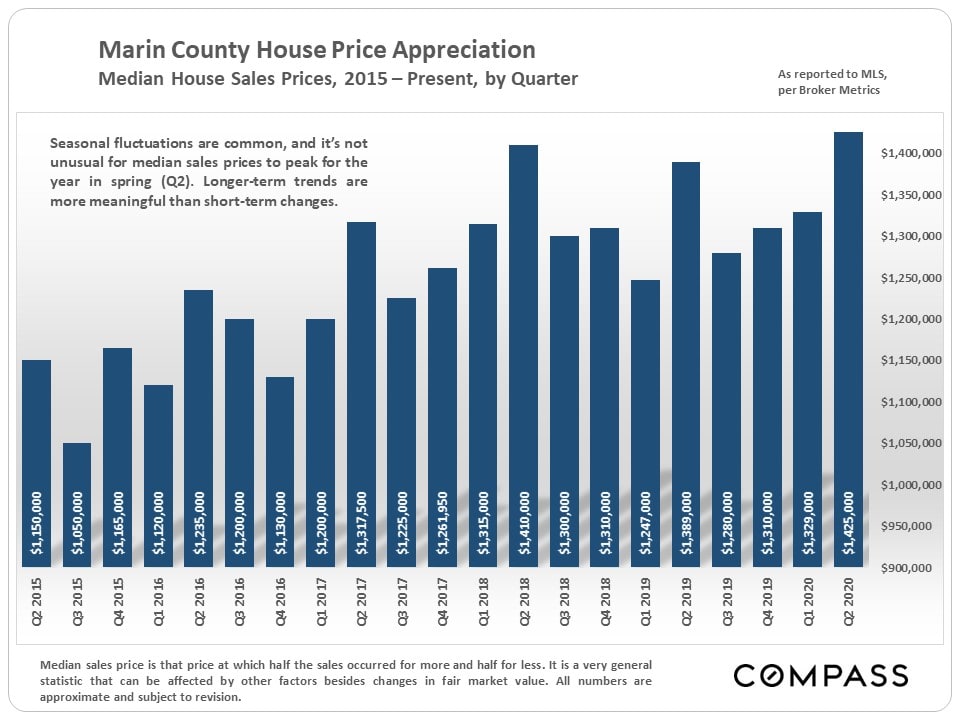
 
Chart of Marin County median house prices by quarter, rising overall from $1.15 million in 2015 to $1.425 million in 2020.
 
Marin County House Values - Average Dollar Per Square Foot Values, by Quarter
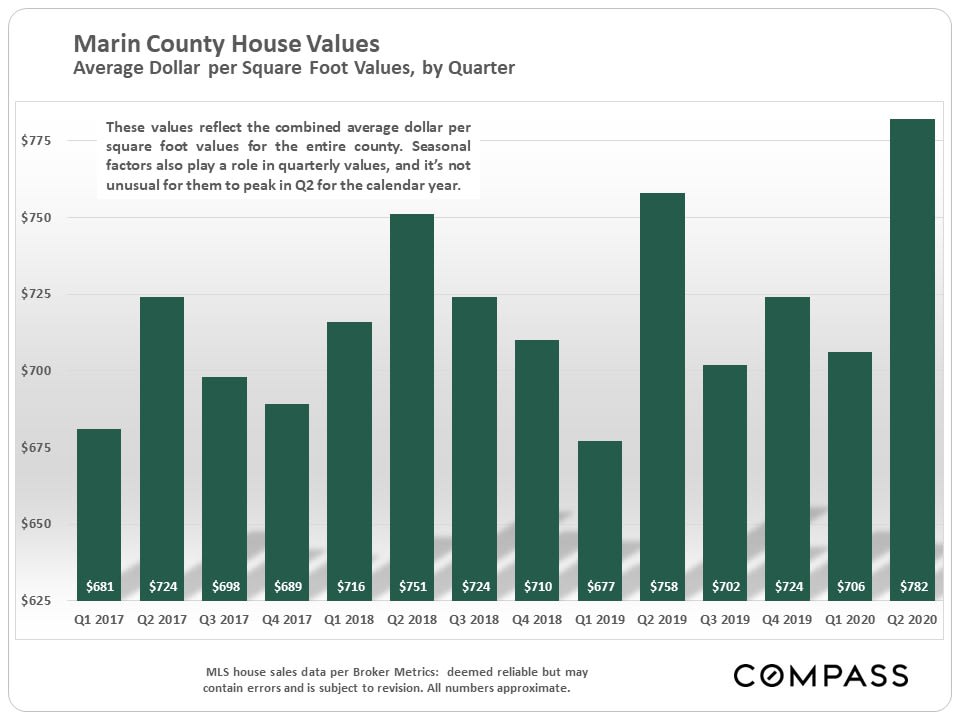
 
Chart of Marin County home values per square foot, rising to $782 in Q2 2020.
 
Marin County Condo Prices by Quarter - Median Condo Sales Prices, 2017 - Present
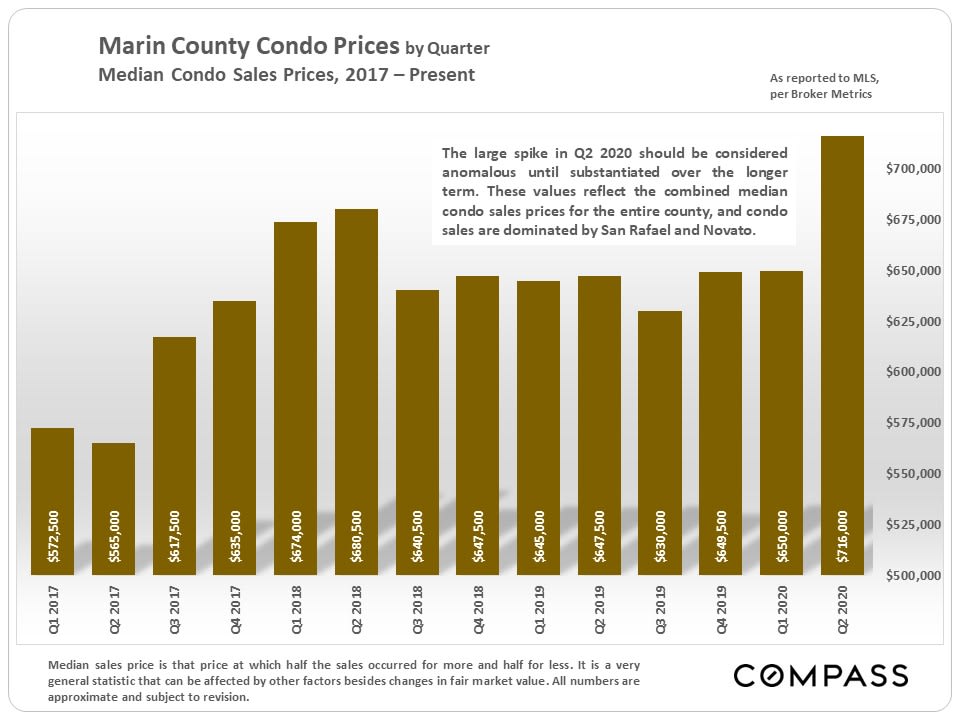
 
Bar chart of Marin County condo prices by quarter, showing a Q2 2020 spike to $716,000.
 
Average Days on Market by Quarter - Marin County Market Dynamics, 2016 to Present
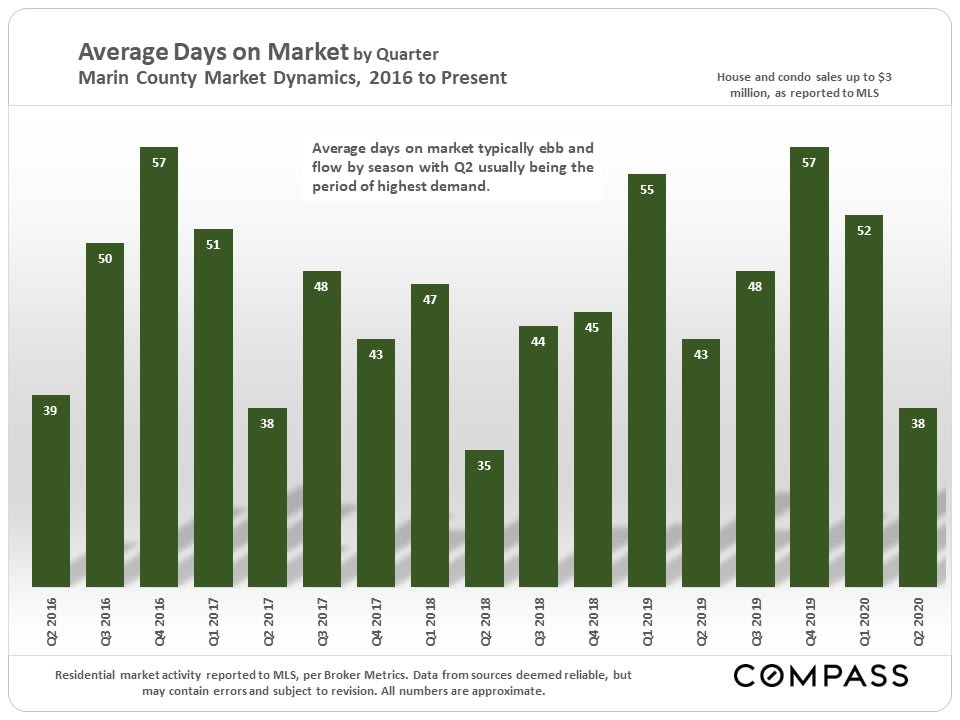
 
Bar chart of Marin County average days on market, Q2 2016–Q2 2020, ranging from 35 to 57 days.
 
Percentage of Home Sales Selling Within 30 Days - Marin County Quarterly Market Trends since 2016
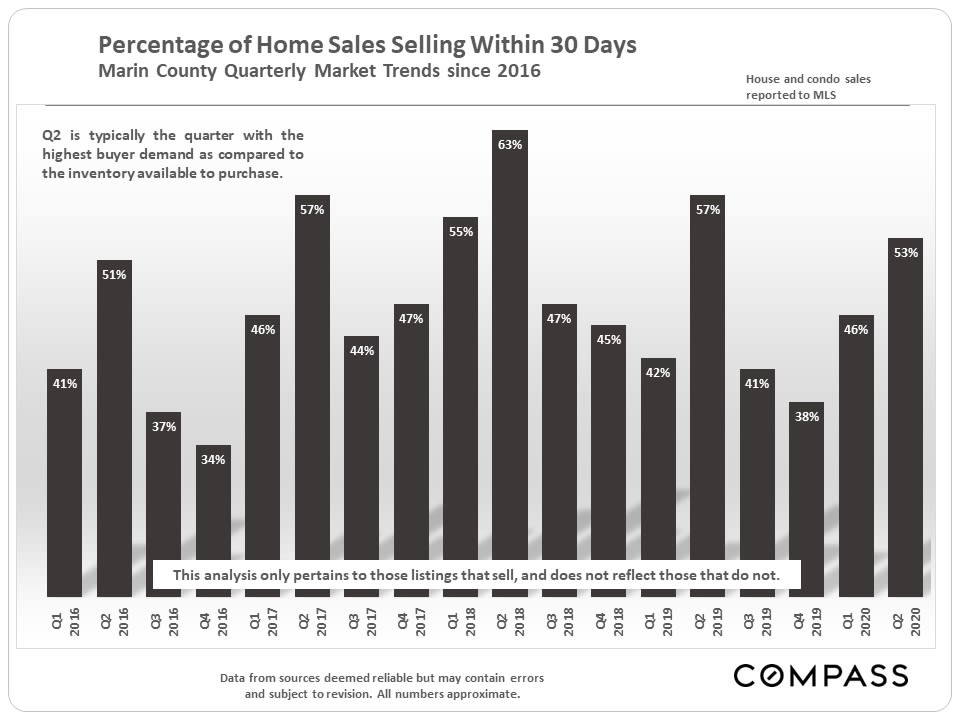
 
Bar chart of Marin County home sales selling within 30 days, with quarterly percentages from 2016 to 2020.
 
Sales Price to Original List Price % by Quarter - Marin County Market Dynamics, 2016 to Present
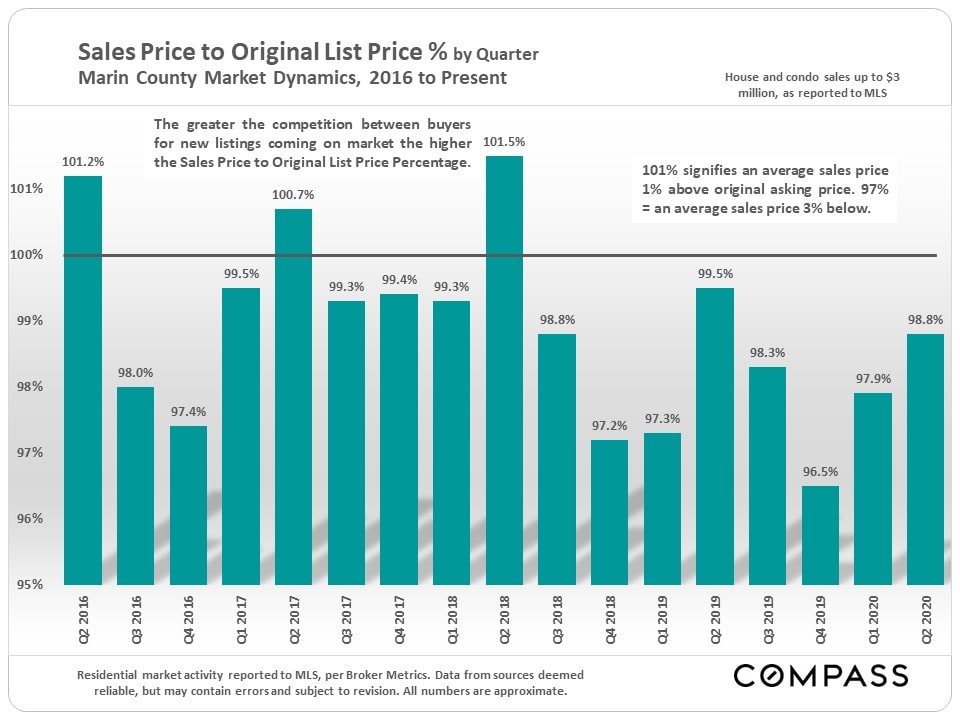
 
Marin County quarterly sale-to-list price chart, with values from Q2 2016 to Q2 2020 and a 100% reference line.
 
Percentage of Listings Accepting Offers by Quarter - Marin County Market Dynamics, 2016 to Present
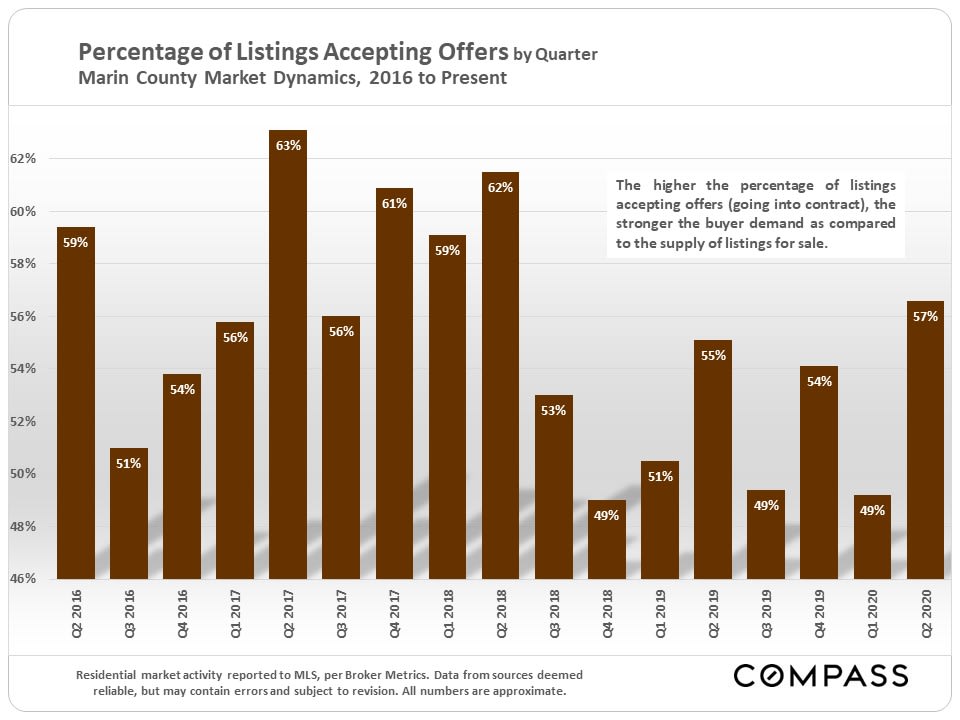
 
Bar chart of Marin County listings accepting offers by quarter, Q2 2016–Q2 2020.
 
Percentage of Listings Accepting Offers by Month - Marin County: % of Listings Going Under Contract
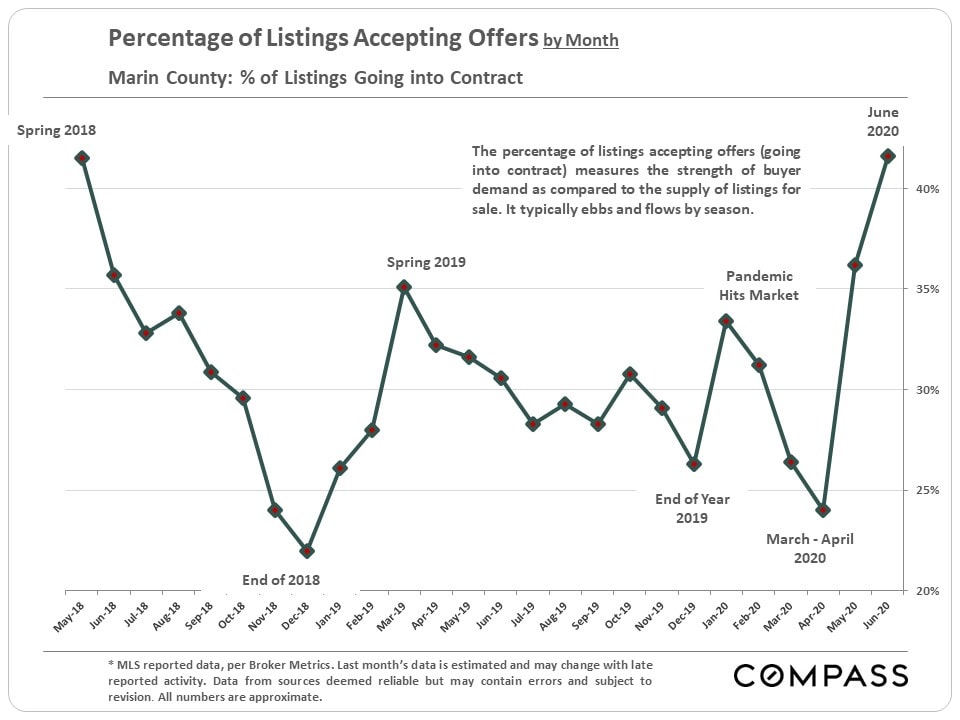
 
Marin County listings going into contract by month, May 2018–June 2020, with a sharp rise in June 2020.
 
Active Listings on Market in Quarter - Marin County Market Dynamics & Seasonality
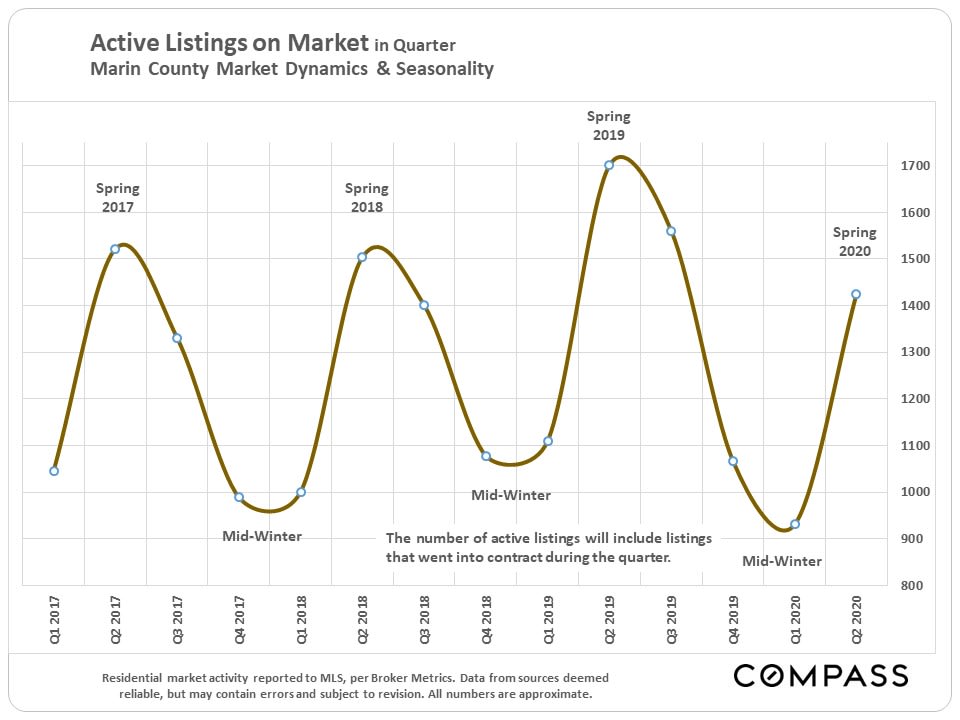
 
Chart of Marin County active listings by quarter, showing spring peaks and mid-winter lows from 2017 to 2020.
 
Active Listings For Sale in Month - Marin County, 12 Month Year-over-Year Comparison
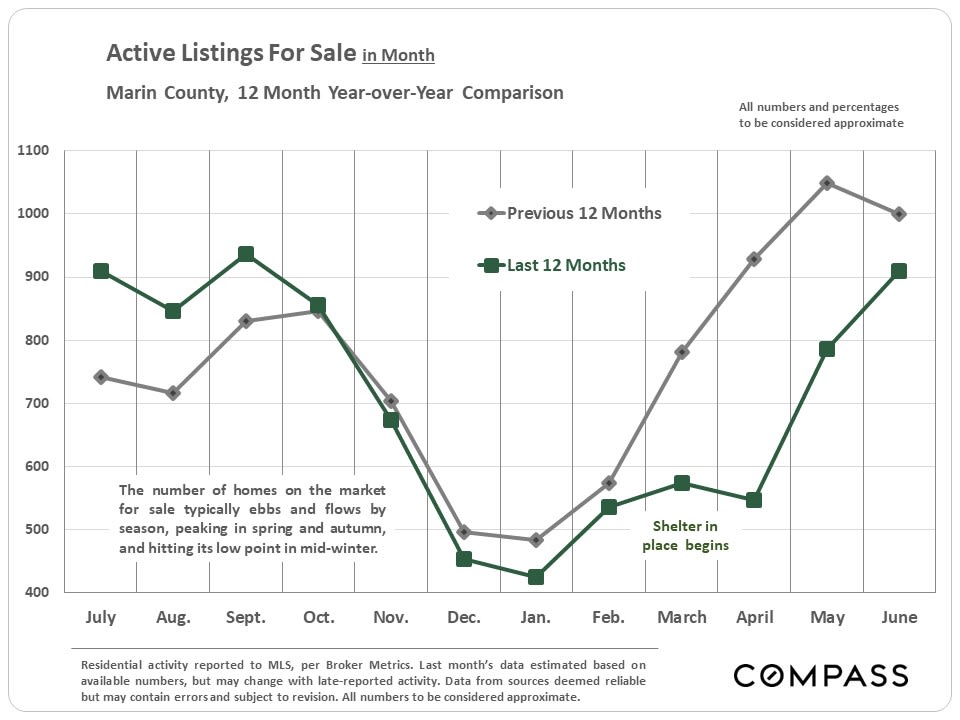
 
Marin County active listings chart comparing the previous and last 12 months, with monthly values from July through June.
 
Listings Accepting Offers (Going into Contract) by Month - Marin County, 12 Month Year-over-Year Comparsion
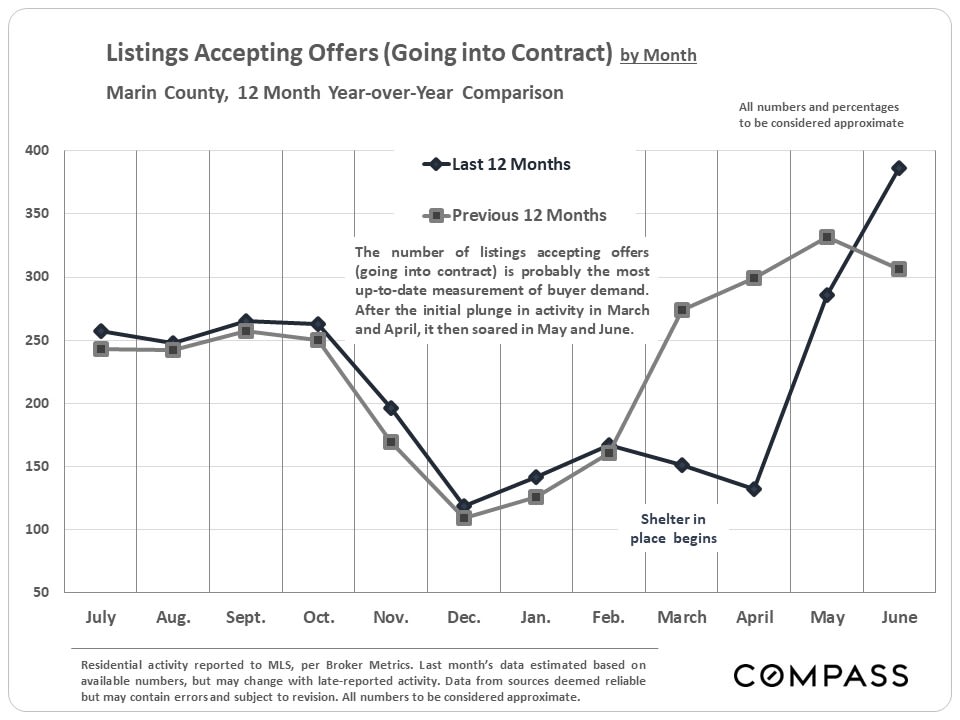
 
Marin County chart comparing monthly listings accepting offers across two 12-month periods.
 
Sales Volume by Quarter since 2017 - Marin County Market Dynamics & Seasonality
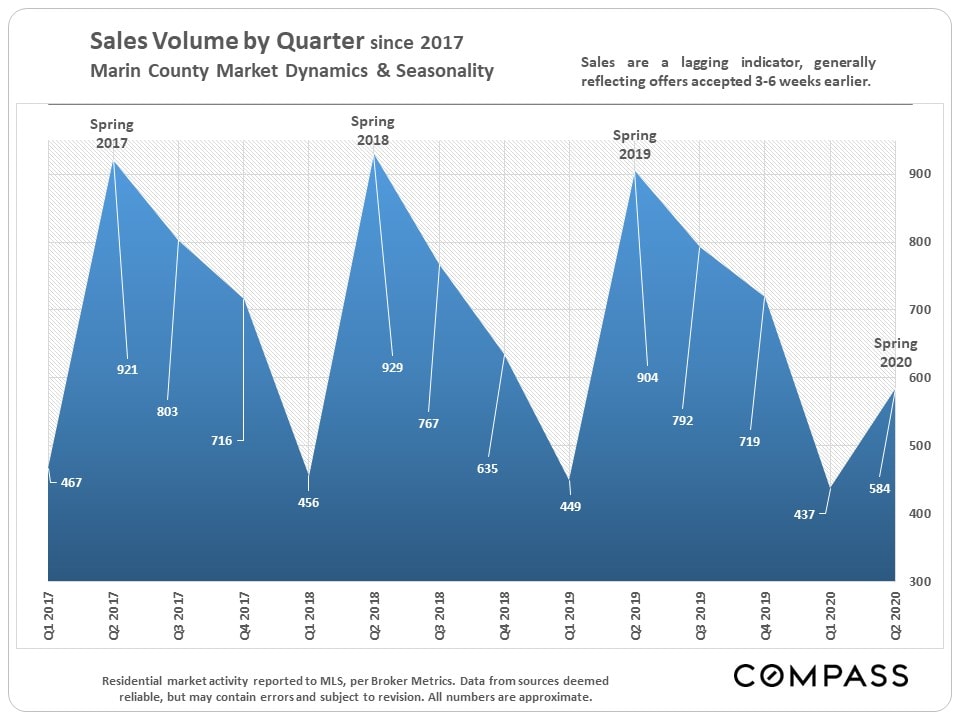
 
Marin County quarterly sales volume chart, with spring peaks near 900 sales from 2017 through 2019.
 
Marin County Luxury Home Sales - Sales Price of $2,500,000 & Above, by Quarter
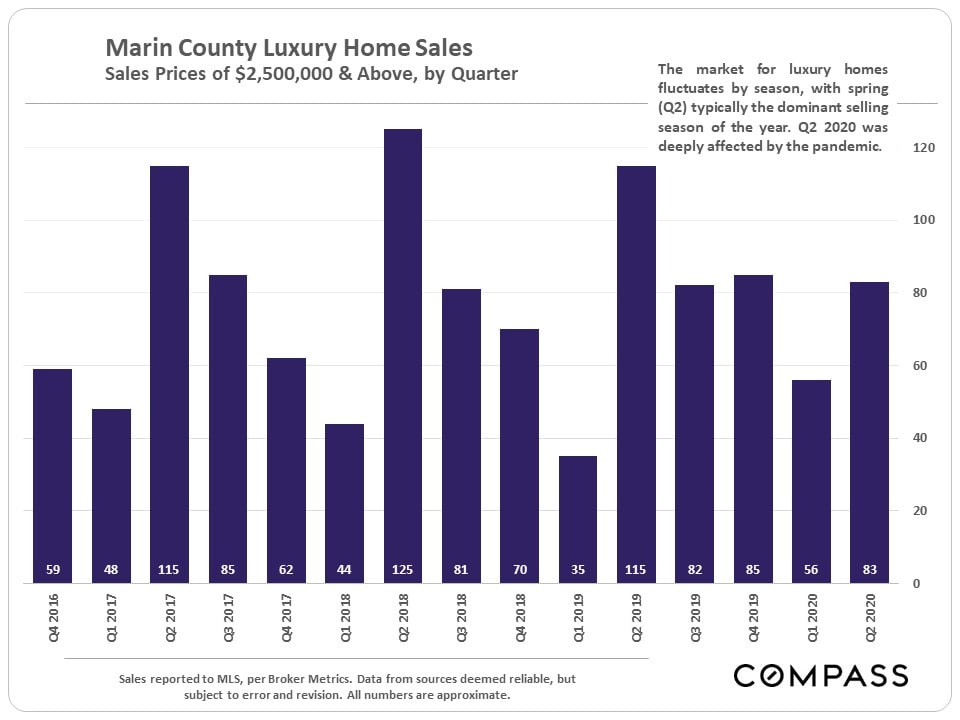
 
Chart of Marin County luxury home sales by quarter, showing counts from Q4 2016 through Q2 2020.
 
Higher-Price Home Listings Going into Contract by Month - Marin County Year-over-Year Market Dynamics
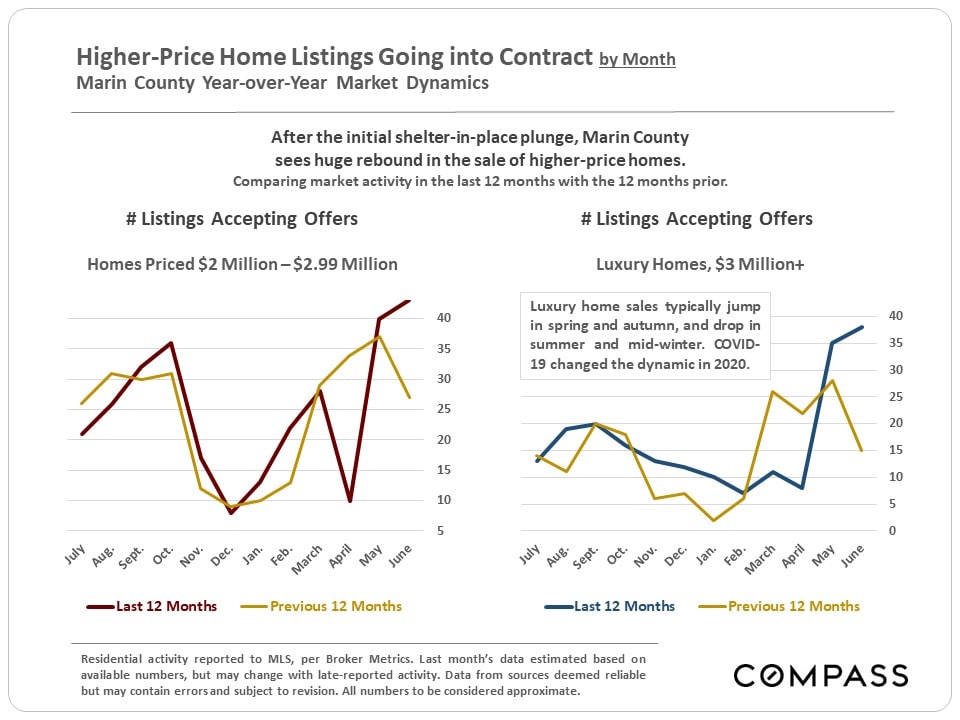
 
Marin County home sales chart comparing monthly offers for $2–2.99 million and $3 million-plus homes.
 
Listings Expired/Withdrawn in Quarter - Marin County Market Dynamics & Seasonality
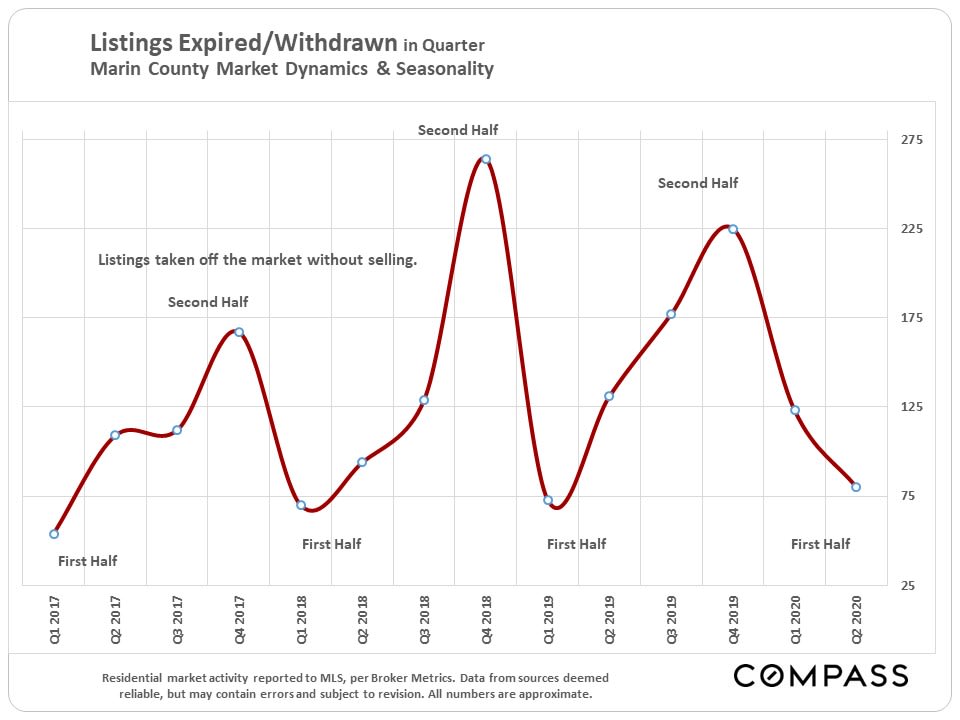
 
Chart of Marin County expired and withdrawn listings by quarter, Q1 2017–Q2 2020, with peaks in Q4 2018 and Q4 2019.
 
Compass market report disclaimer explaining statistical limitations and providing a link to Bay Area market reports.
 
Have questions or want more detailed local market stats? 
Contact us for all your real estate needs.

 
Smiling older woman with shoulder-length silver hair, pearl jewelry, and a black top.
 
Smiling man in a navy suit and light blue shirt against a white background.
 
Smiling woman in a cream faux-fur vest standing in a bright home interior.


Considering a Move?

Whether you're thinking about selling, beginning a home search, or simply have a question about the Marin market, let's talk.
Follow Us