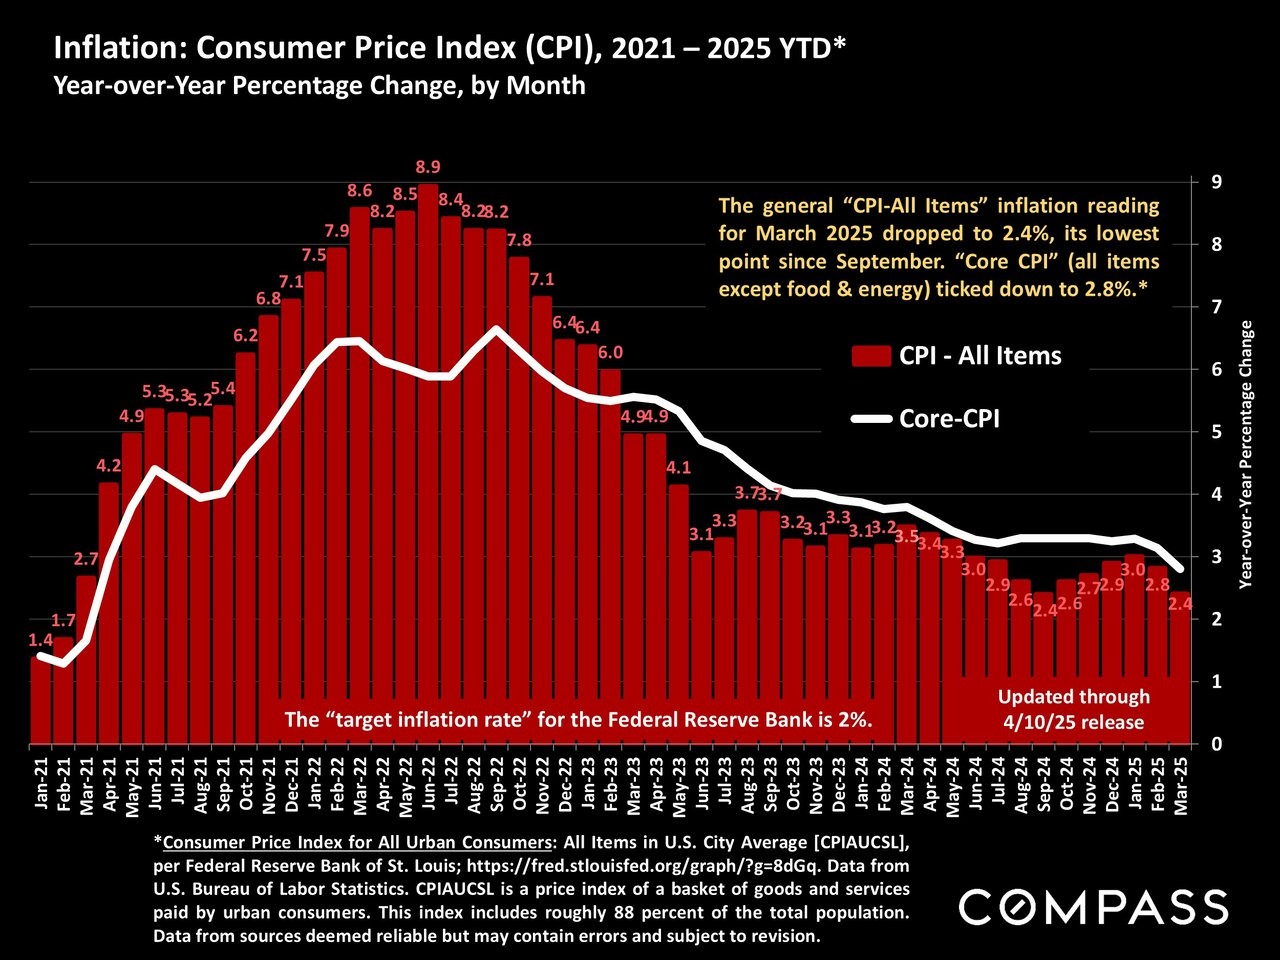
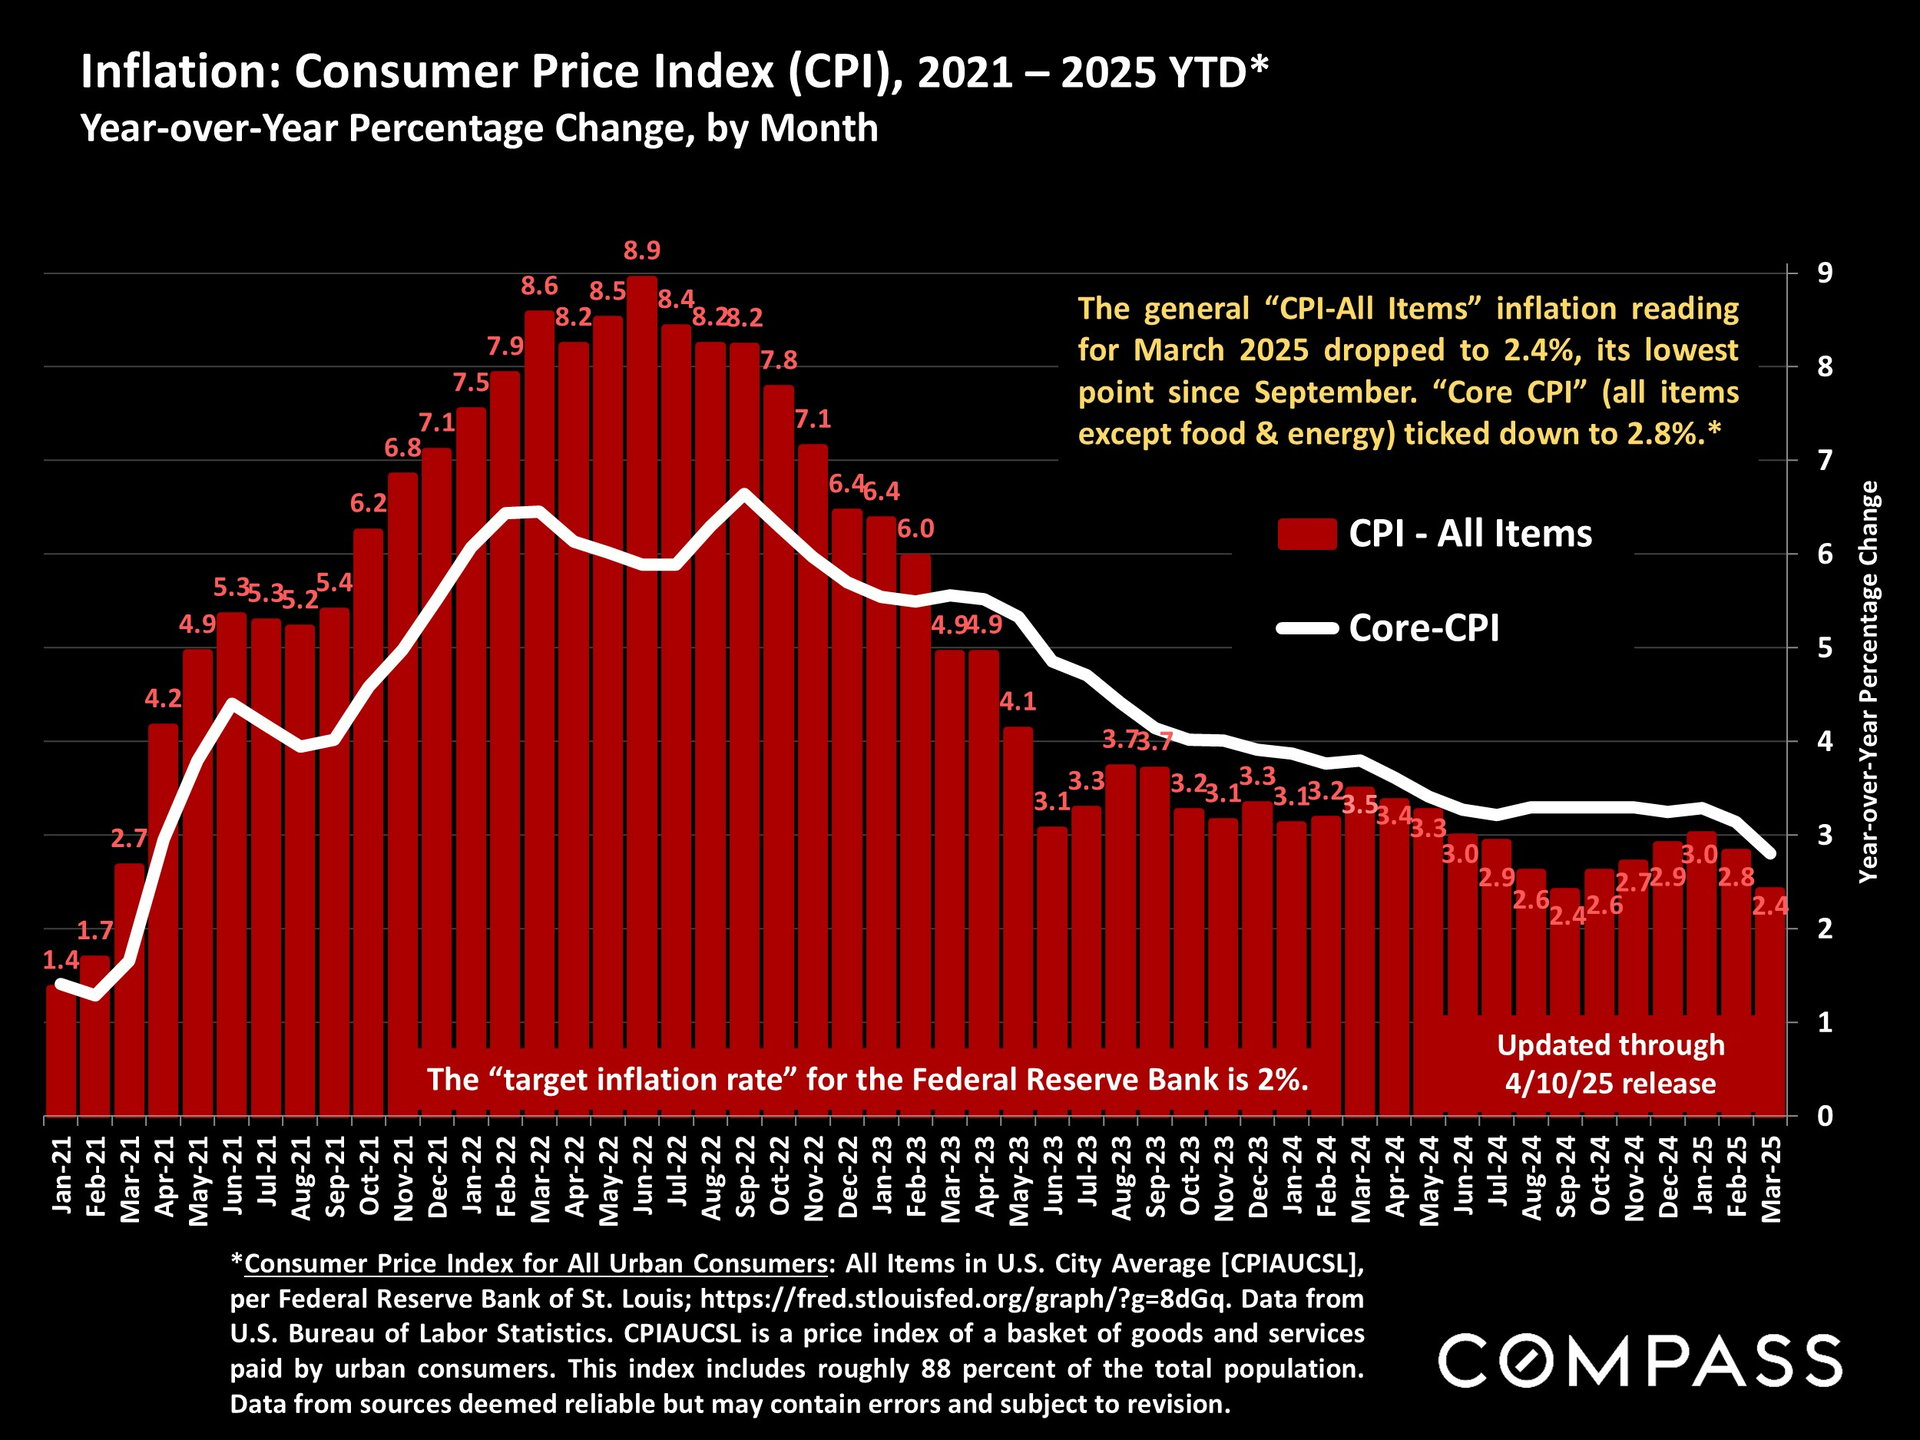
The inflation rate ticked down in March to its lowest reading since September: While drops in inflation triggered big reactions in financial markets in the past, investors and analysts have other things on their mind, and many, if not most, expect inflation to increase with tariffs, depending how those play out - which is anyone's guess right now.
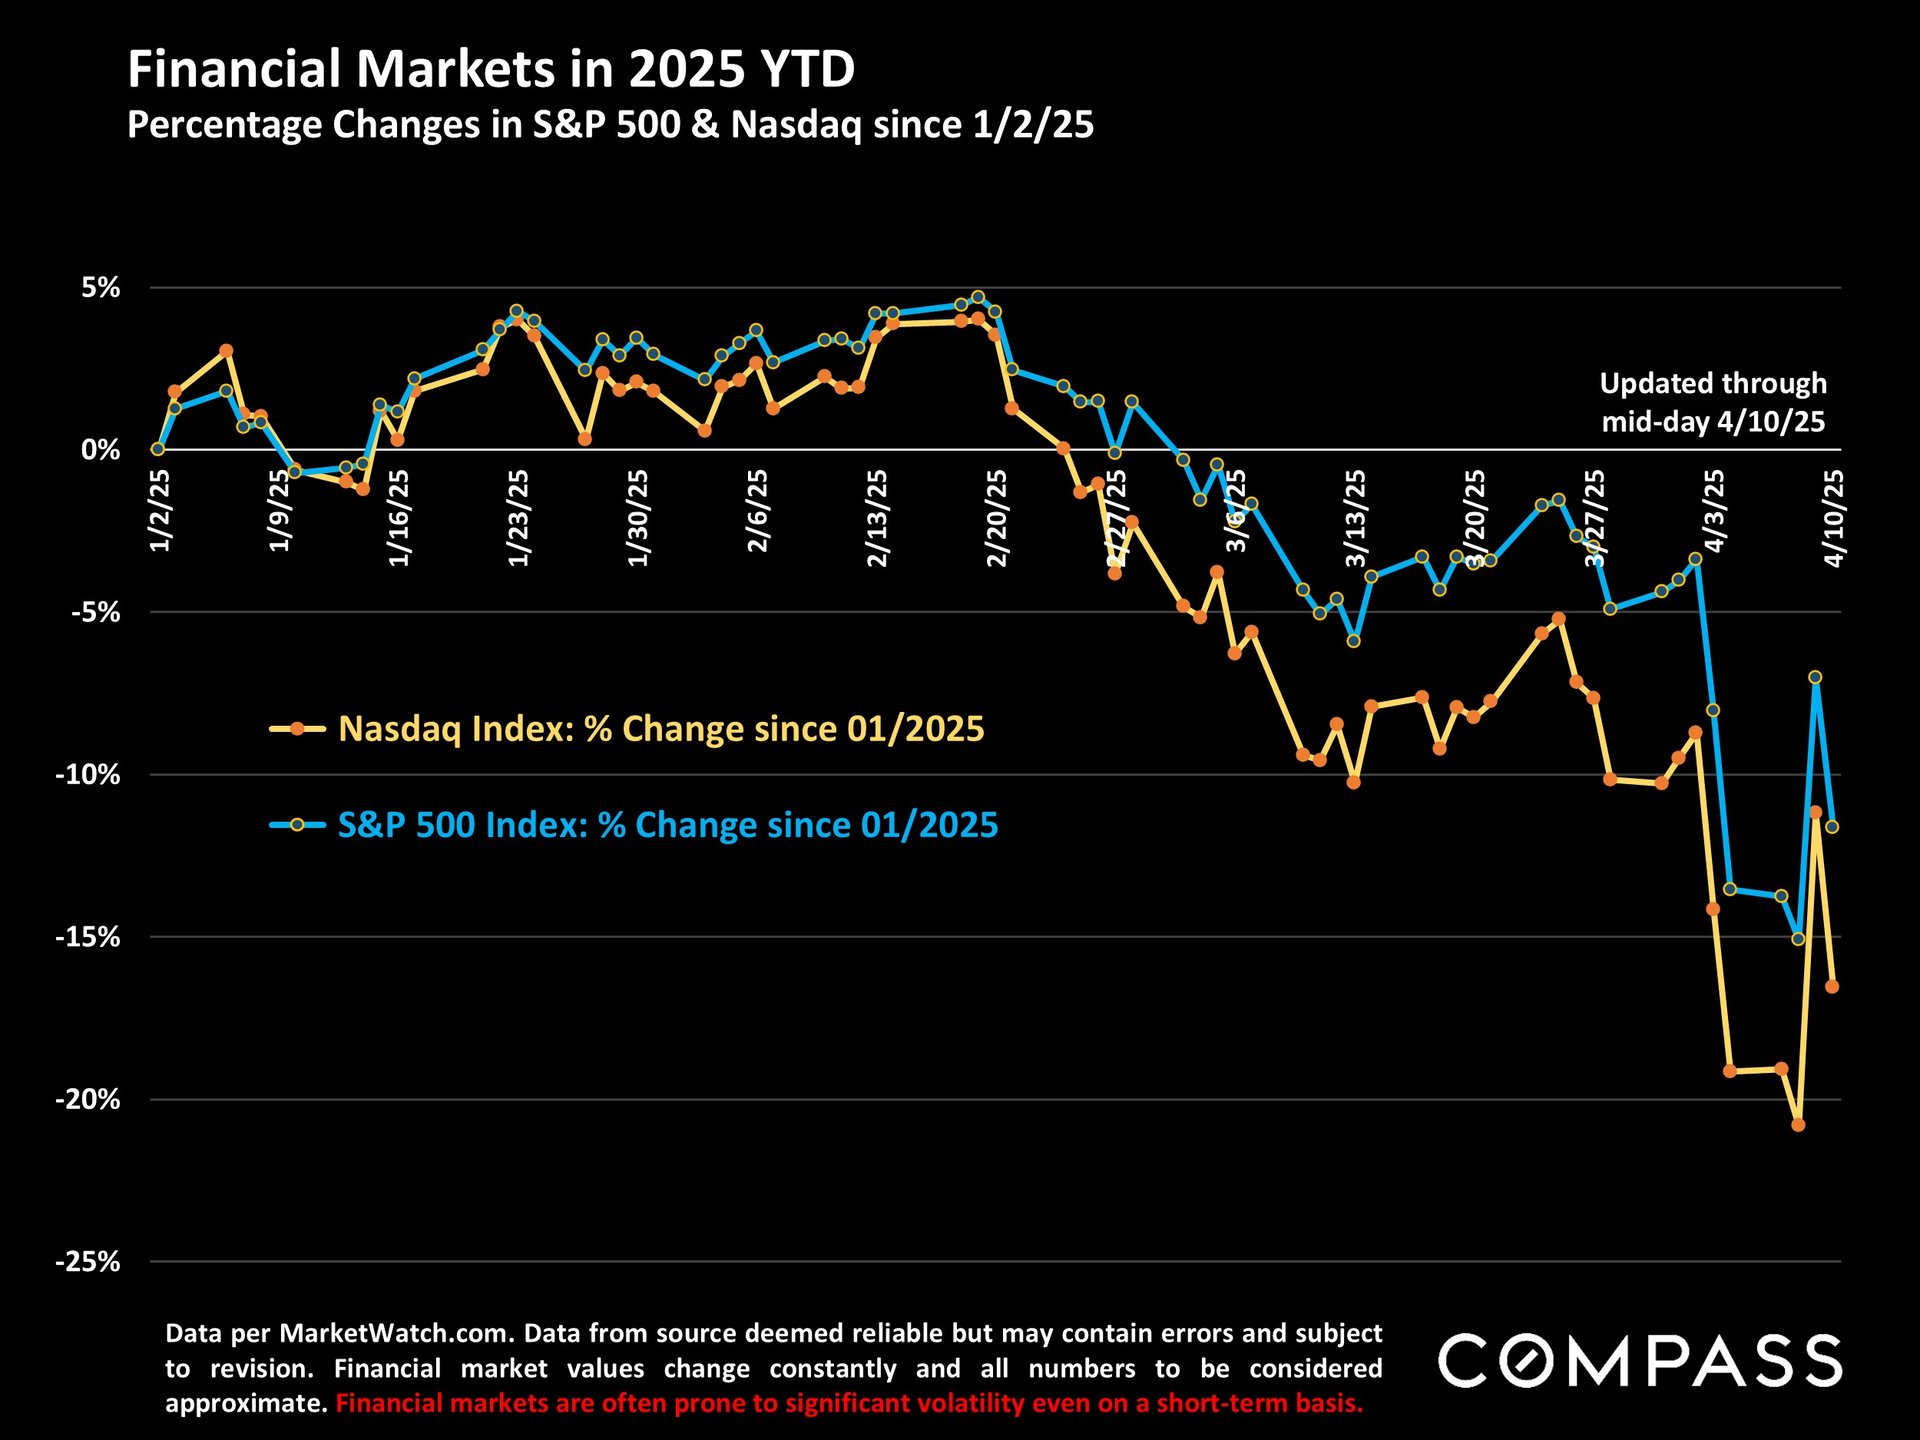
Stock market indices have been moving frantically up and down, with dramatic changes occurring very quickly: Investors feel they're standing on quicksand.
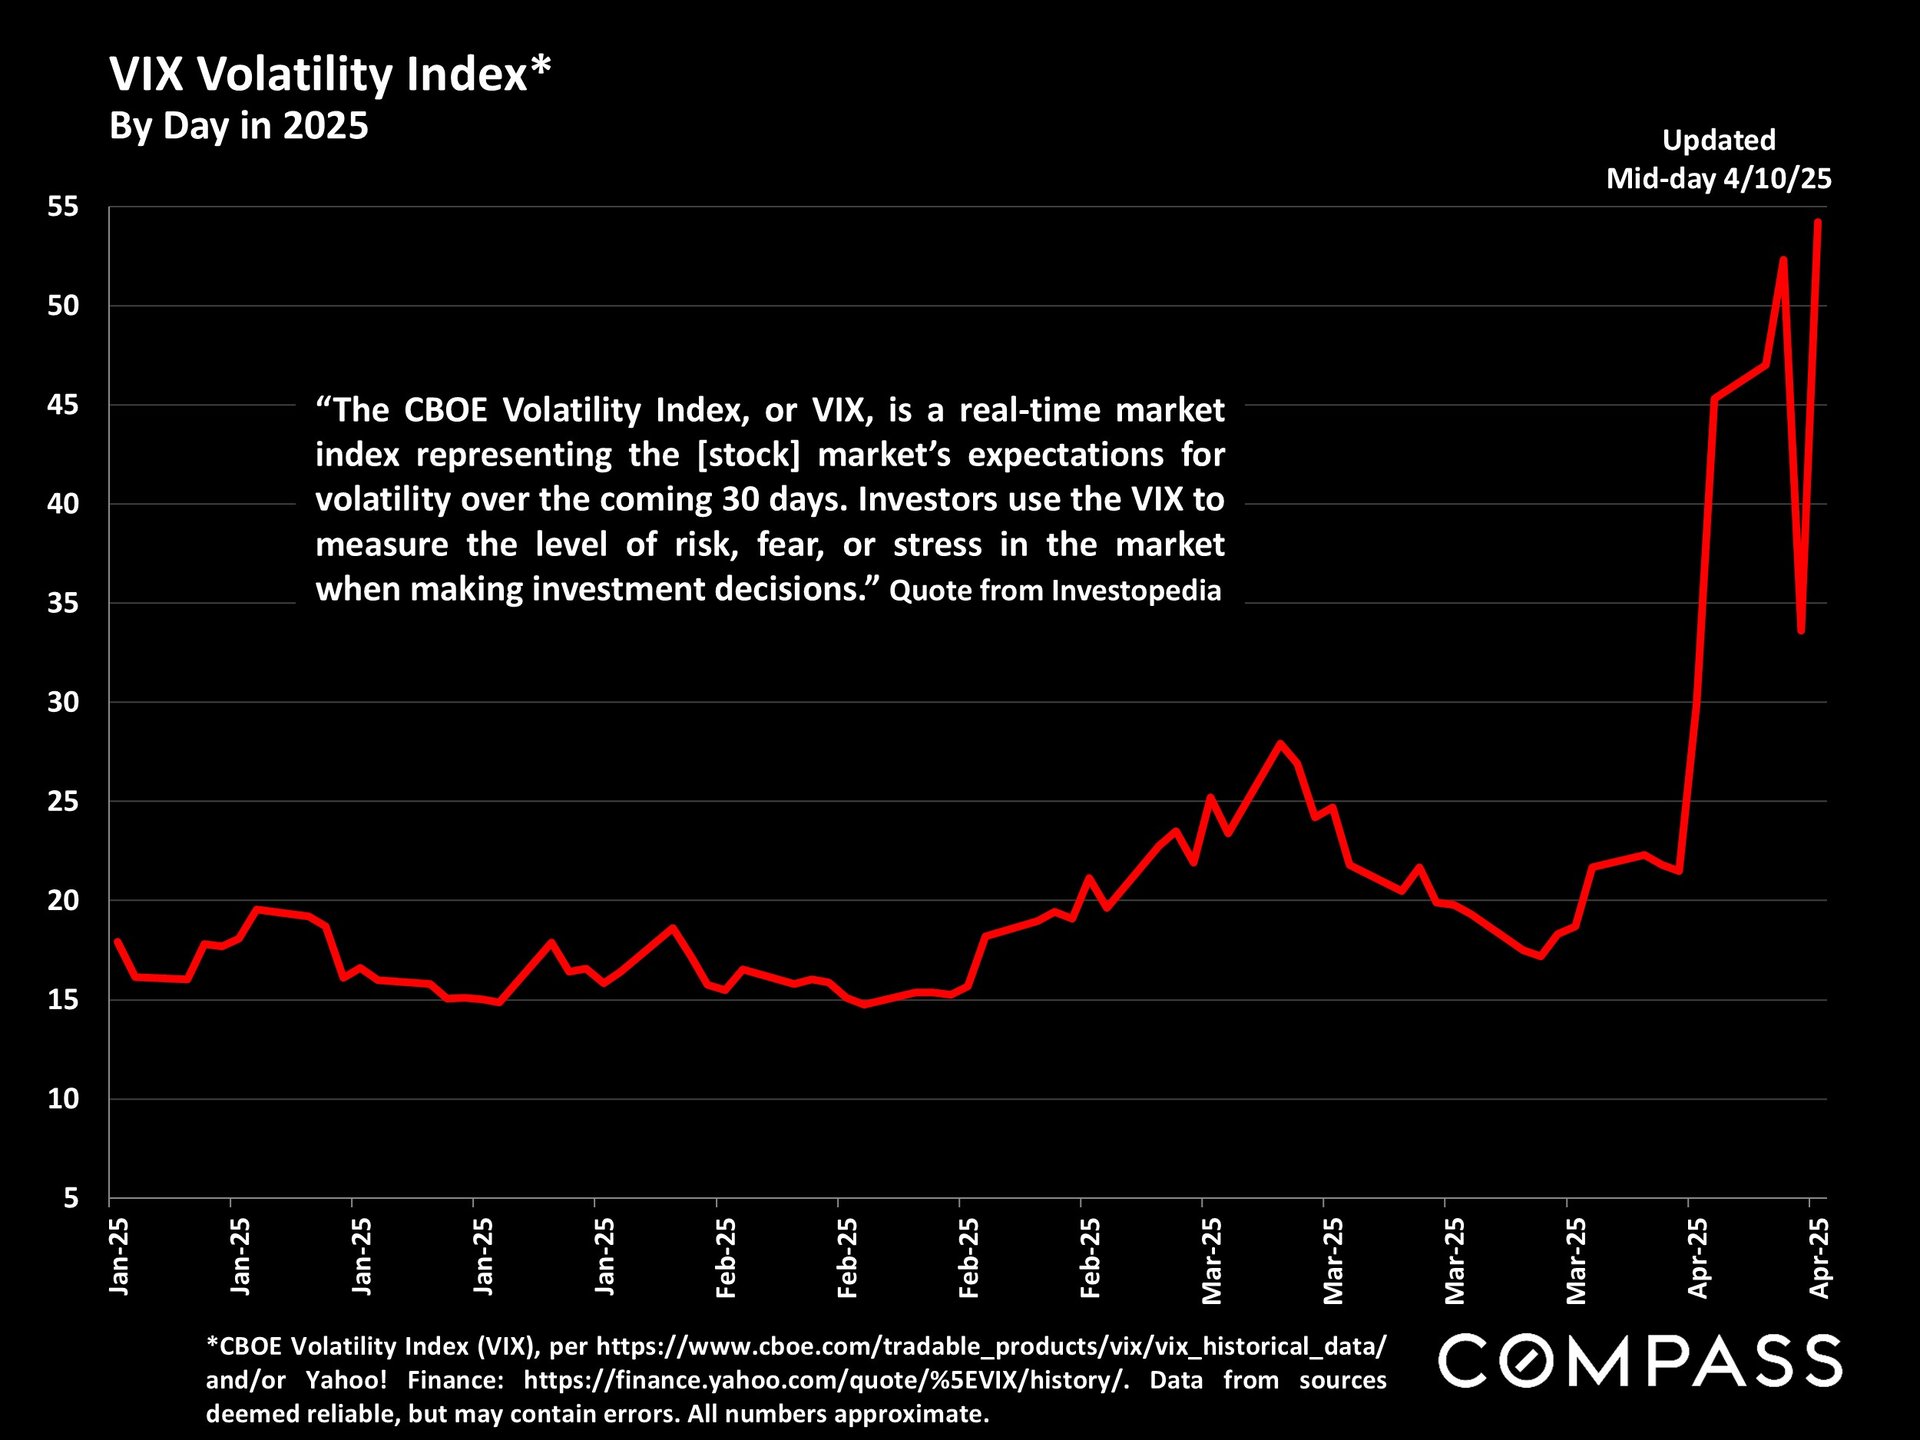
The latest VIX volatility index reading, also changing almost by the minute: Highest volatility readings since the pandemic hit.
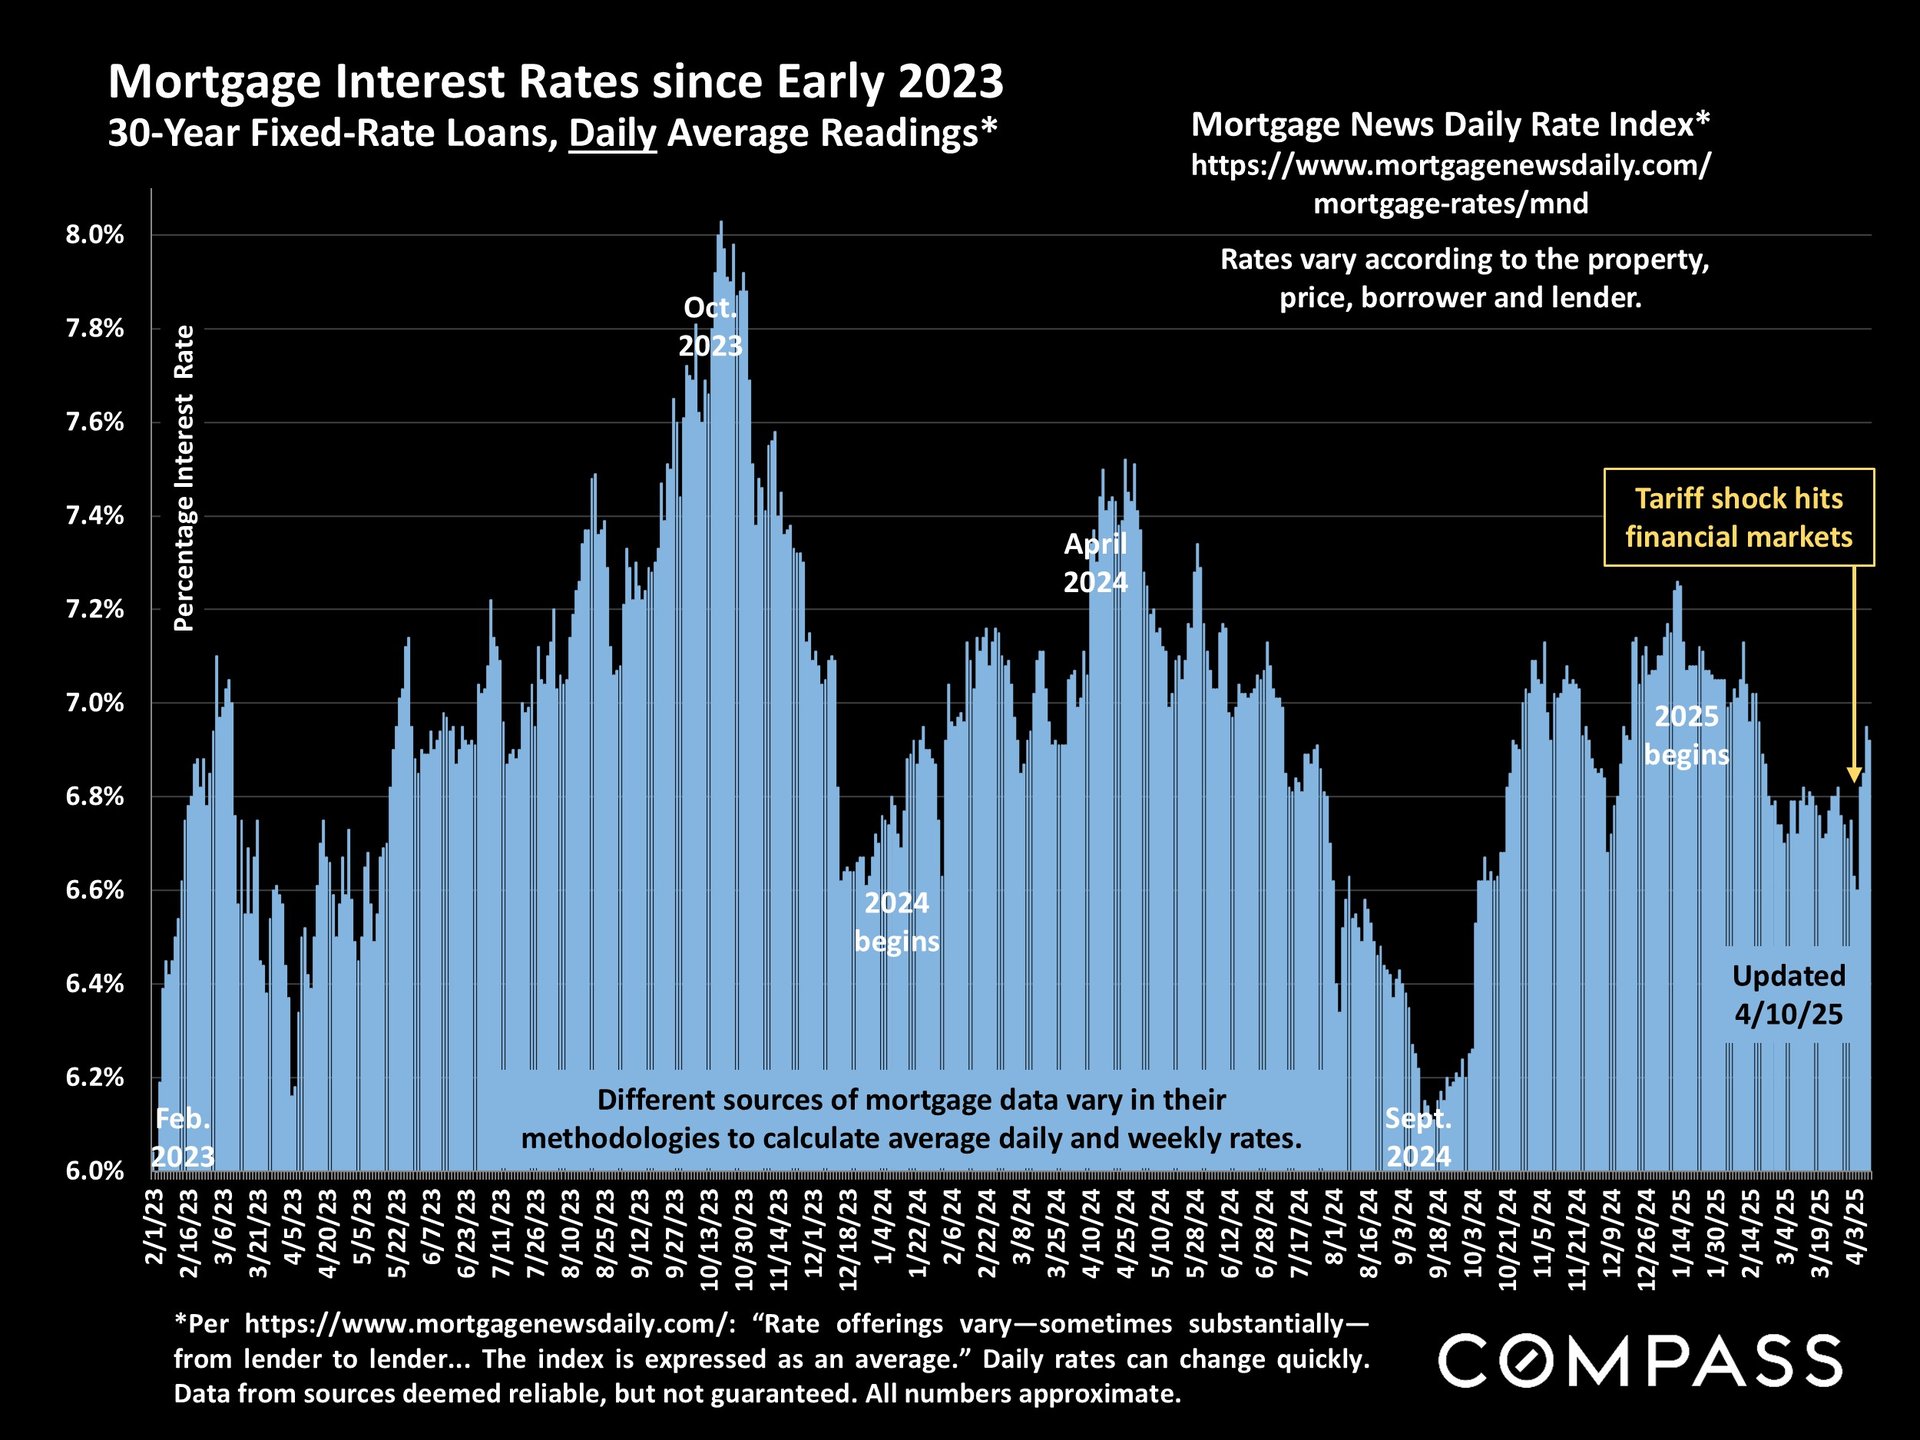
Interest rates: The new weekly average published today by Freddie Mac saw a small decline, and, ignoring the stupendous volatility in financial markets, Freddie Mac posted this statement: "The average 30-year fixed-rate mortgage continues to trend down, remaining under 7% for the twelfth consecutive week. As purchase applications continue to climb, the spring homebuying season is shaping up to look more favorable than last year." May their optimism prove warranted.
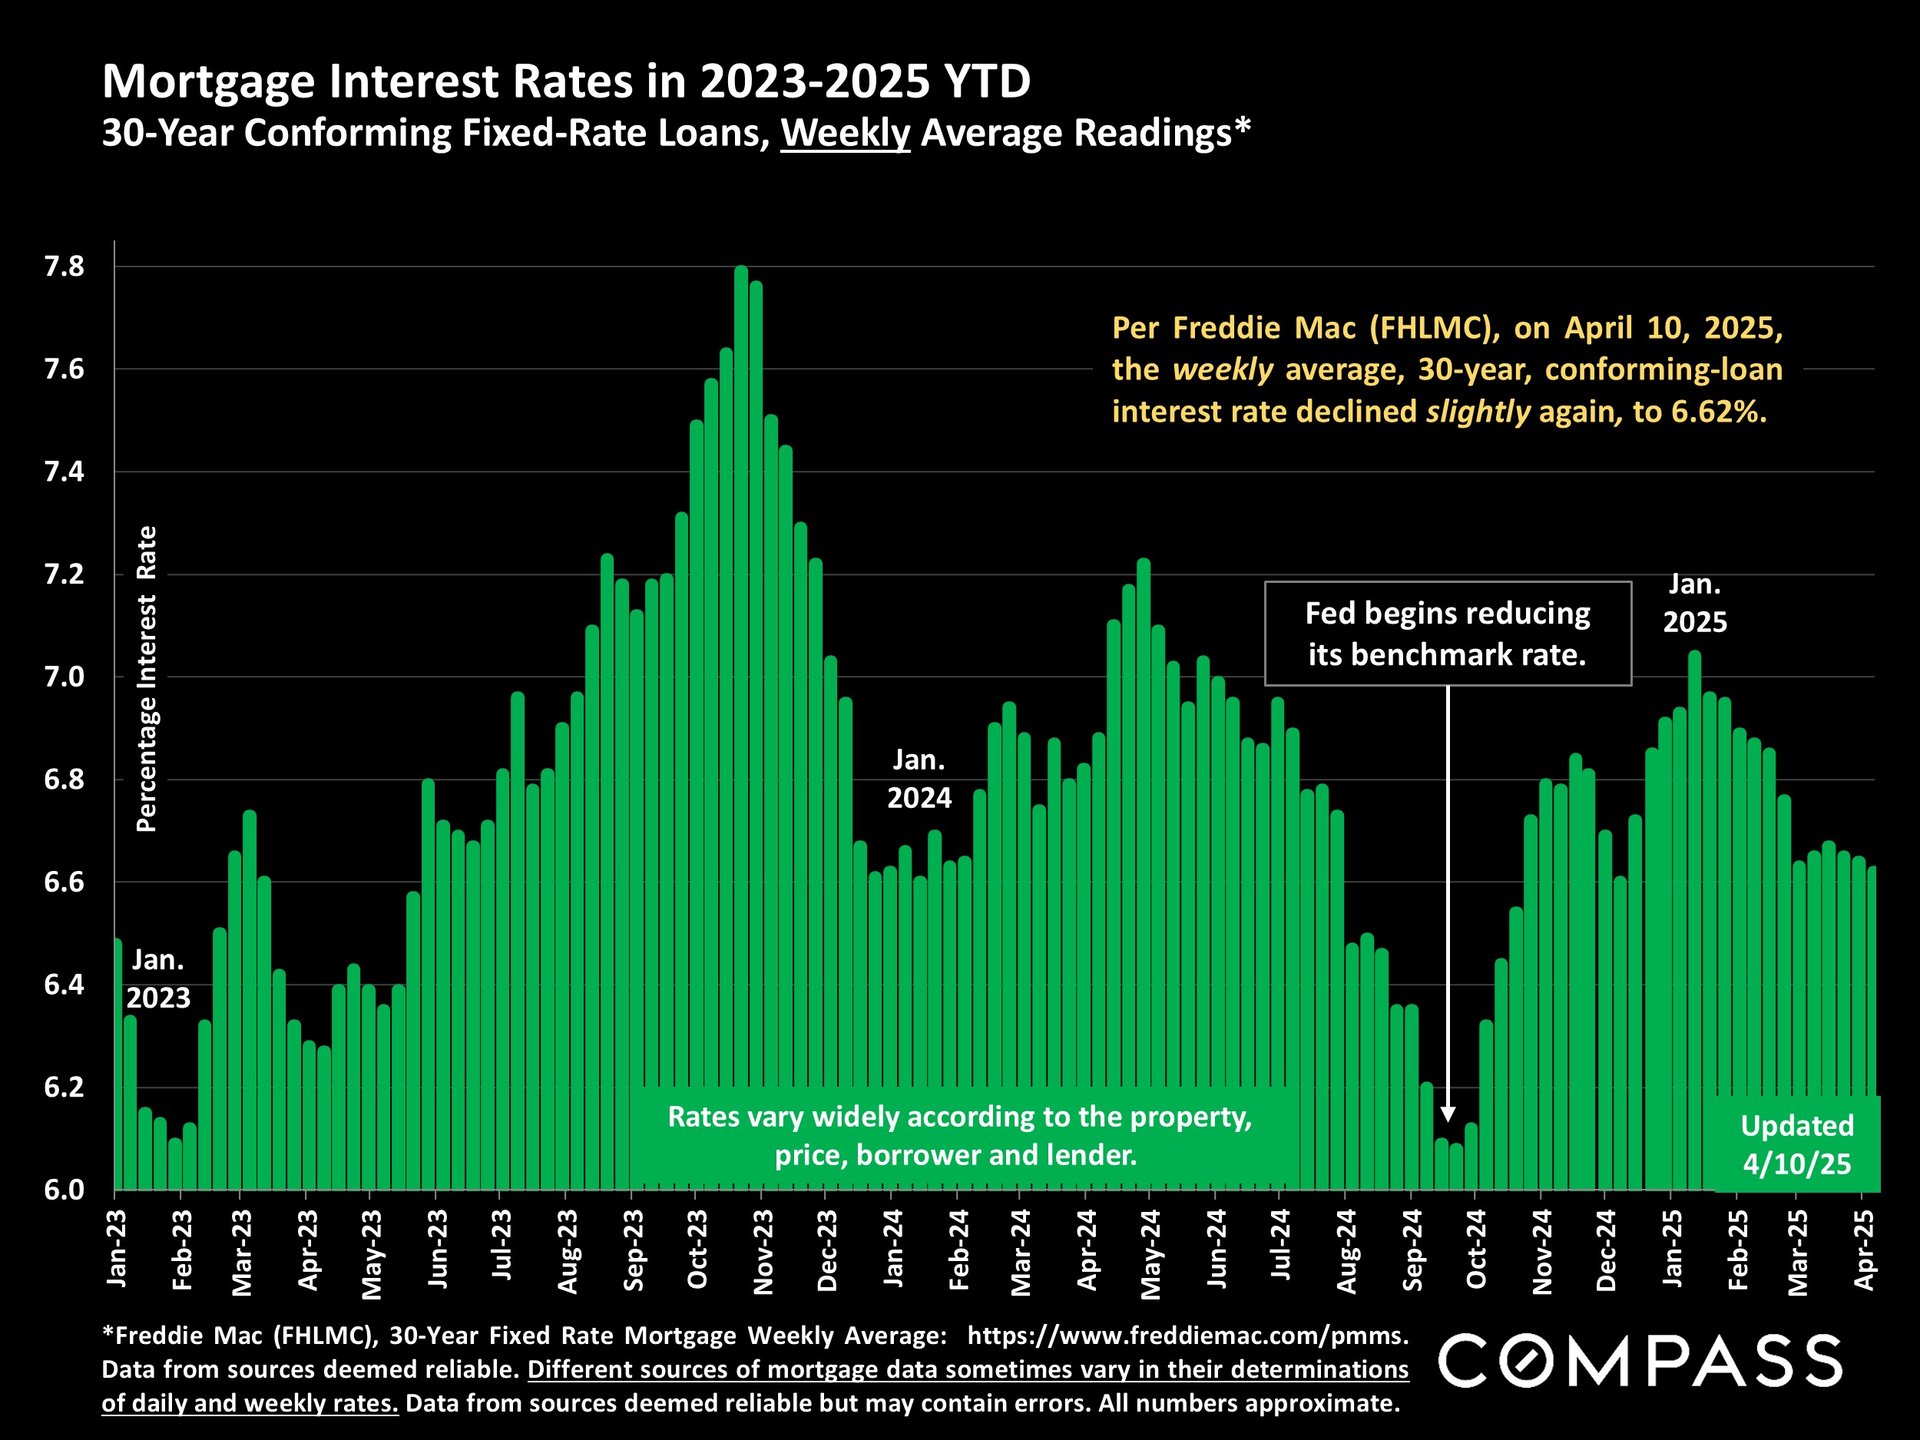
Mortgage News Daily, which tracks daily rates - which have spiked upward in recent days to just under 7% - was not quite so cheerful: From yesterday, "This was one of the most jarring trading days for mortgage specific bonds (in terms of the juxtaposition of big losses and big gains) in decades. Only a small handful of similar examples exist going back to the [2008} financial crisis."
Latest jobs report saw a larger increase than expected, however recent months' numbers have often ended up being substantially revised in future releases. Again, investors are focused on other economic factors right now.
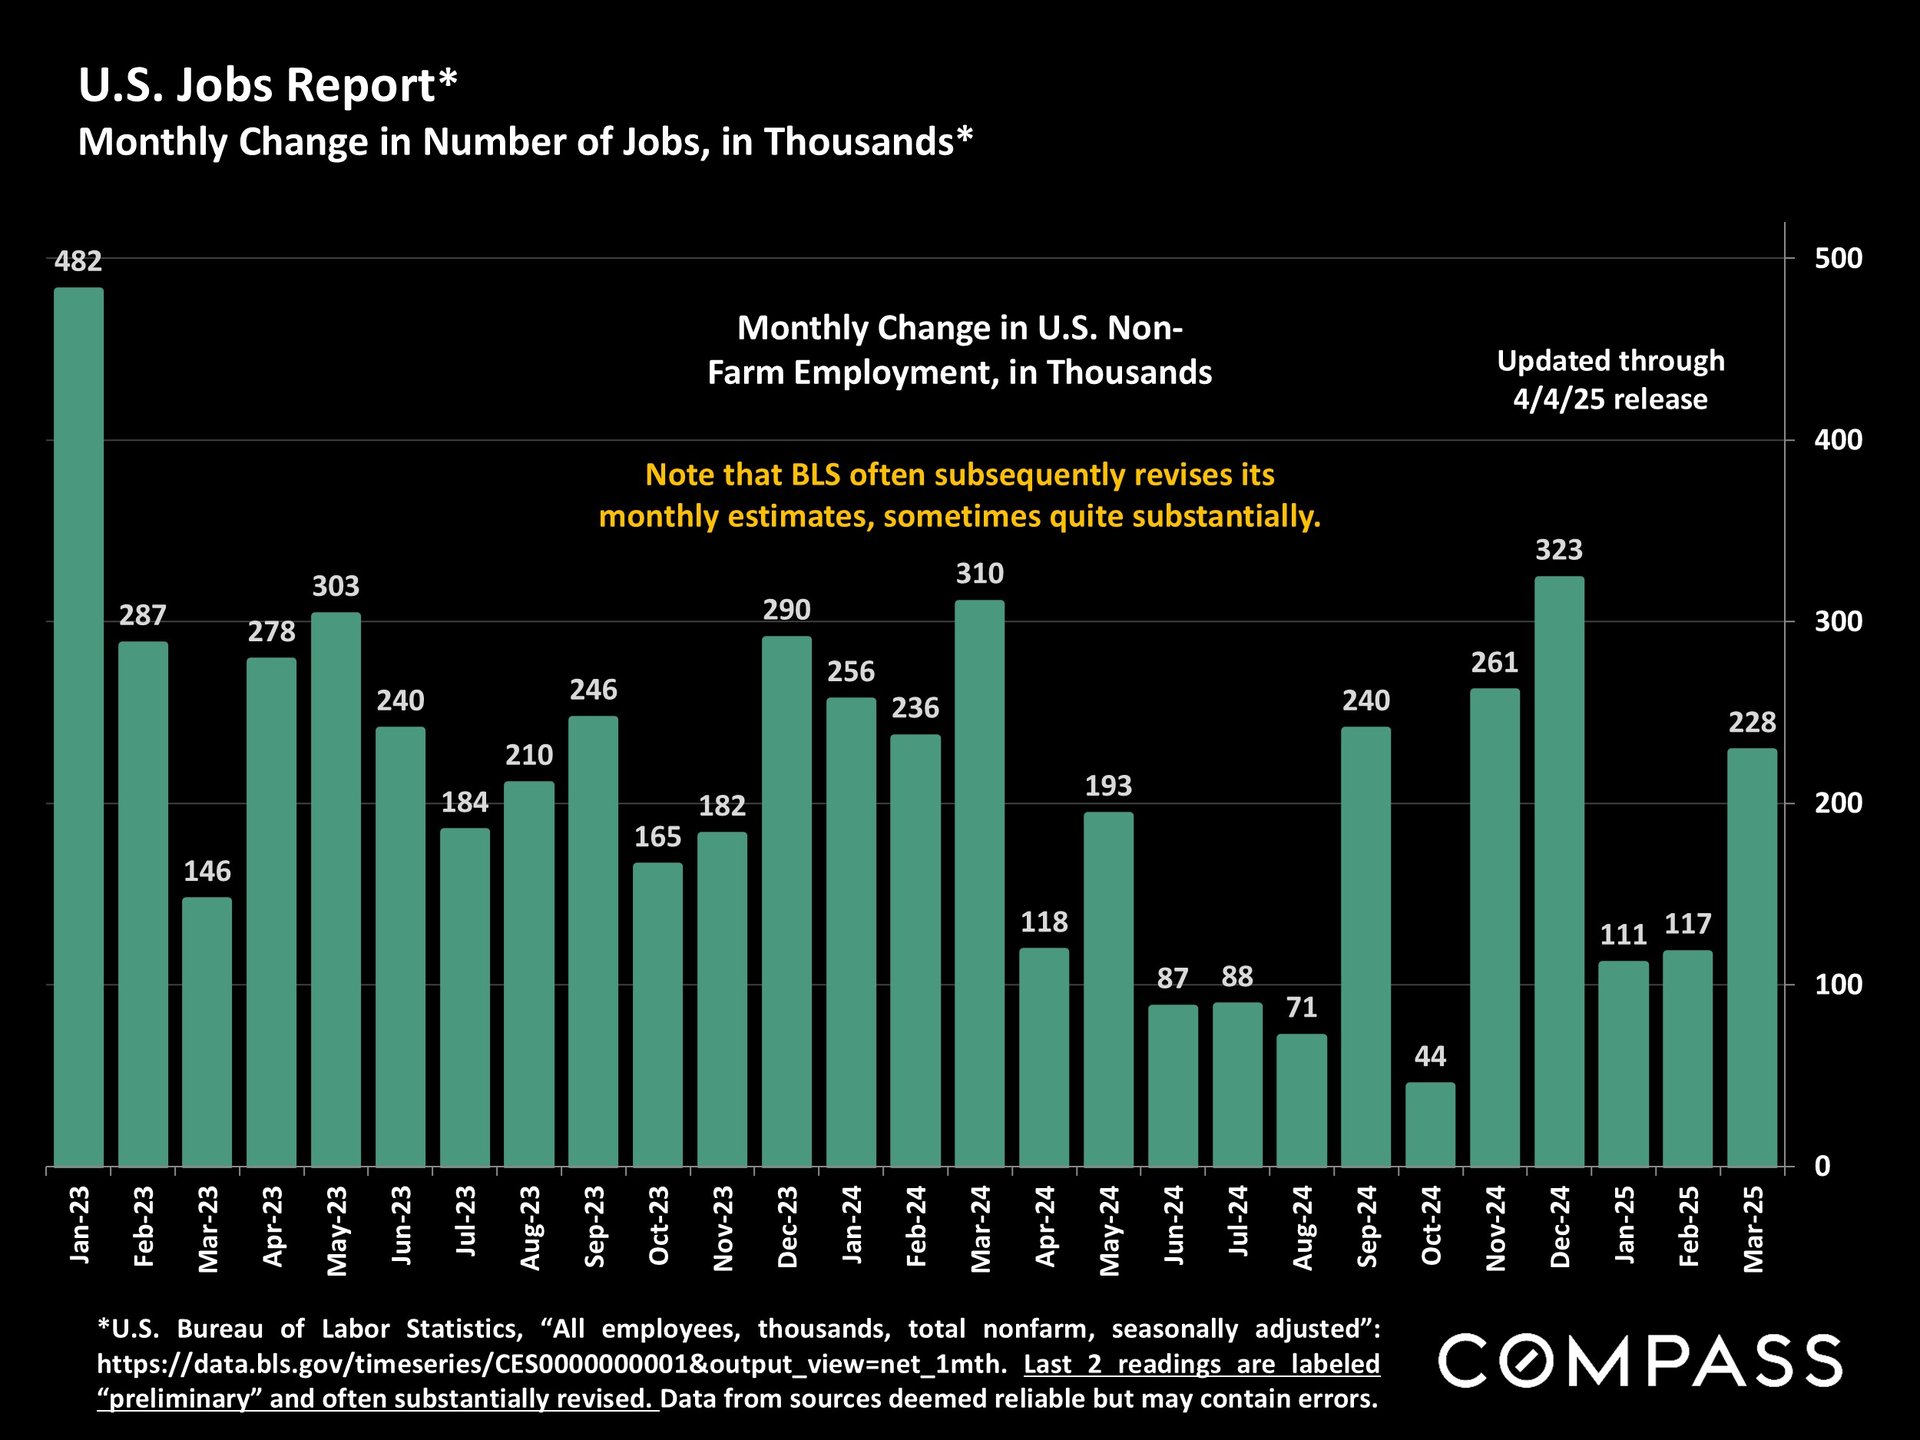
The new Consumer Sentiment report will be published tomorrow - I don't expect positive news on that front - and will be available online here.
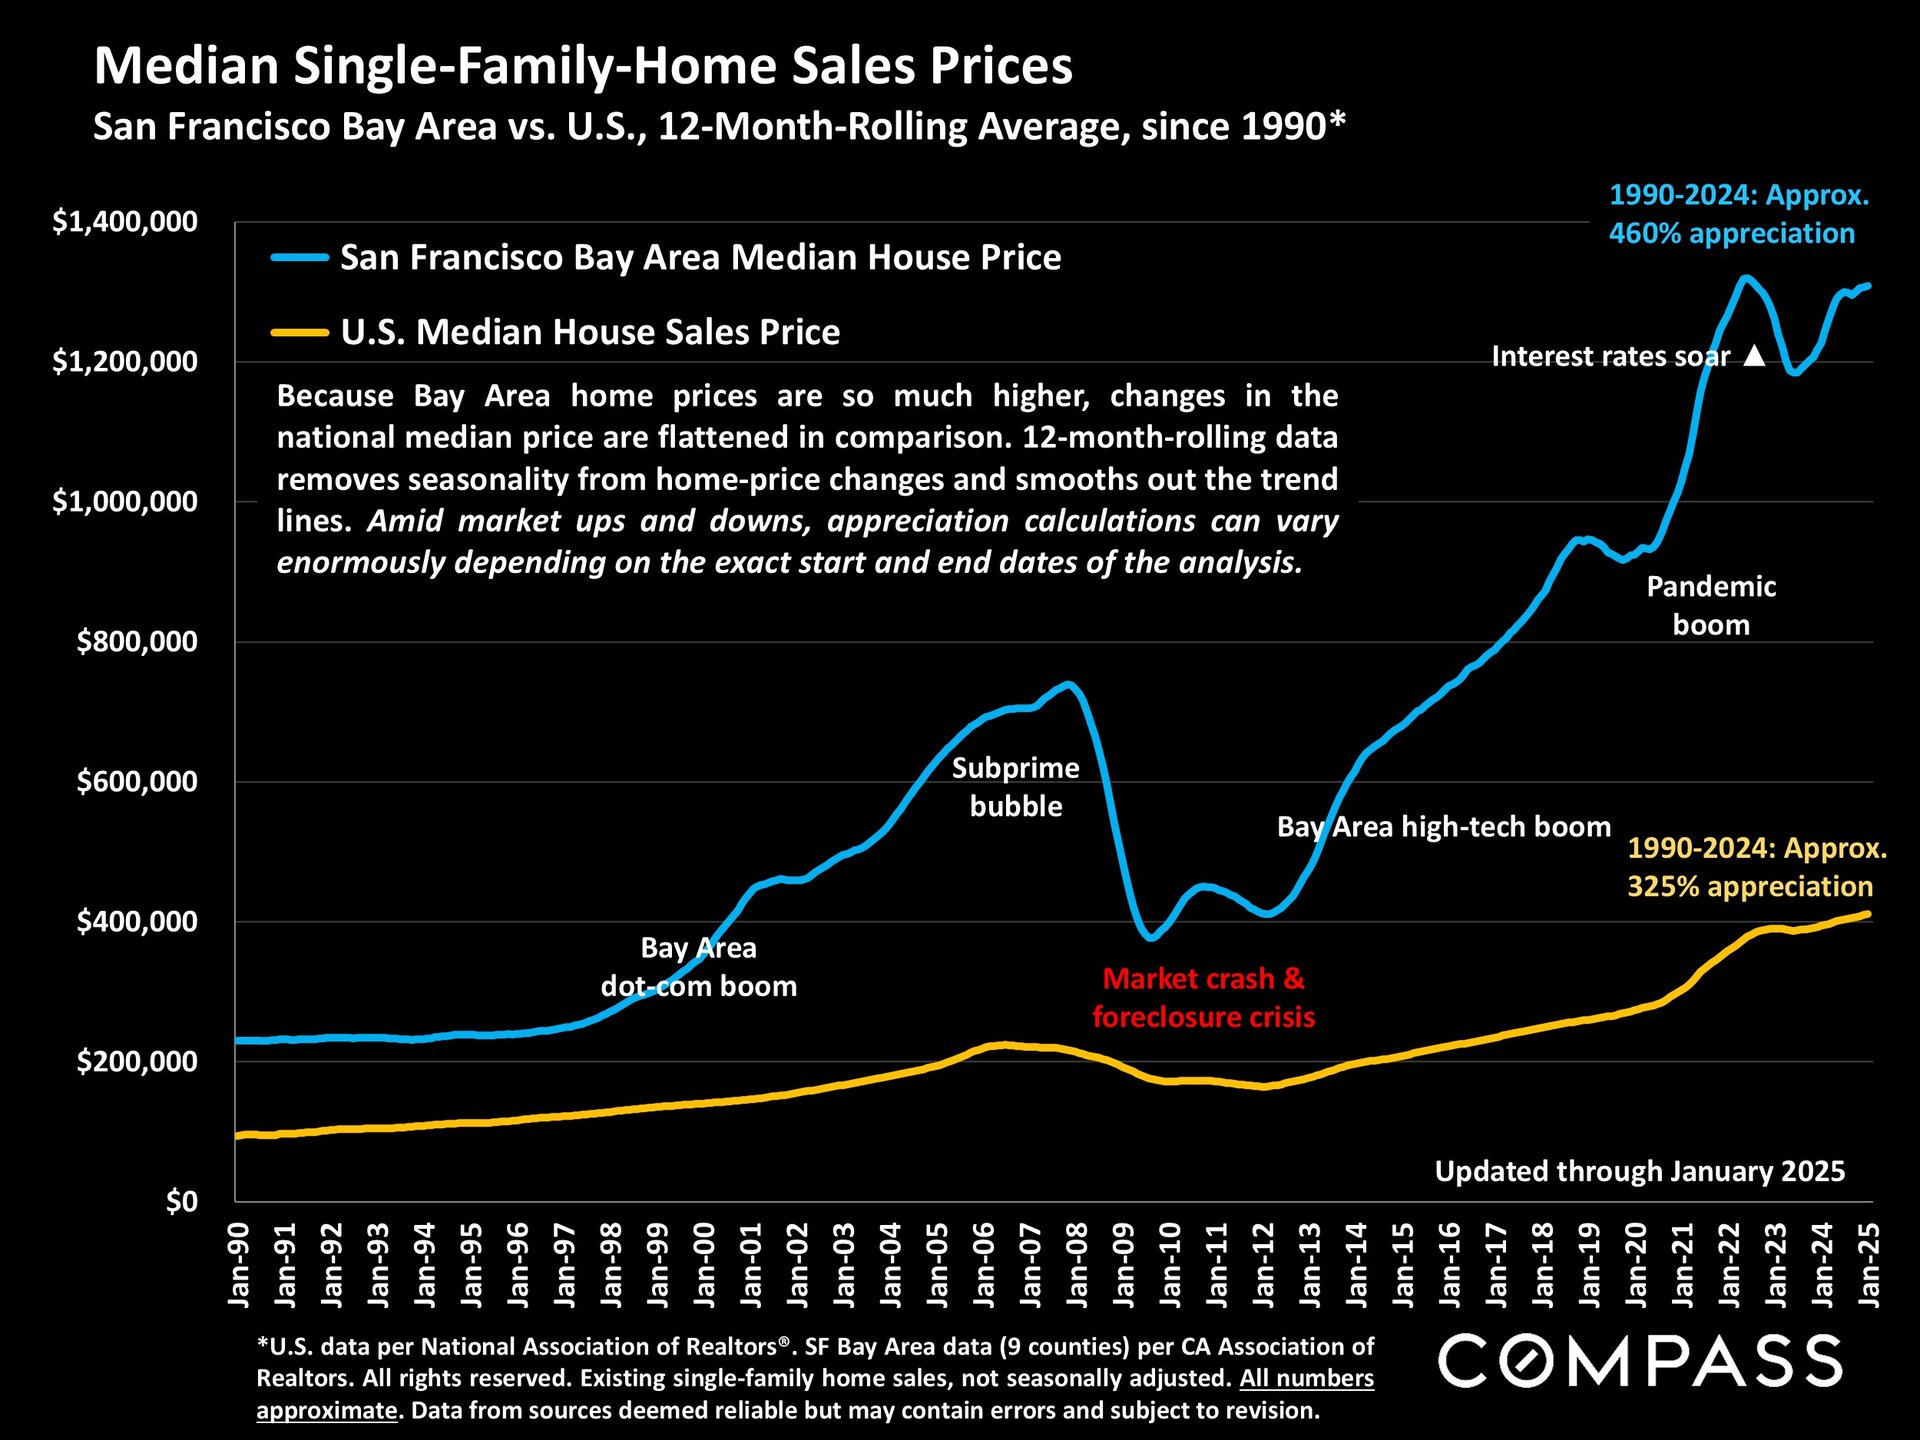
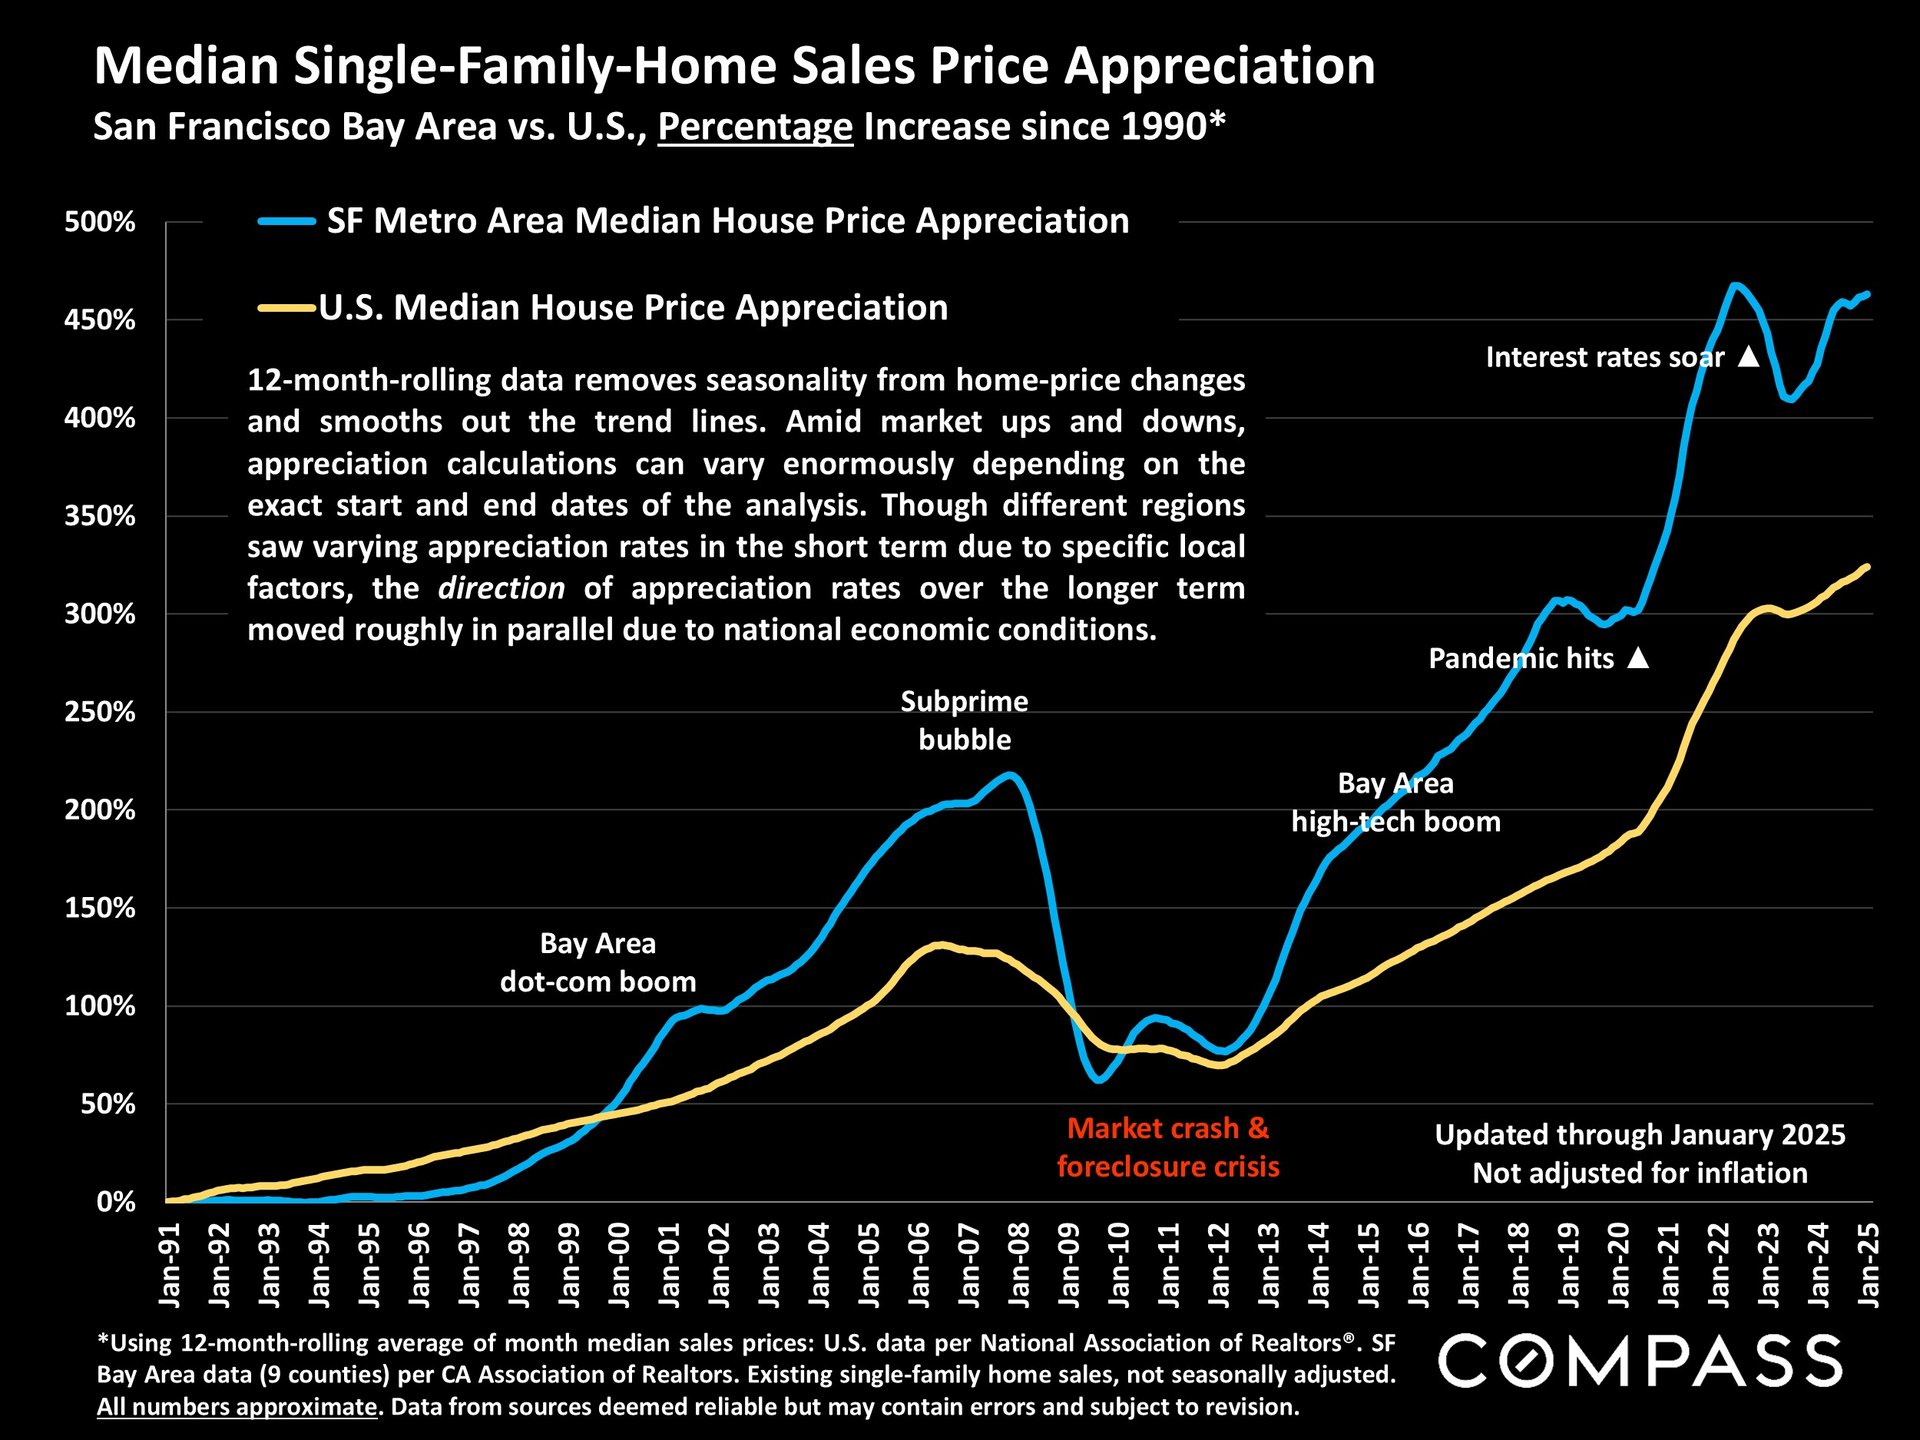
Long-term price and appreciation rates: Two overview charts comparing 1) median house sales prices , and 2) median house sales price appreciation rates between the greater Bay Area and the U.S. since 1990.
For someone who wants to dig in deep on Bay Area Market Cycles,
the full flipbook report is here. This report in its various revisions over the last 15 years has received hundreds of thousands of viewings.
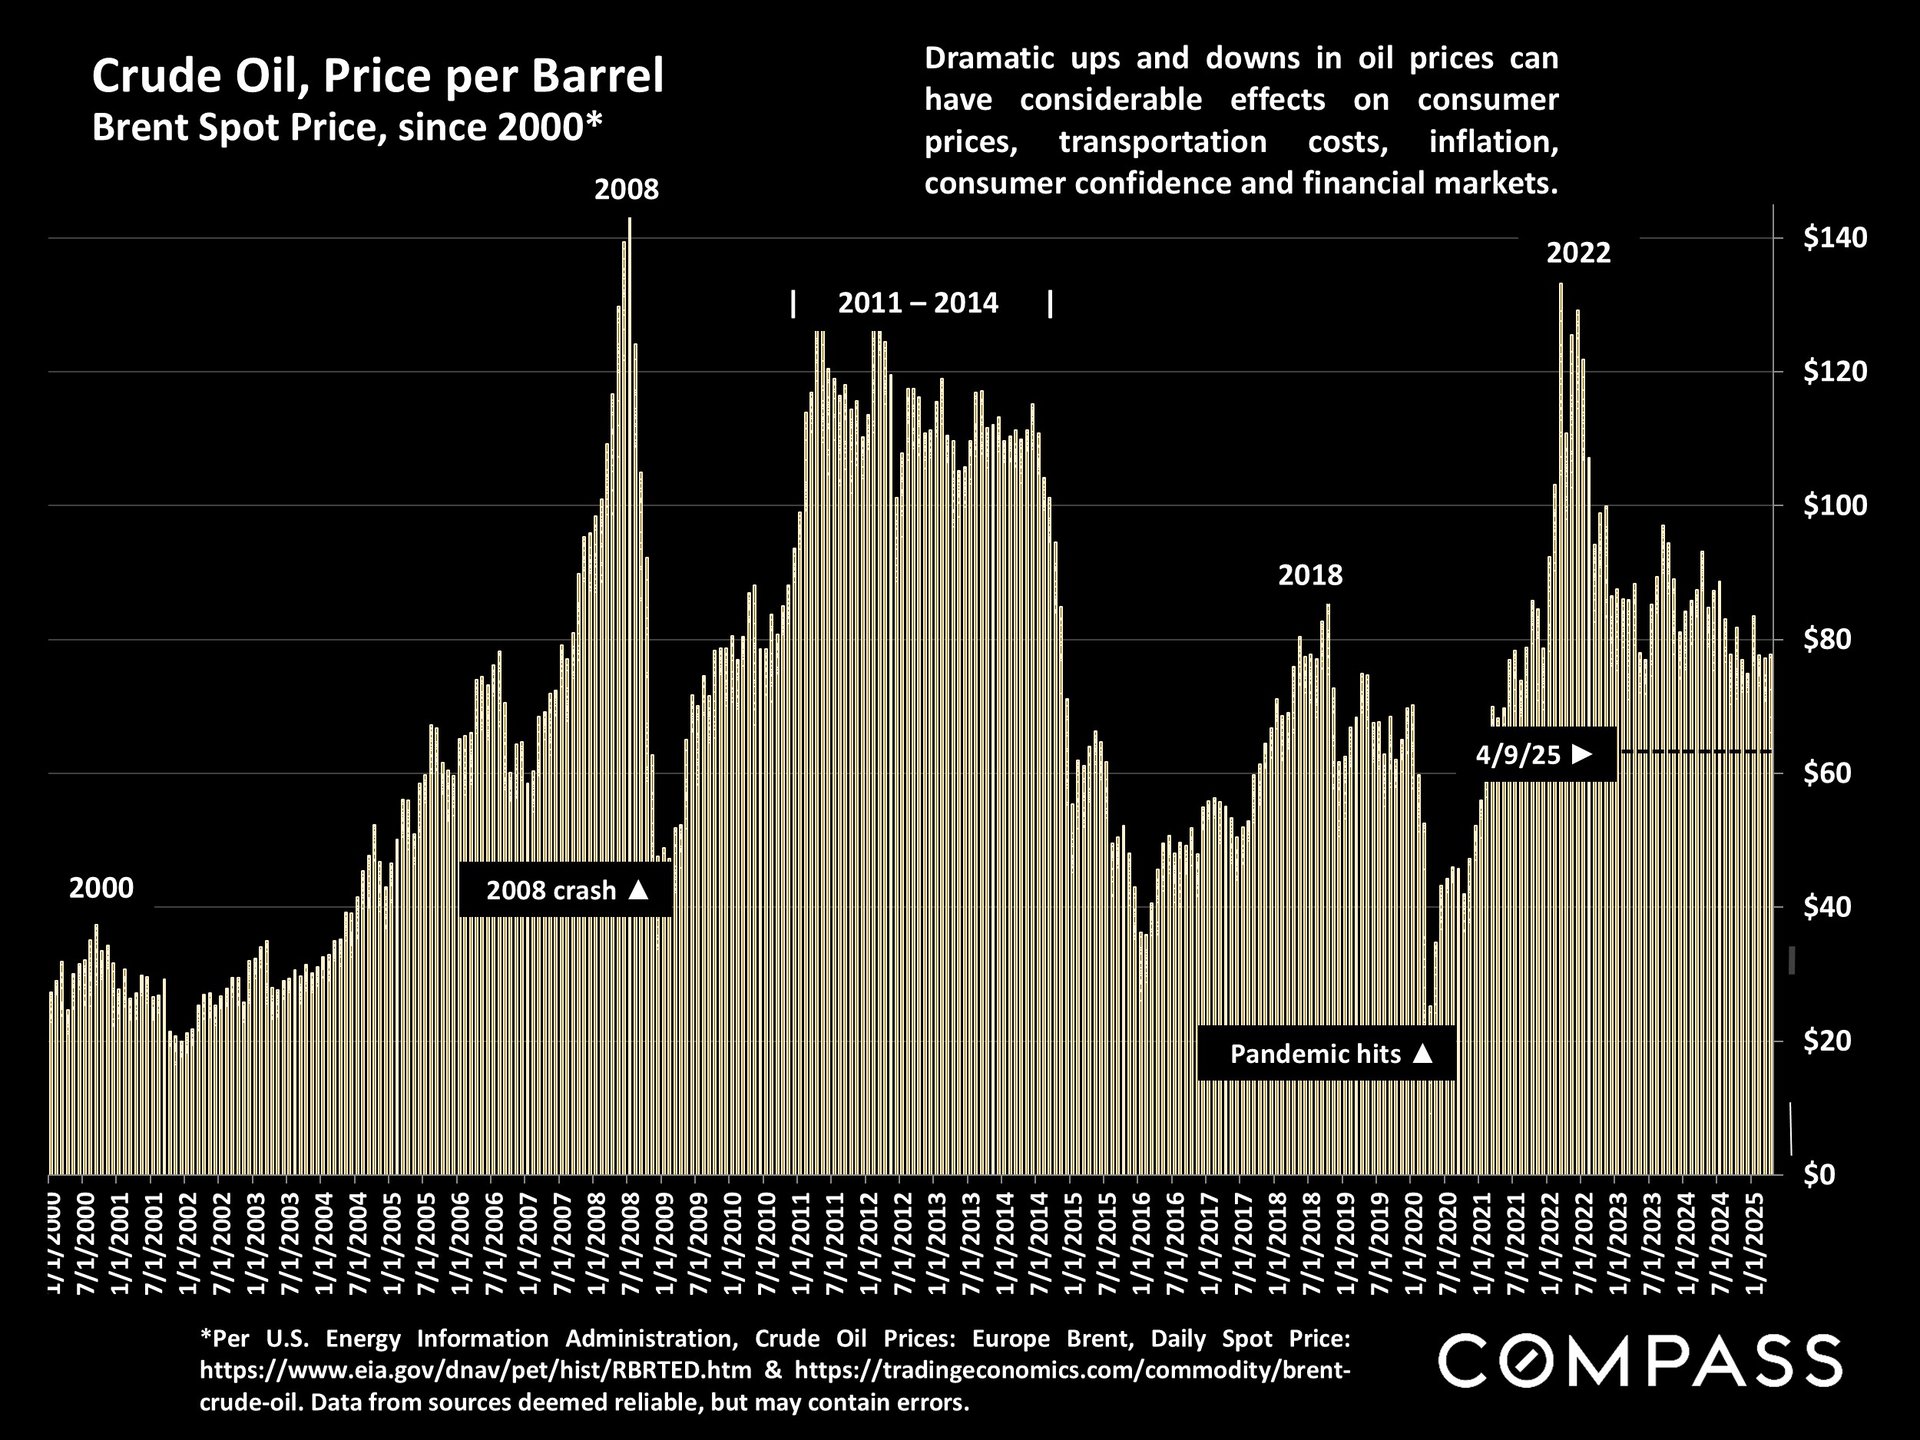
The price of oil has been plunging over concerns regarding the future of worldwide economic conditions in light of the unsettling tariff policy changes emanating daily from Washington. The drop in oil prices was a factor in the drop in the inflation rate.