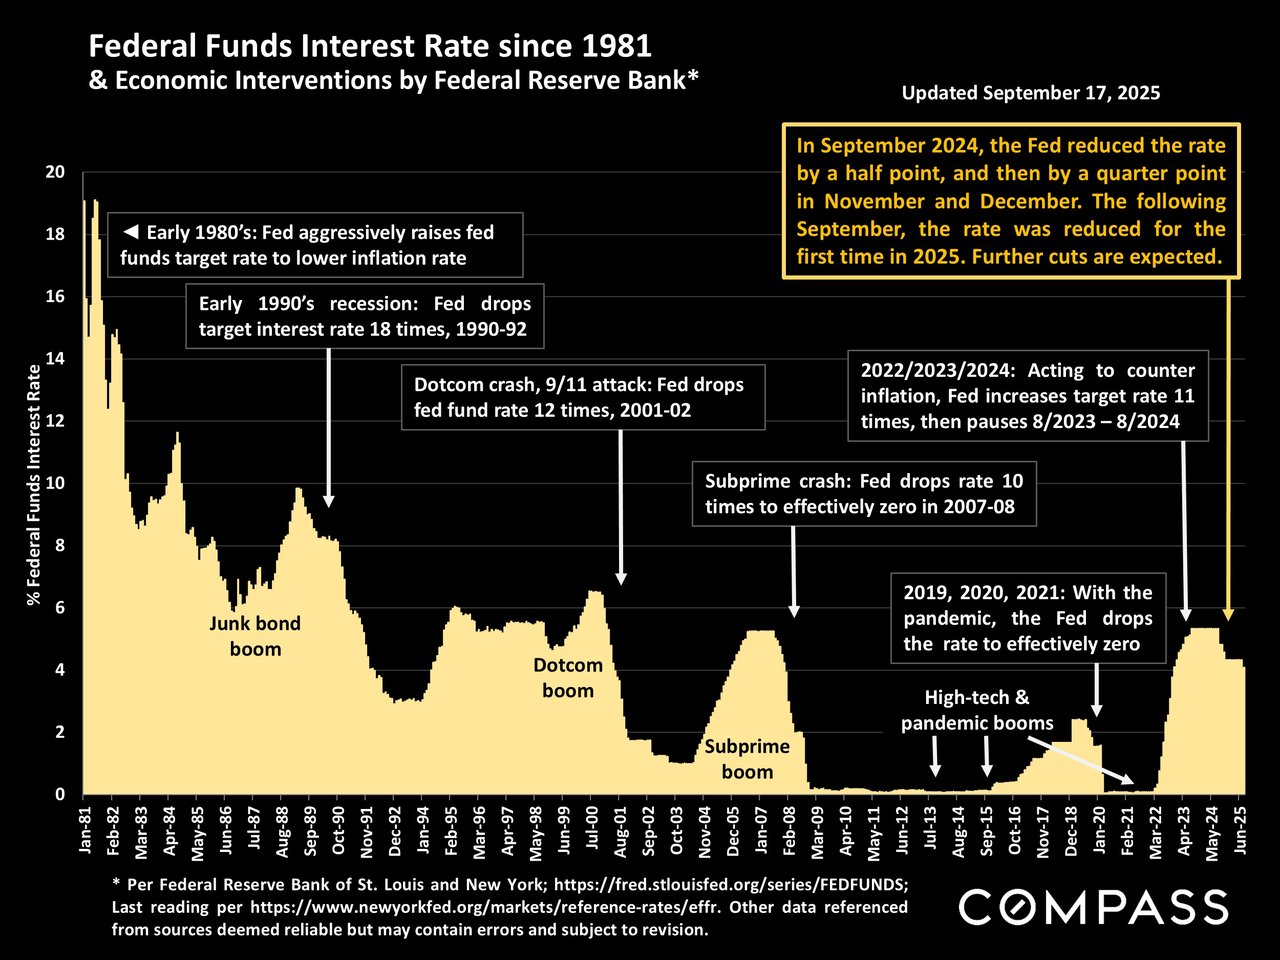
Chart of the federal funds interest rate from 1981 to 2025, annotated with rate changes and economic events.

Economic Interventions

  • September 22, 2025

The Fed cut its benchmark rate by .25% yesterday and more cuts are currently expected by the end of the year, though much depends on future jobs and inflation data.
Chart of the federal funds interest rate from 1981 to 2025, annotated with rate changes and economic events.

 
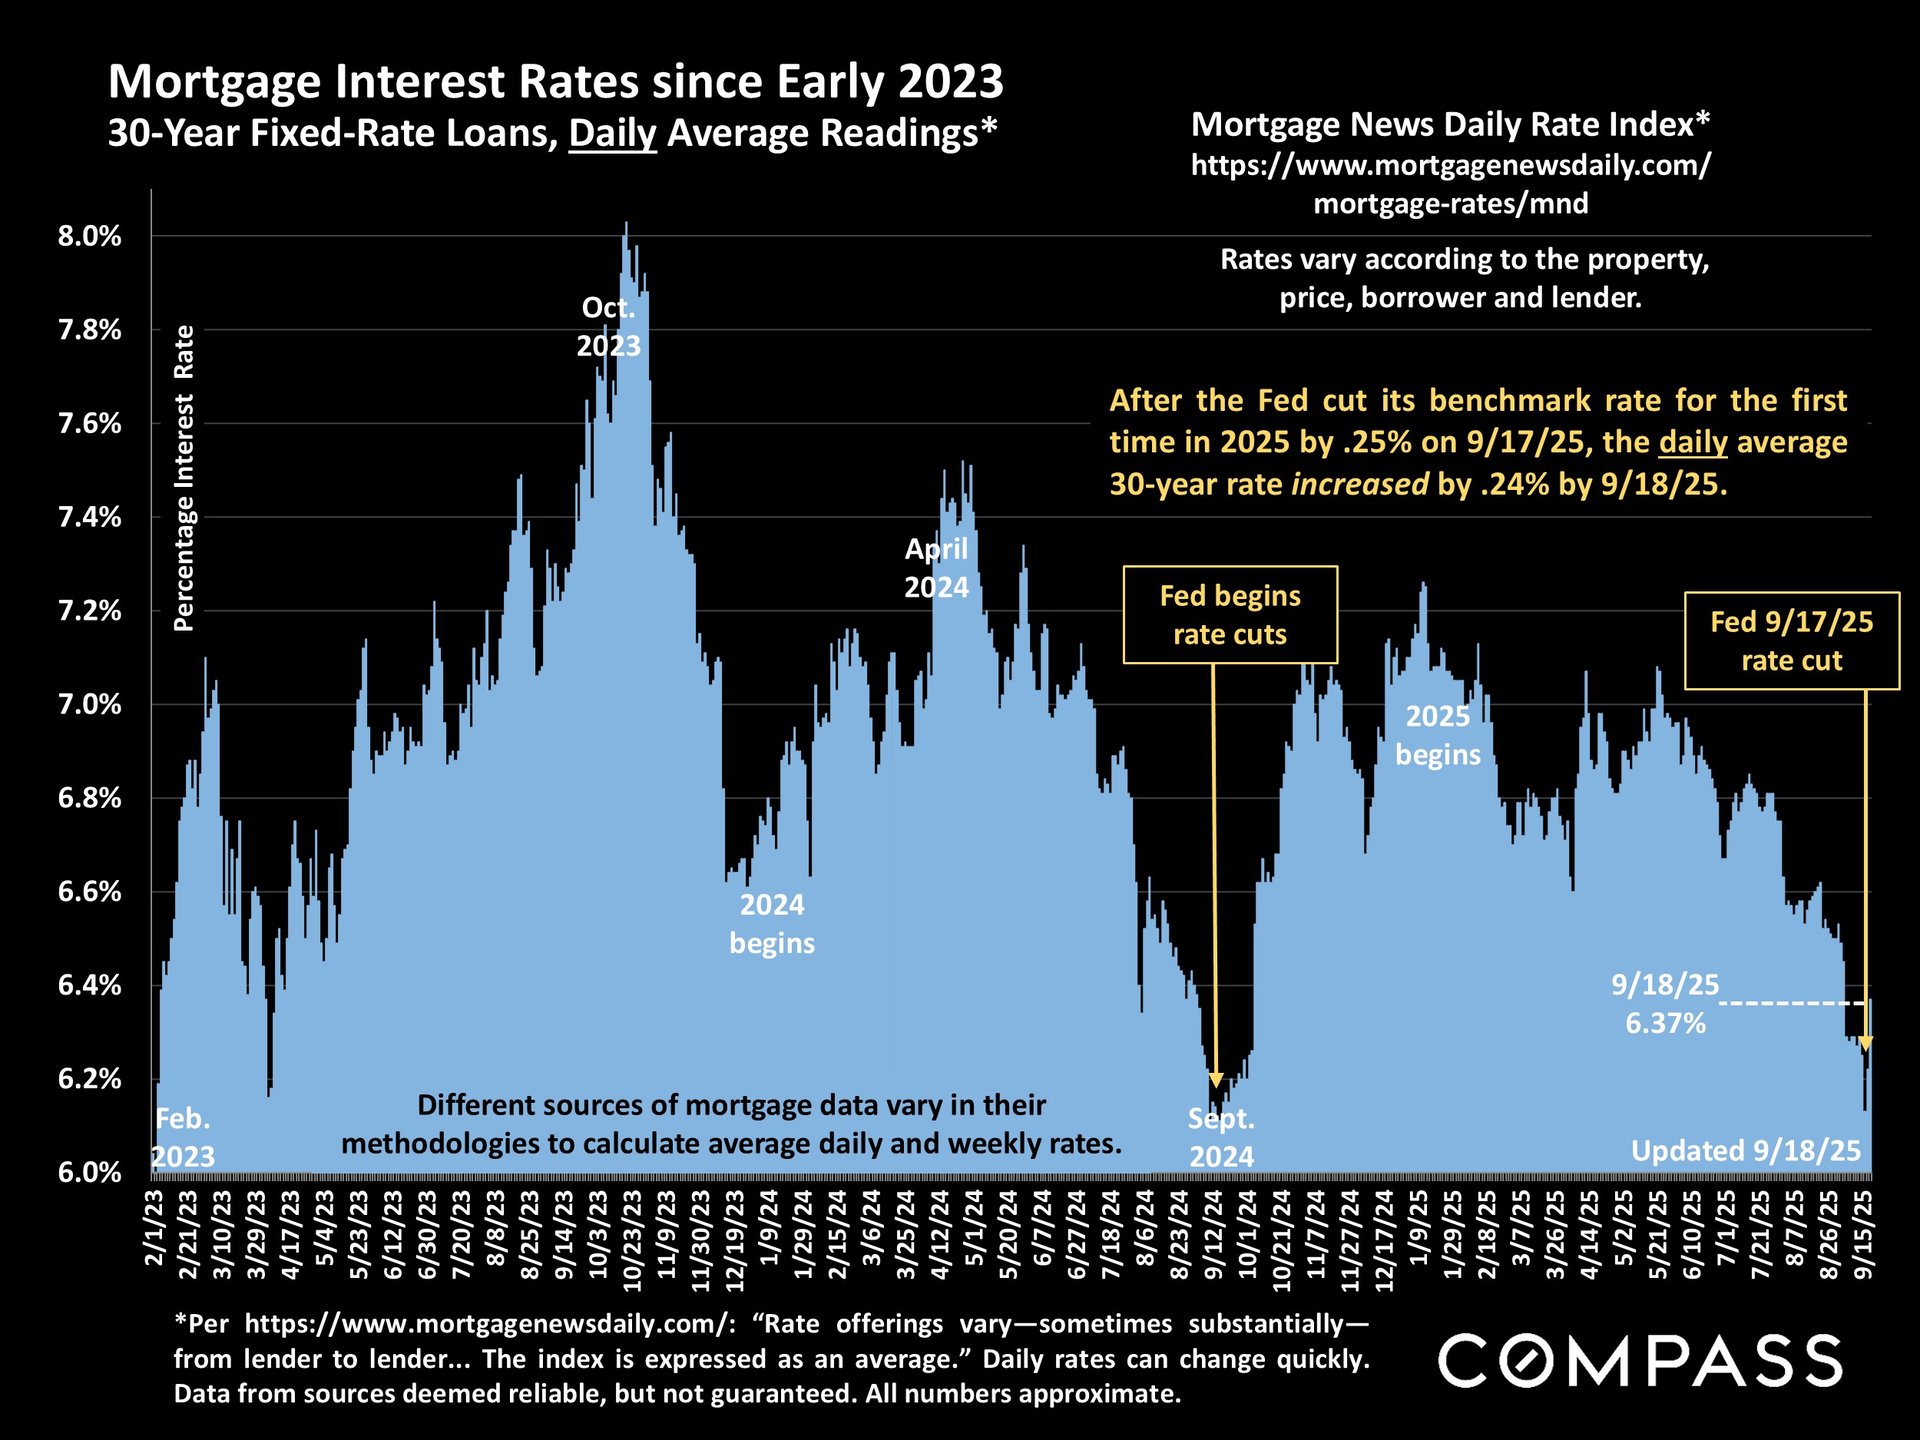
The weekly average 30-year rate published by Freddie Mac today declined again, but the daily average rate published by Mortgage News Daily has risen .24% since the rate cut was announced. Last year in September 2024, when the Fed first cut its benchmark rate since 2022, mortgage rates also increased (dramatically). See charts below. But it's far too soon to predict how this will all play out in coming weeks and months. 
 
WEEKLY average rate, published today 9/18/25:  
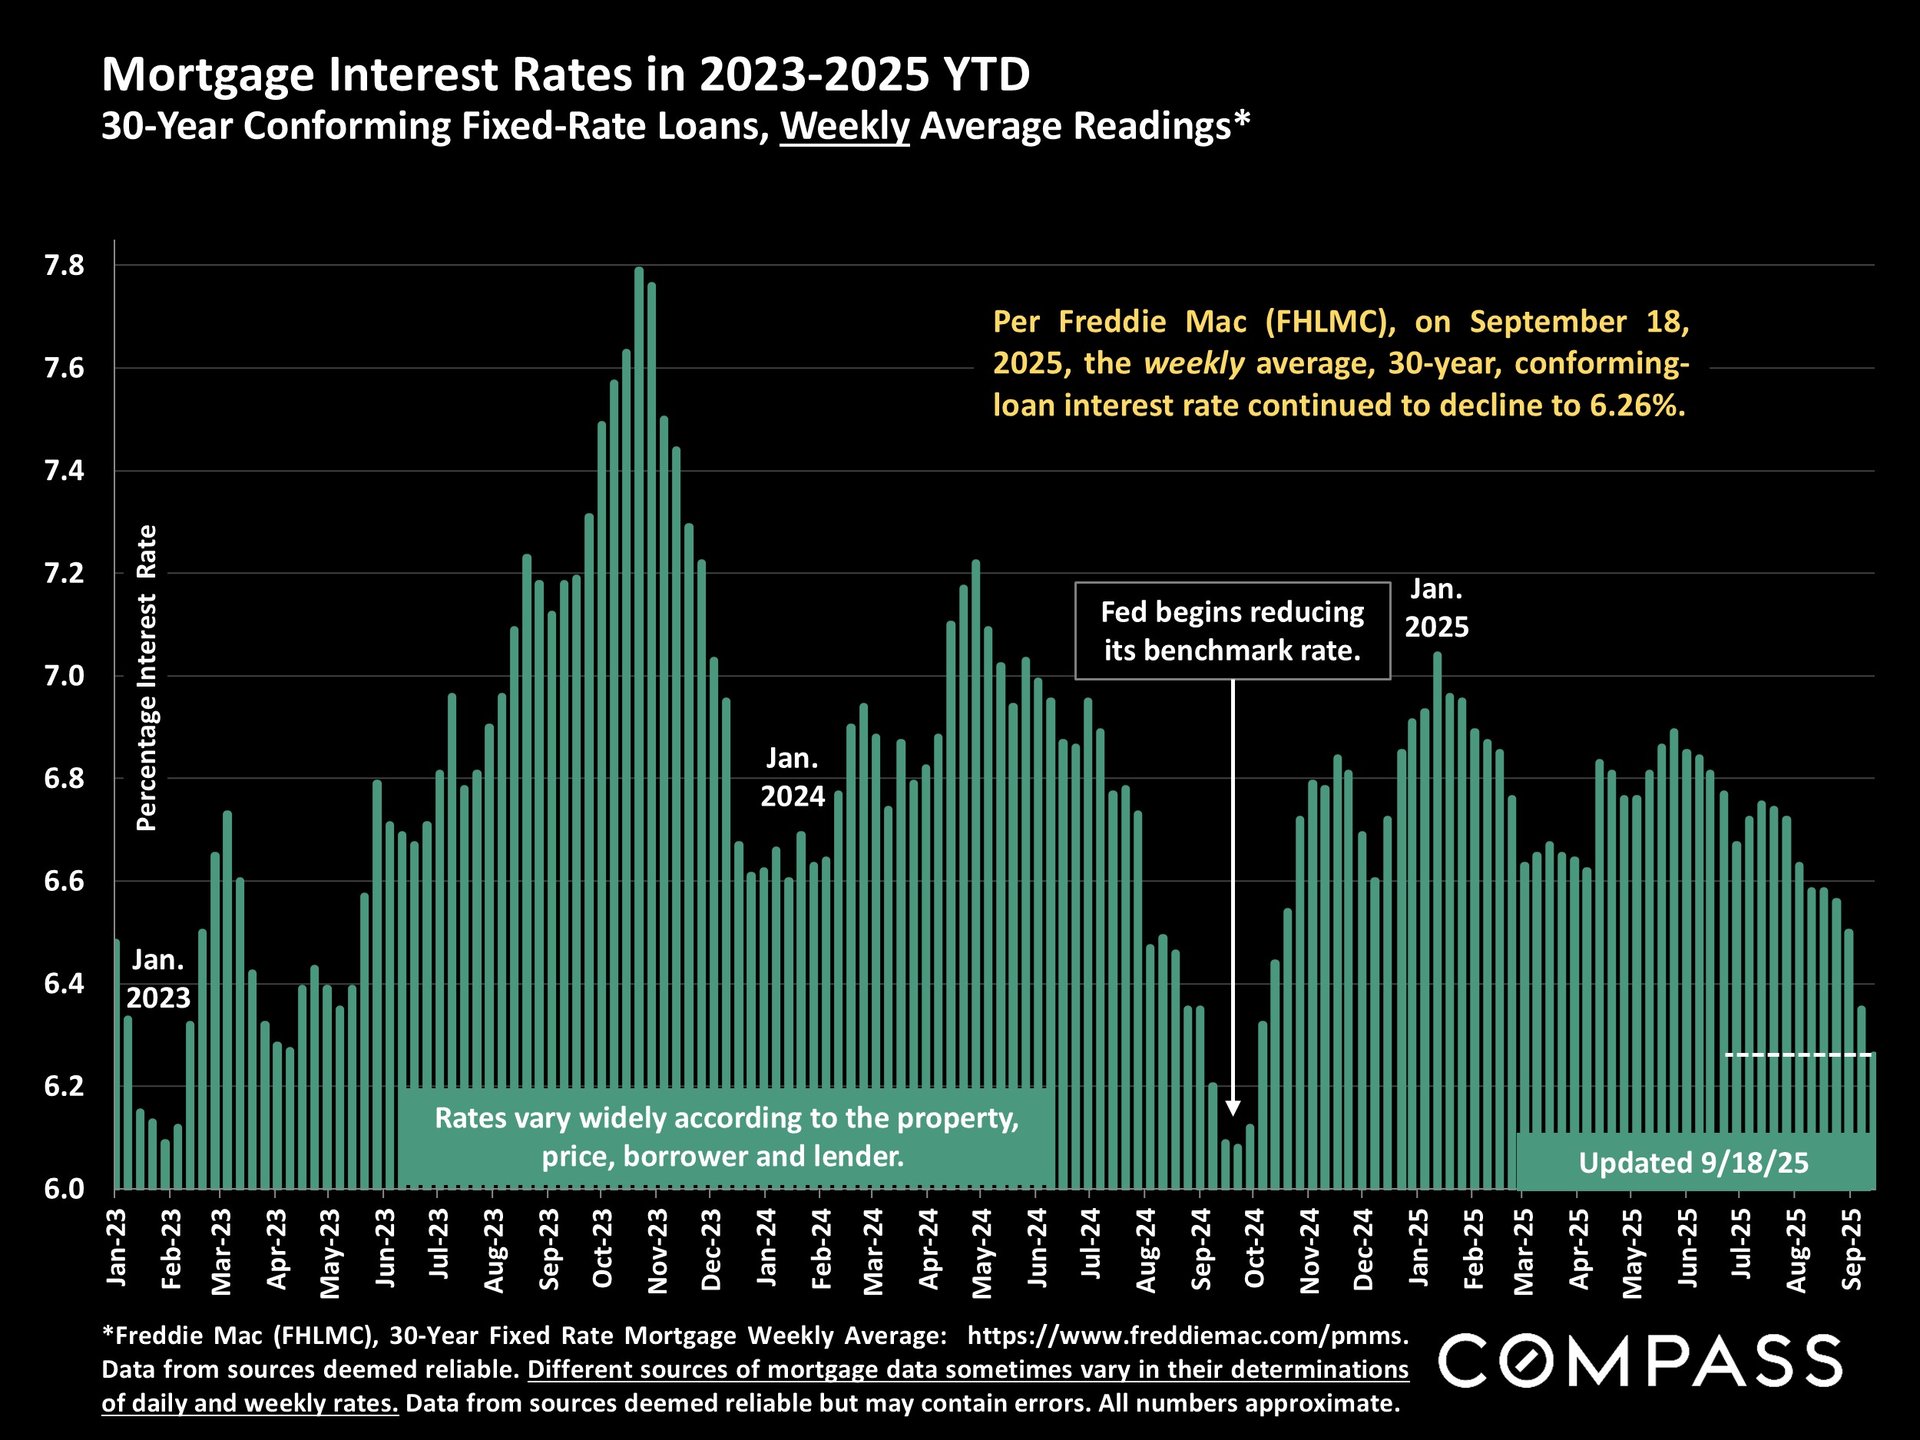
 
Chart of weekly 30-year mortgage rates from January 2023 to September 2025, ending at 6.26%.
 
DAILY average rate published today: 
 
Chart of daily average 30-year fixed mortgage rates from February 2023 through September 2025, with a September 18 rate of 6.37%.
 
Stock markets continue to hit new highs. 
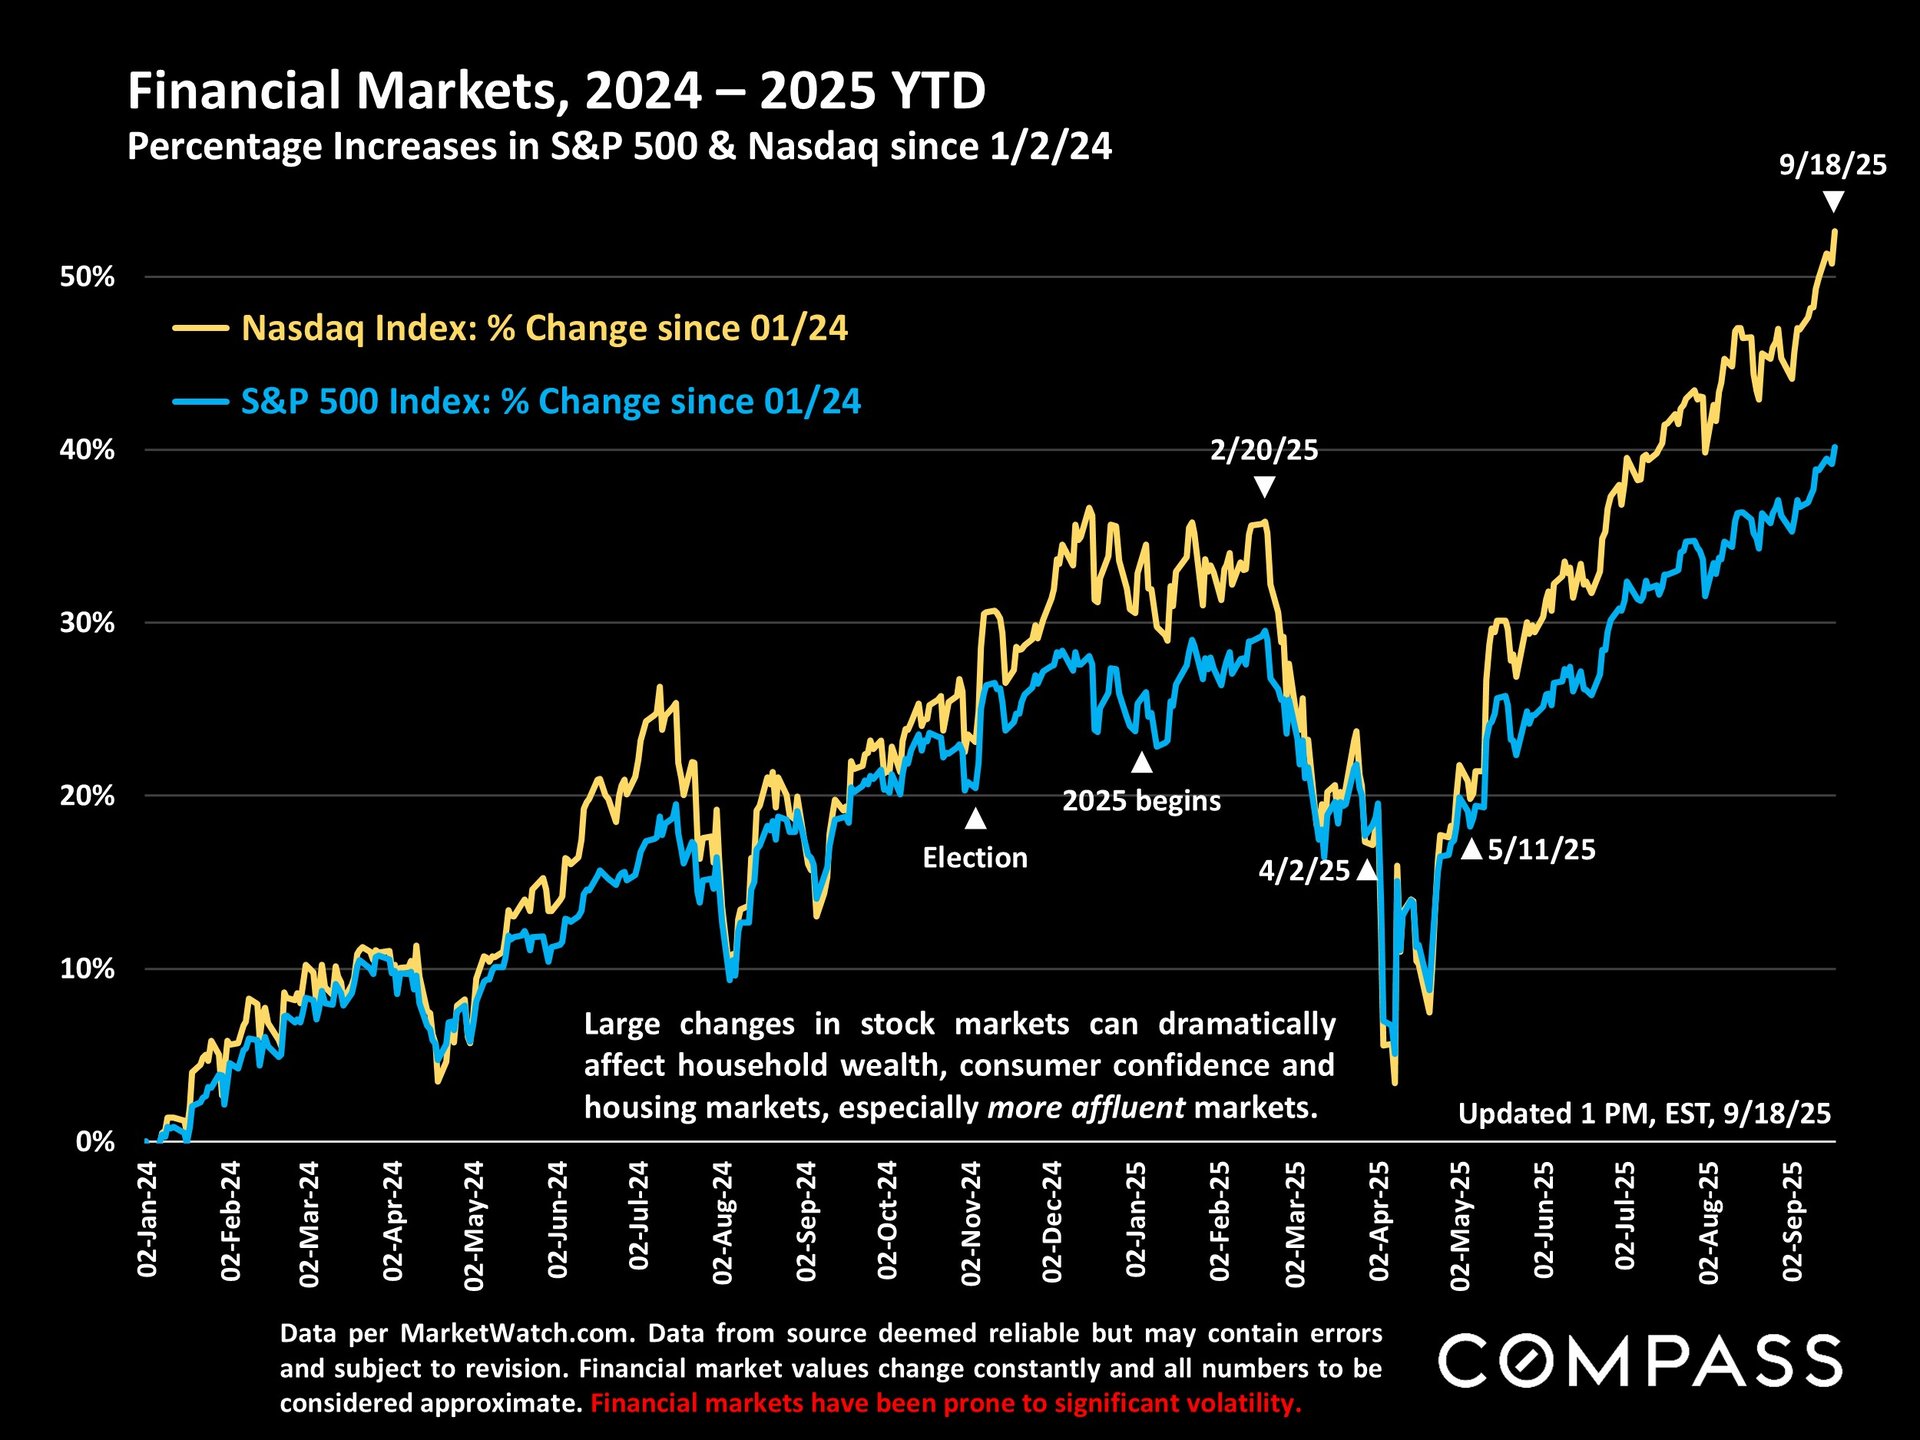
 
Chart comparing Nasdaq and S&P 500 percentage gains from January 2024 to September 2025.
 
An updated BAY AREA MARKET SEASONALITY pdf report as well as individual chart images illustrating broad seasonal effects on supply, demand and median sales prices are in this folder. 
 
The SEASONALITY flipbook is posted here. 
 
You can always find a selection of seasonality charts specific to your regional market in the monthly Bay Area newsletters, such as those included in the September reports. 
 
Below are 5 of the 10 charts in the MARKET SEASONALITY report:  
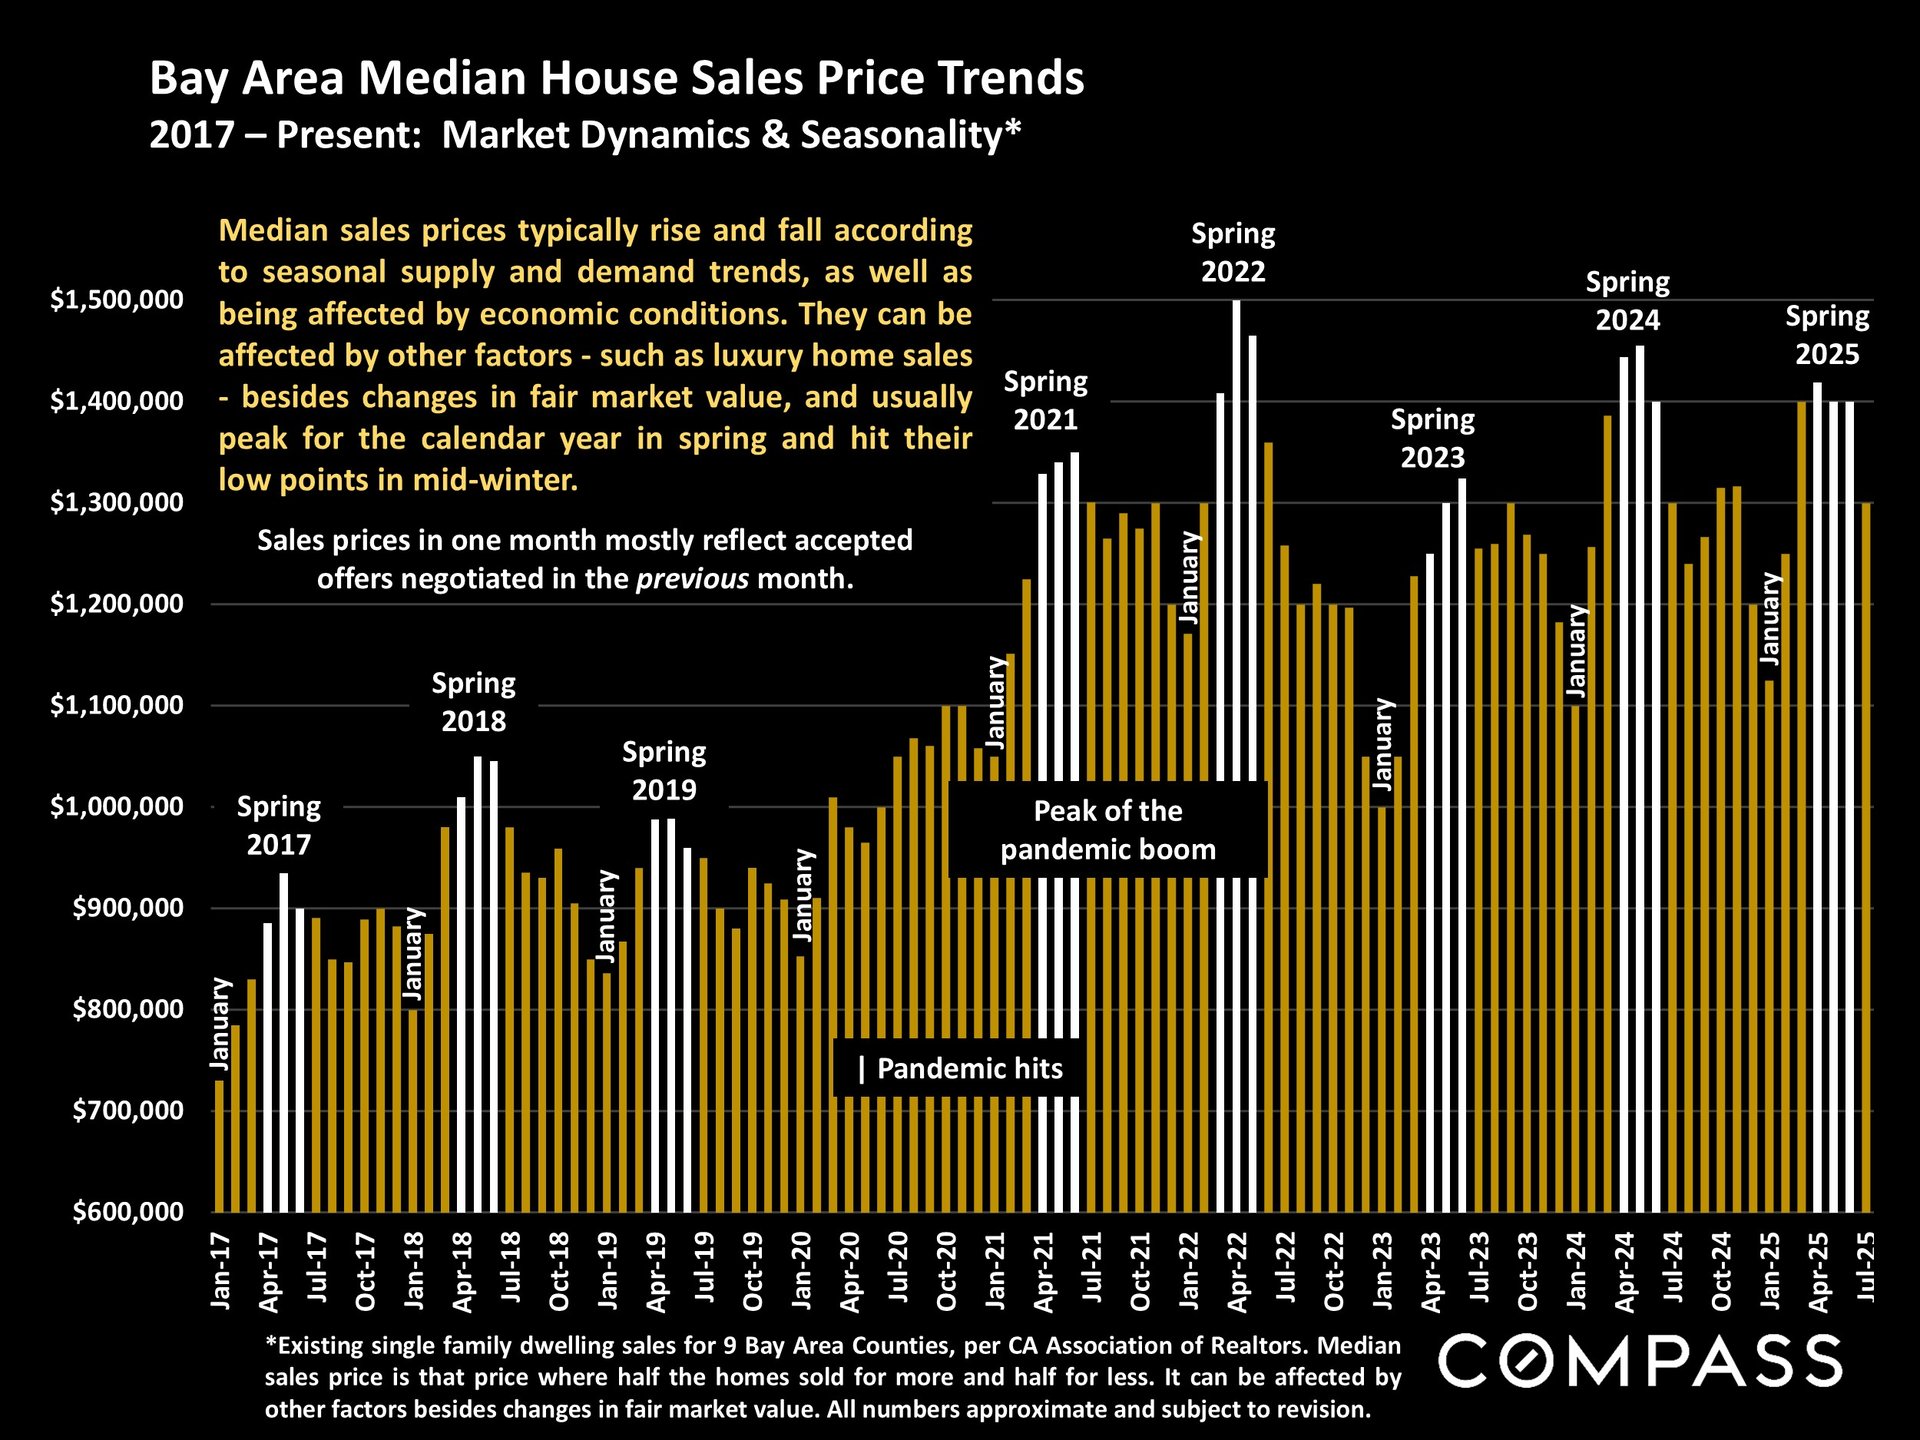
 
Chart of Bay Area median home sale prices, 2017–2025, highlighting spring peaks and the pandemic-era boom.
 
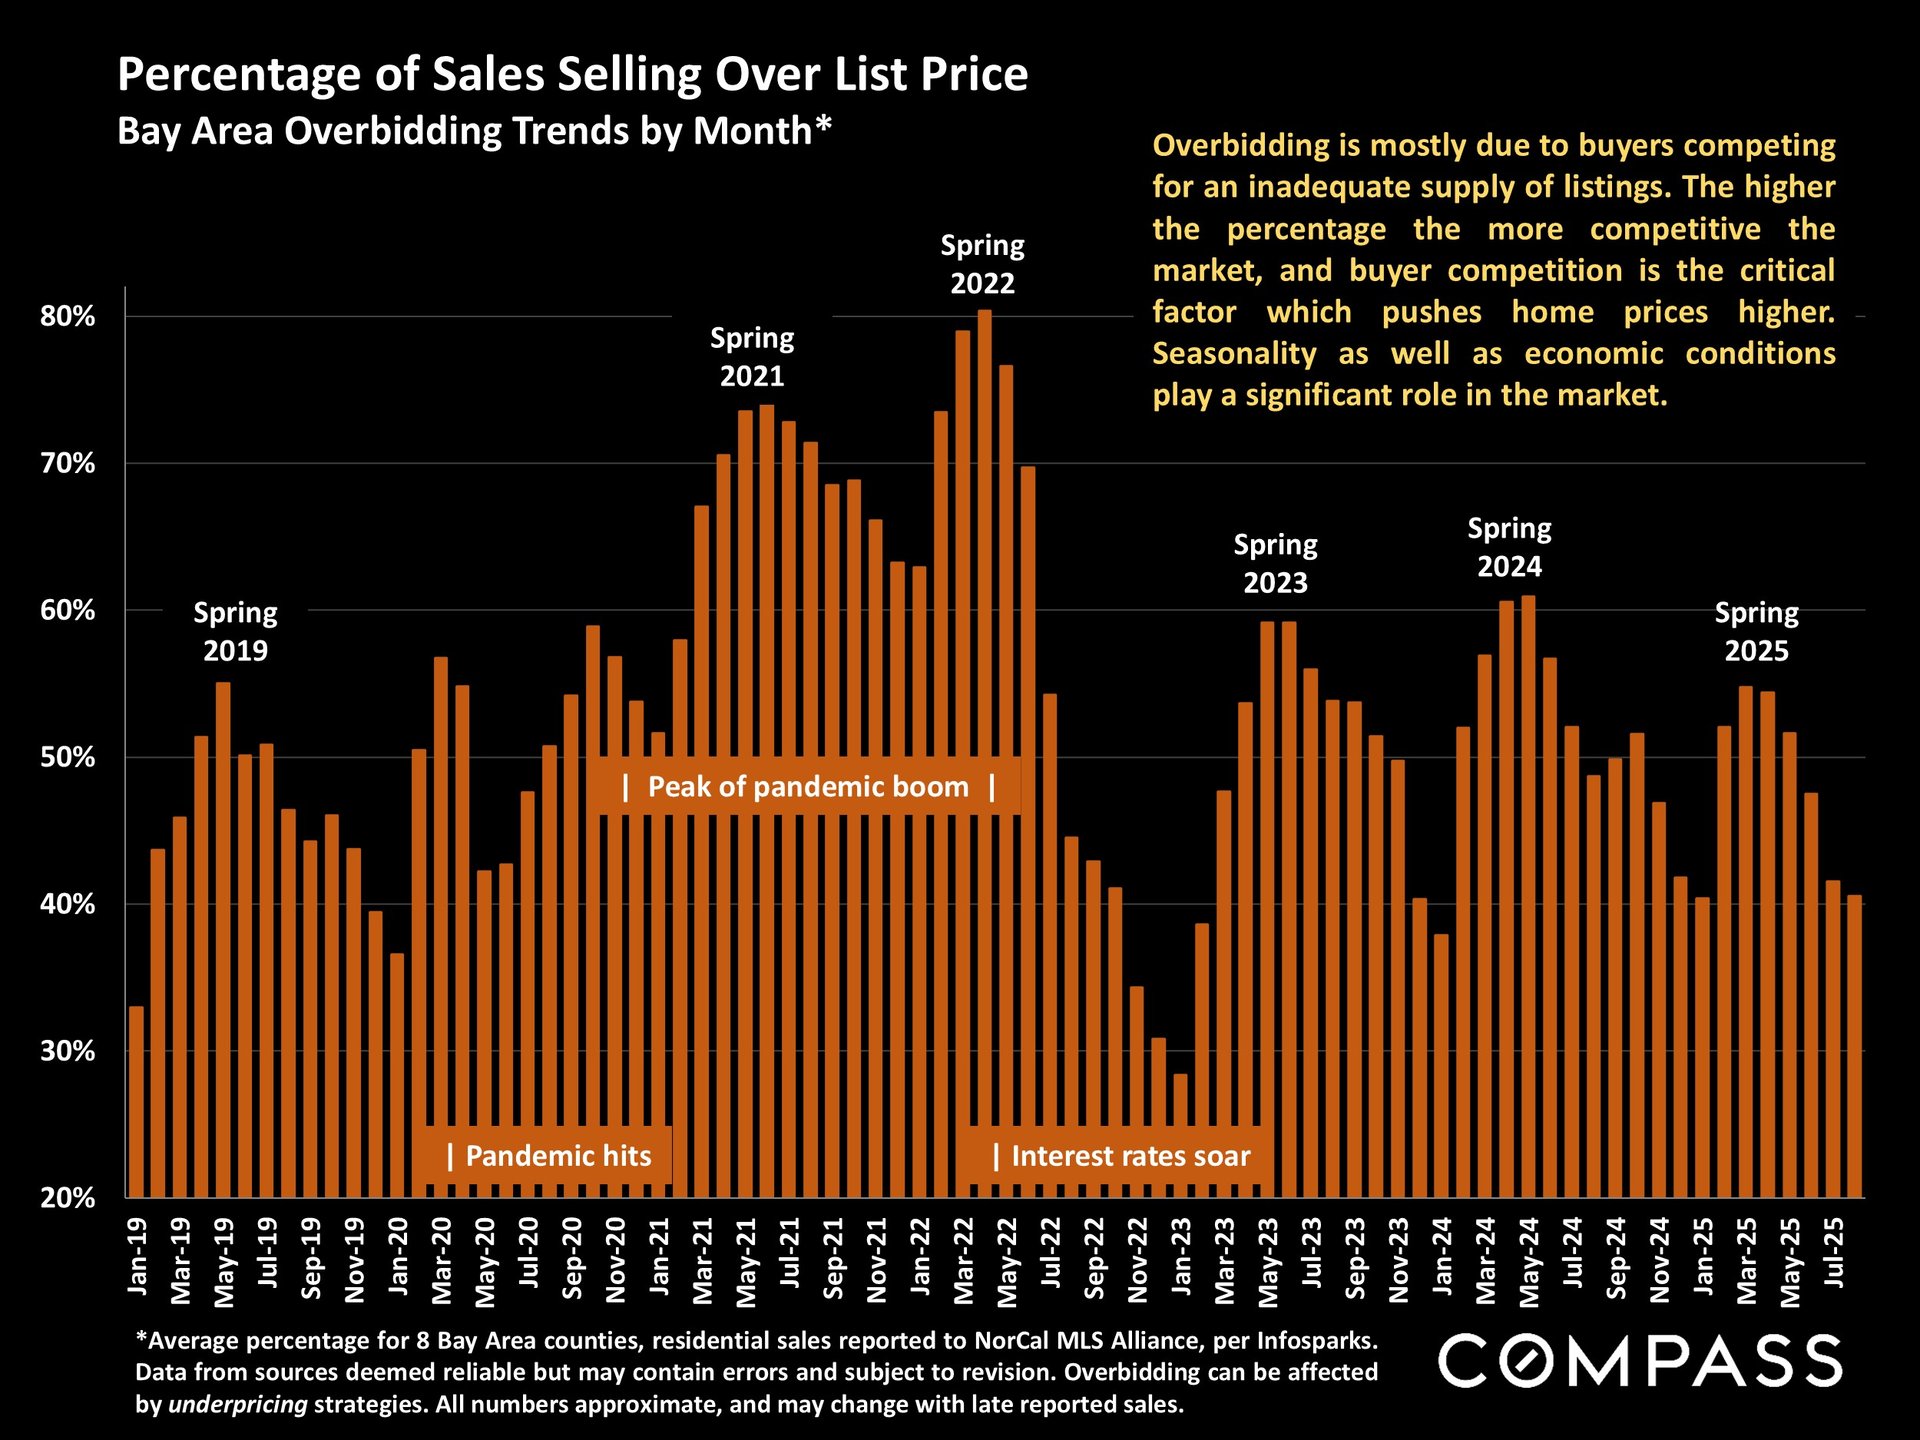
Bar chart of Bay Area home sales over list price, peaking near 80% in spring 2022 and declining afterward.
 
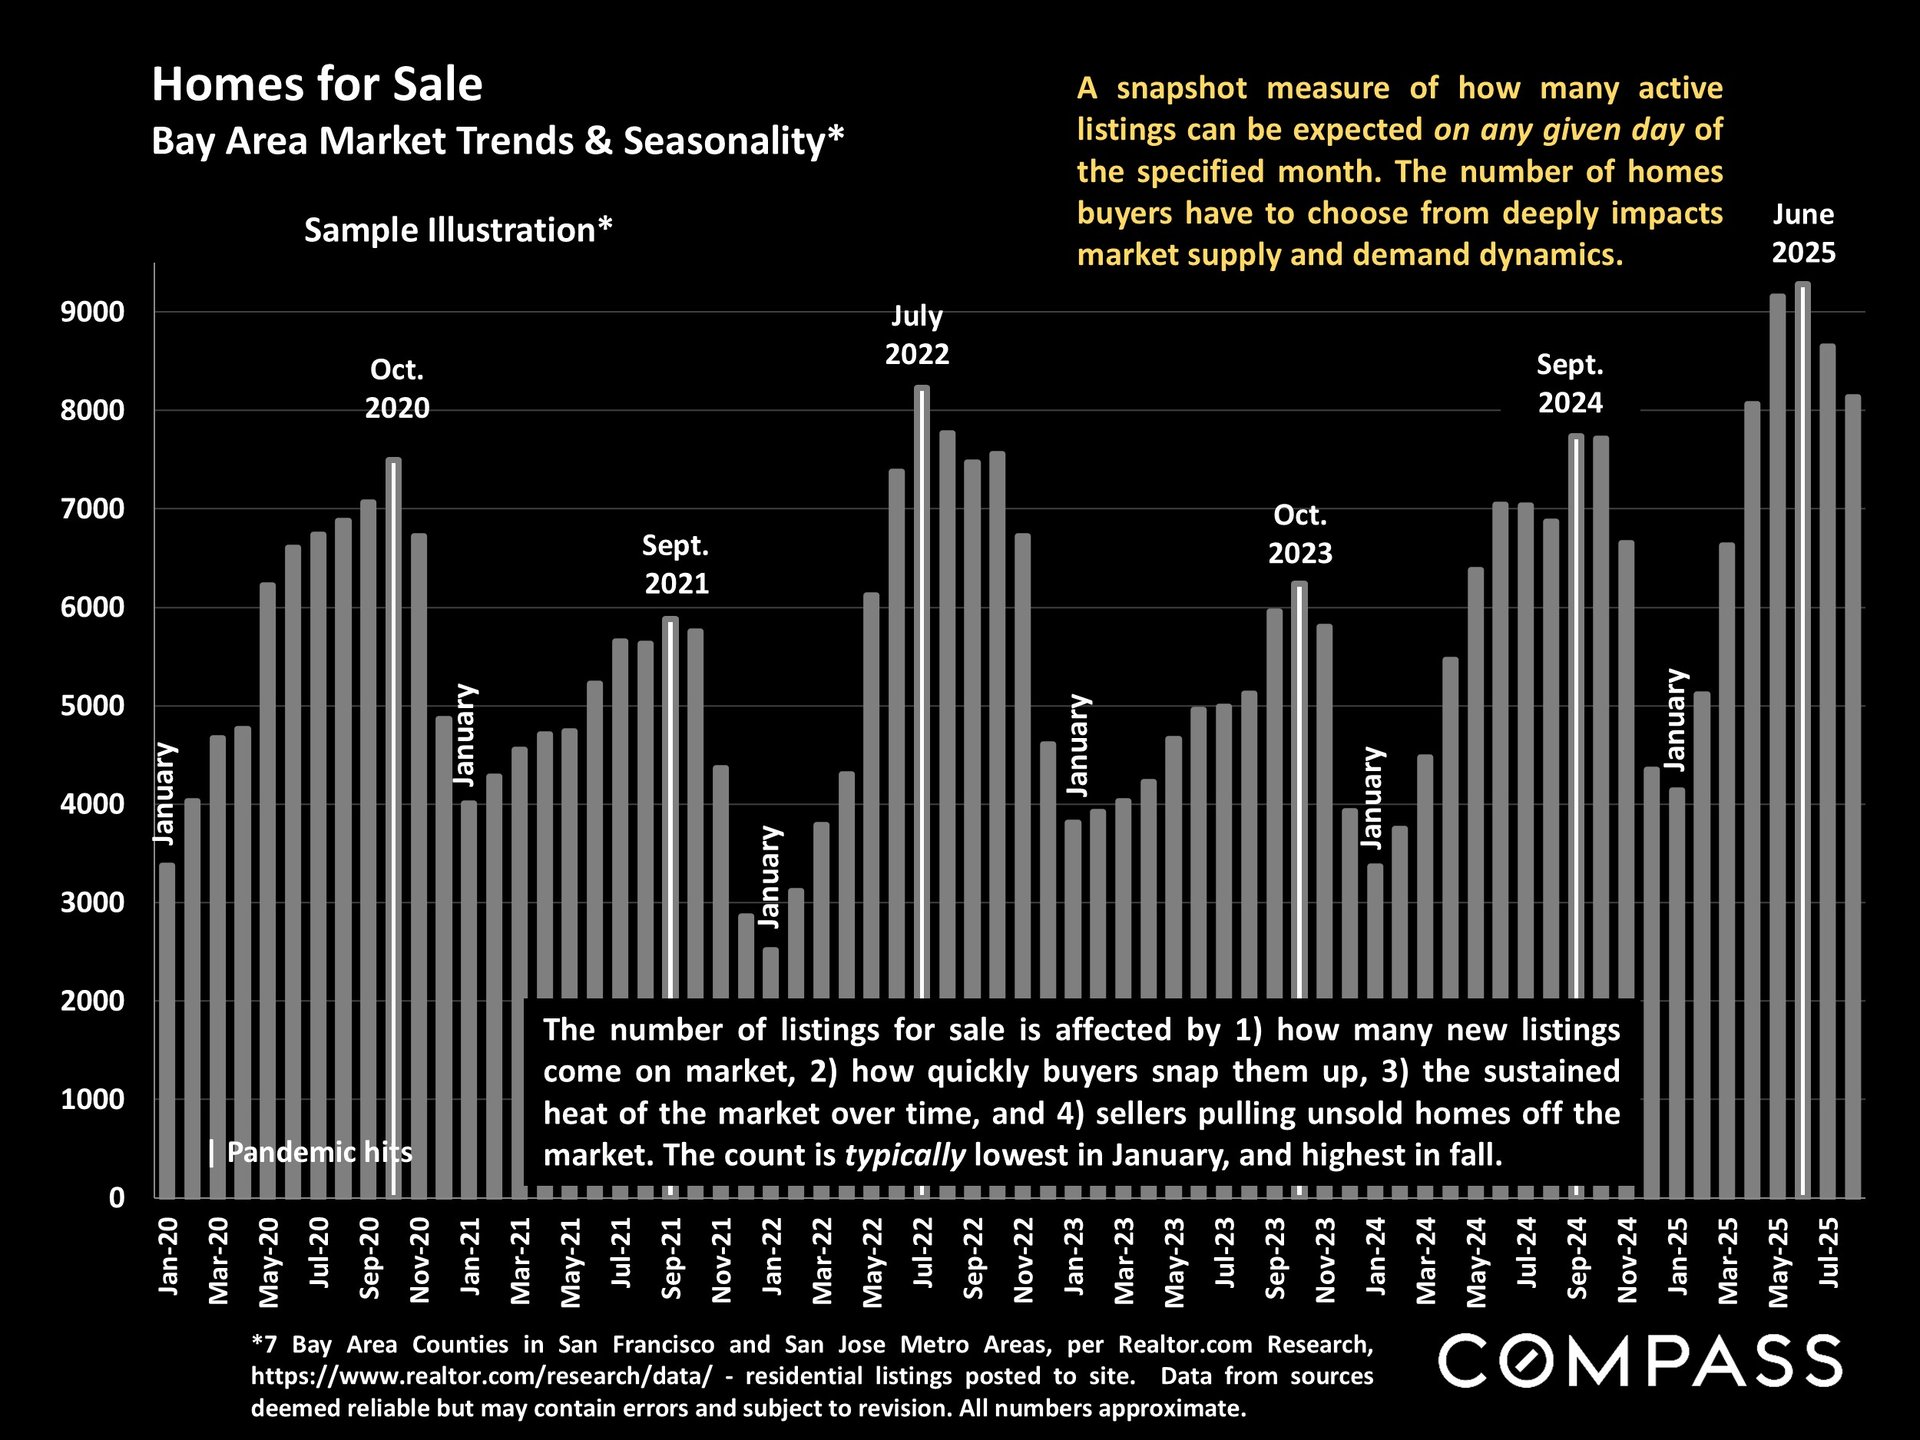
Bar chart of Bay Area homes for sale, showing monthly listing counts from 2020 to 2025 and seasonal peaks.
 
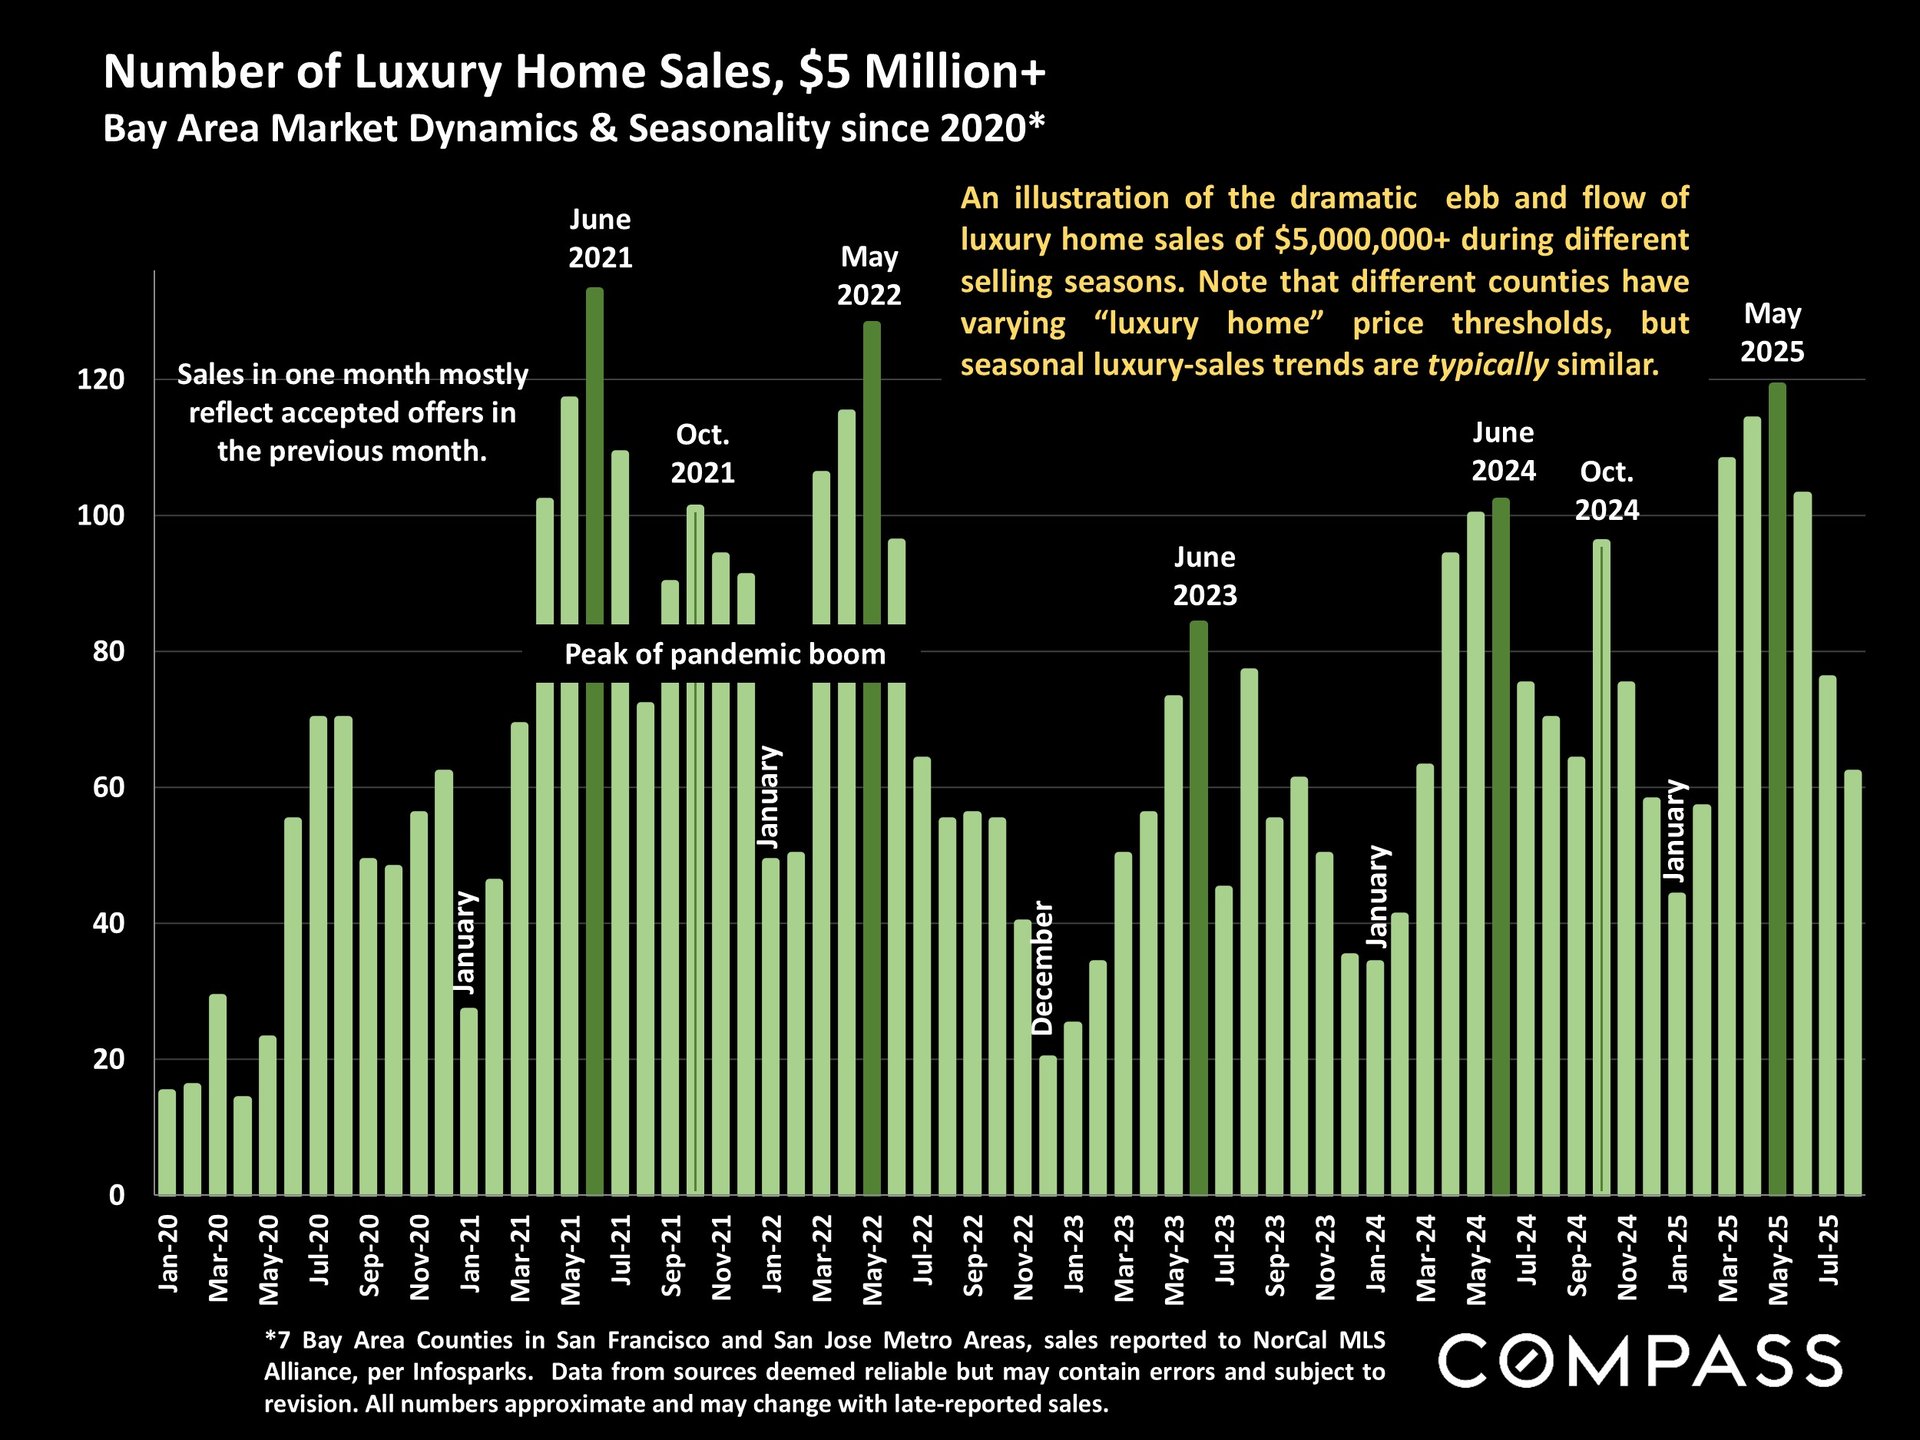
Bar chart of Bay Area luxury home sales from 2020 to 2025, showing seasonal peaks and the pandemic-era boom.

The Key To Your Dreams ®

As your trusted real estate advisors, we are committed to delivering the highest level of service and marketing, sharing our experience and expertise to help you achieve exceptional results.
Follow Us