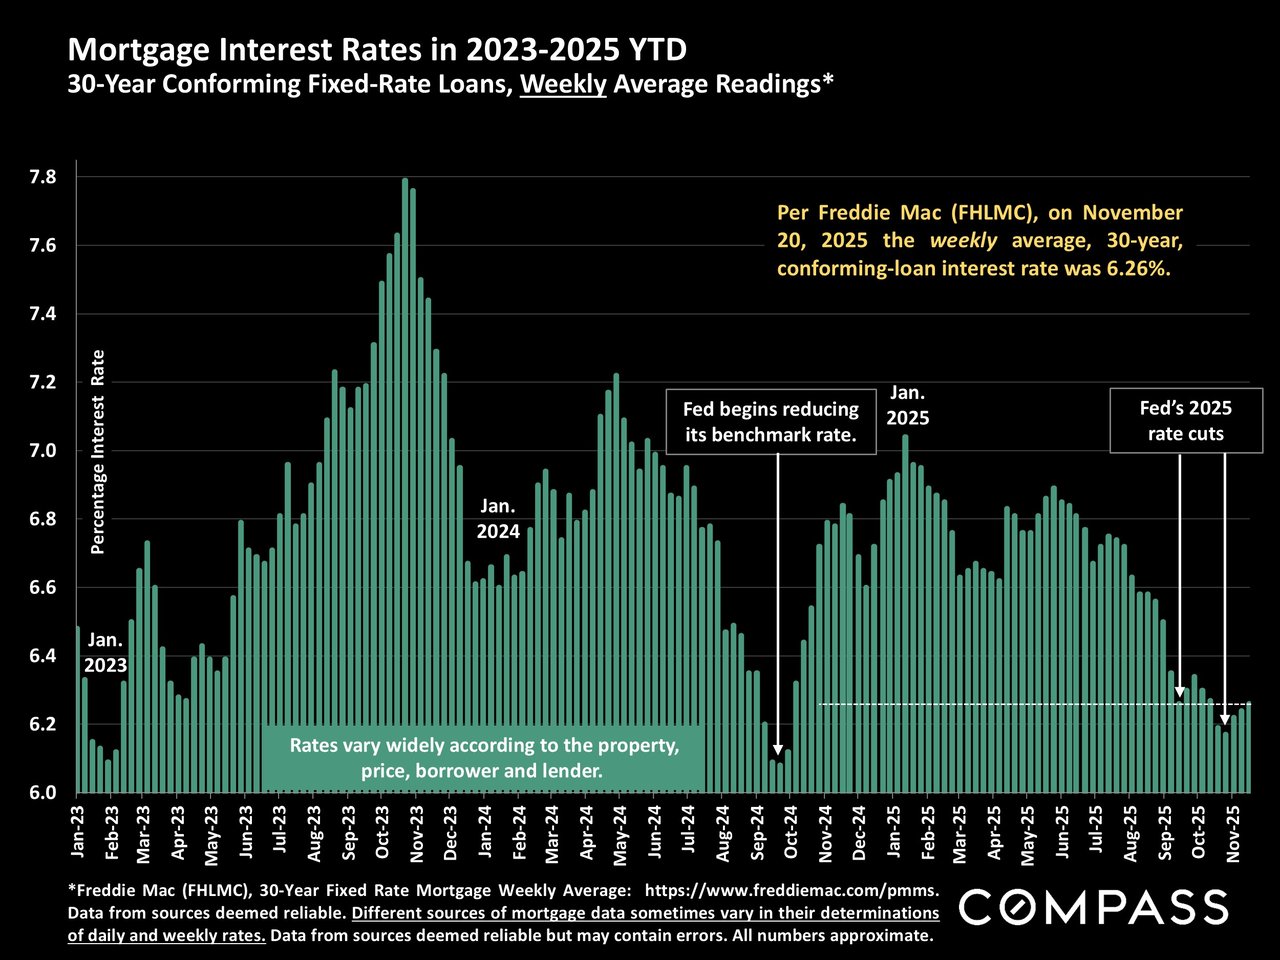
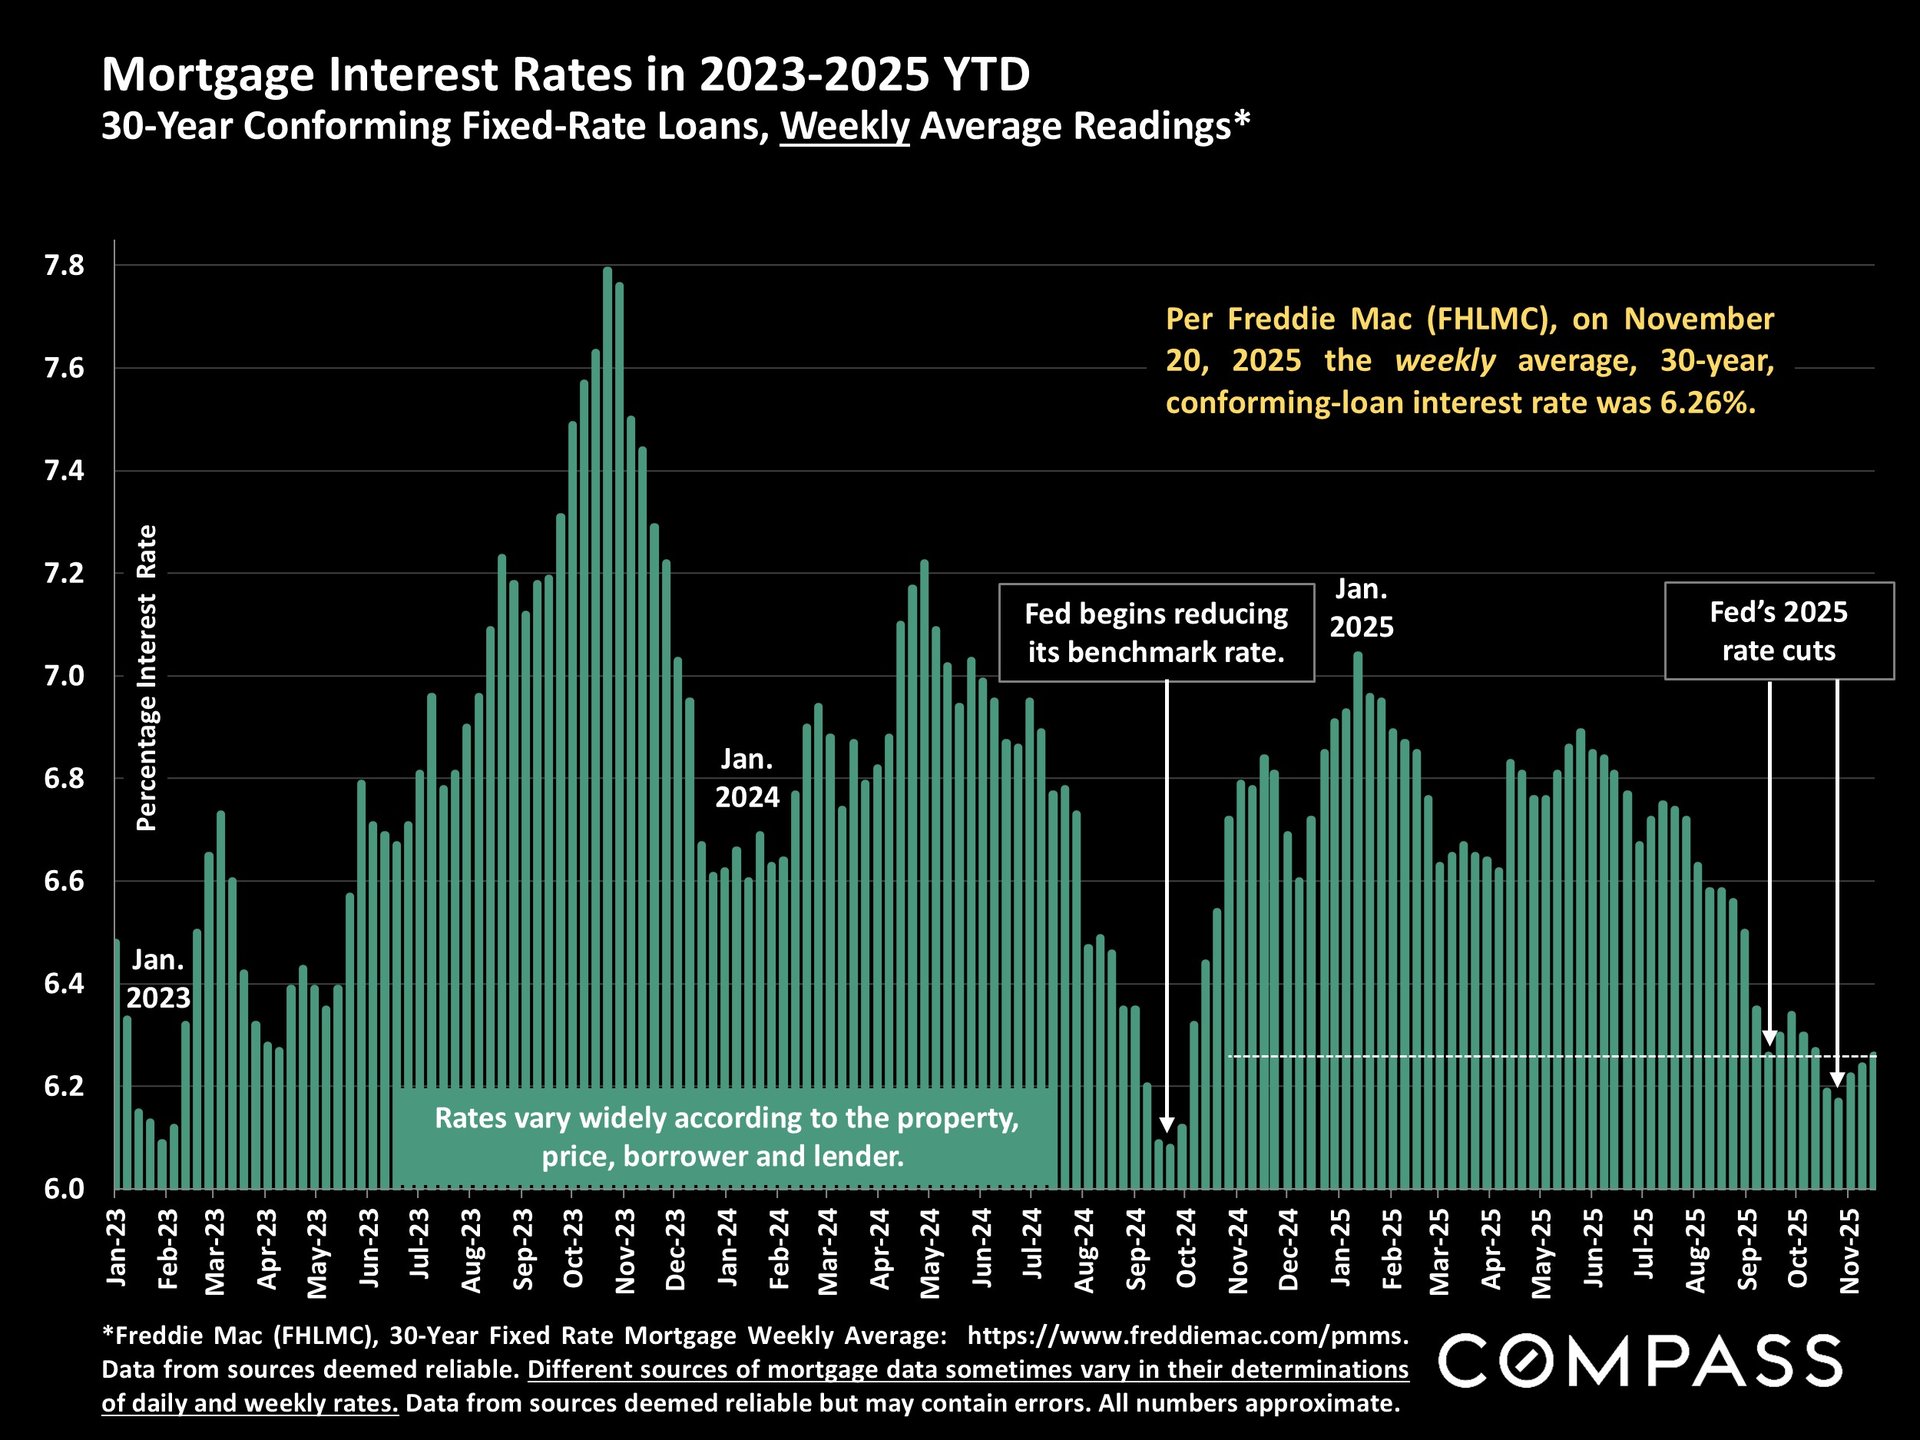
Weekly average 30-year fixed rate mortgage: Ticking up slightly in recent weeks.
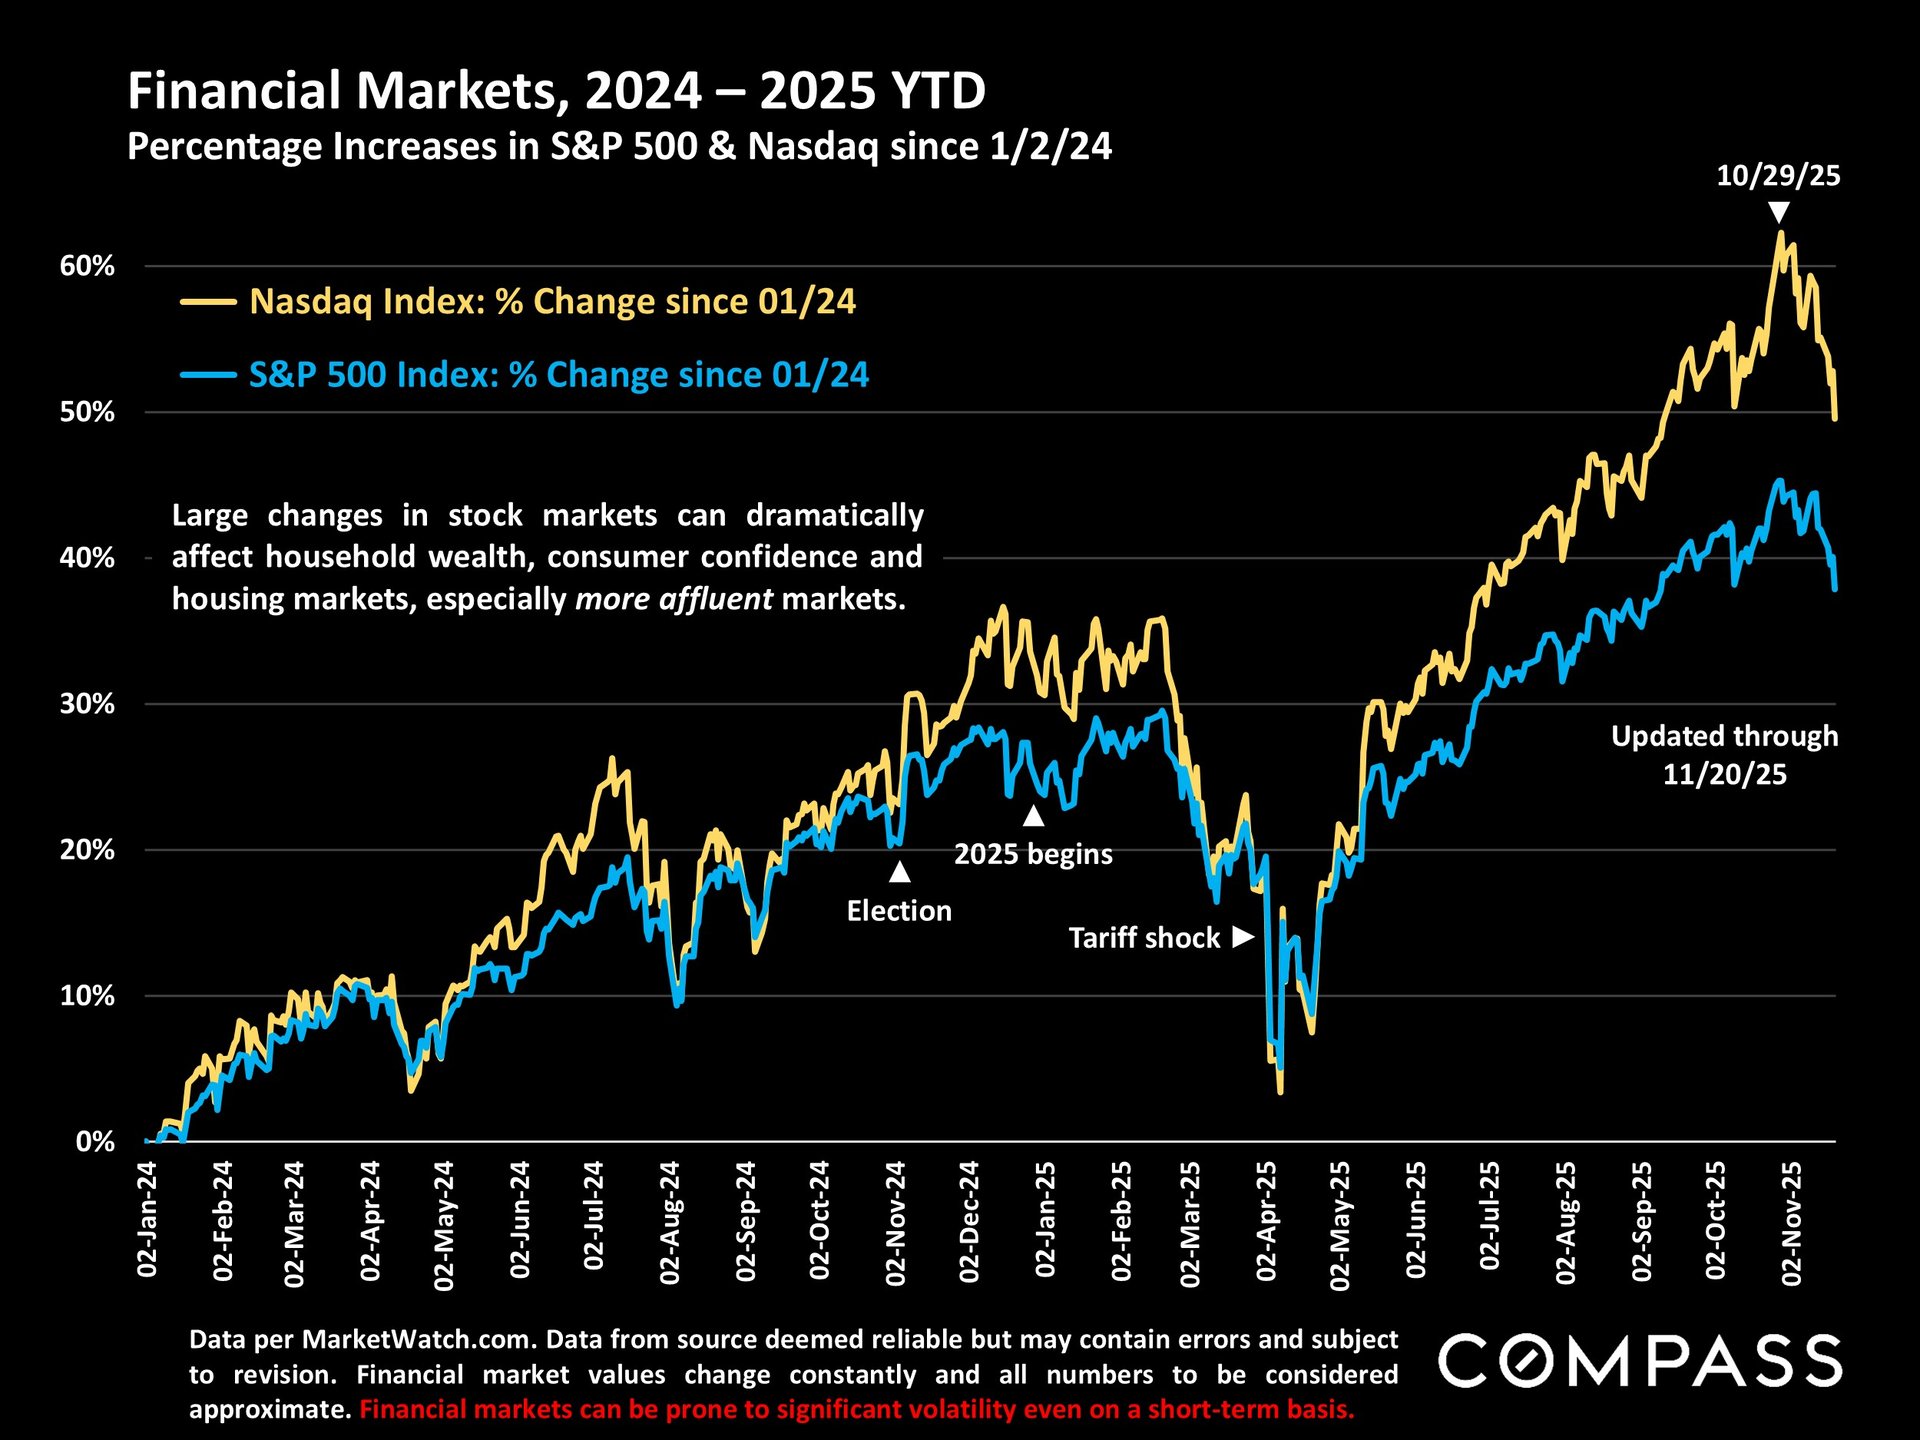
Stock markets have had a few volatile weeks due to AI bubble concerns, over which there is vehement disagreement among analysts and industry pundits. As of mid-day today (EST), the S&P and Nasdaq are up about 1% from yesterday.
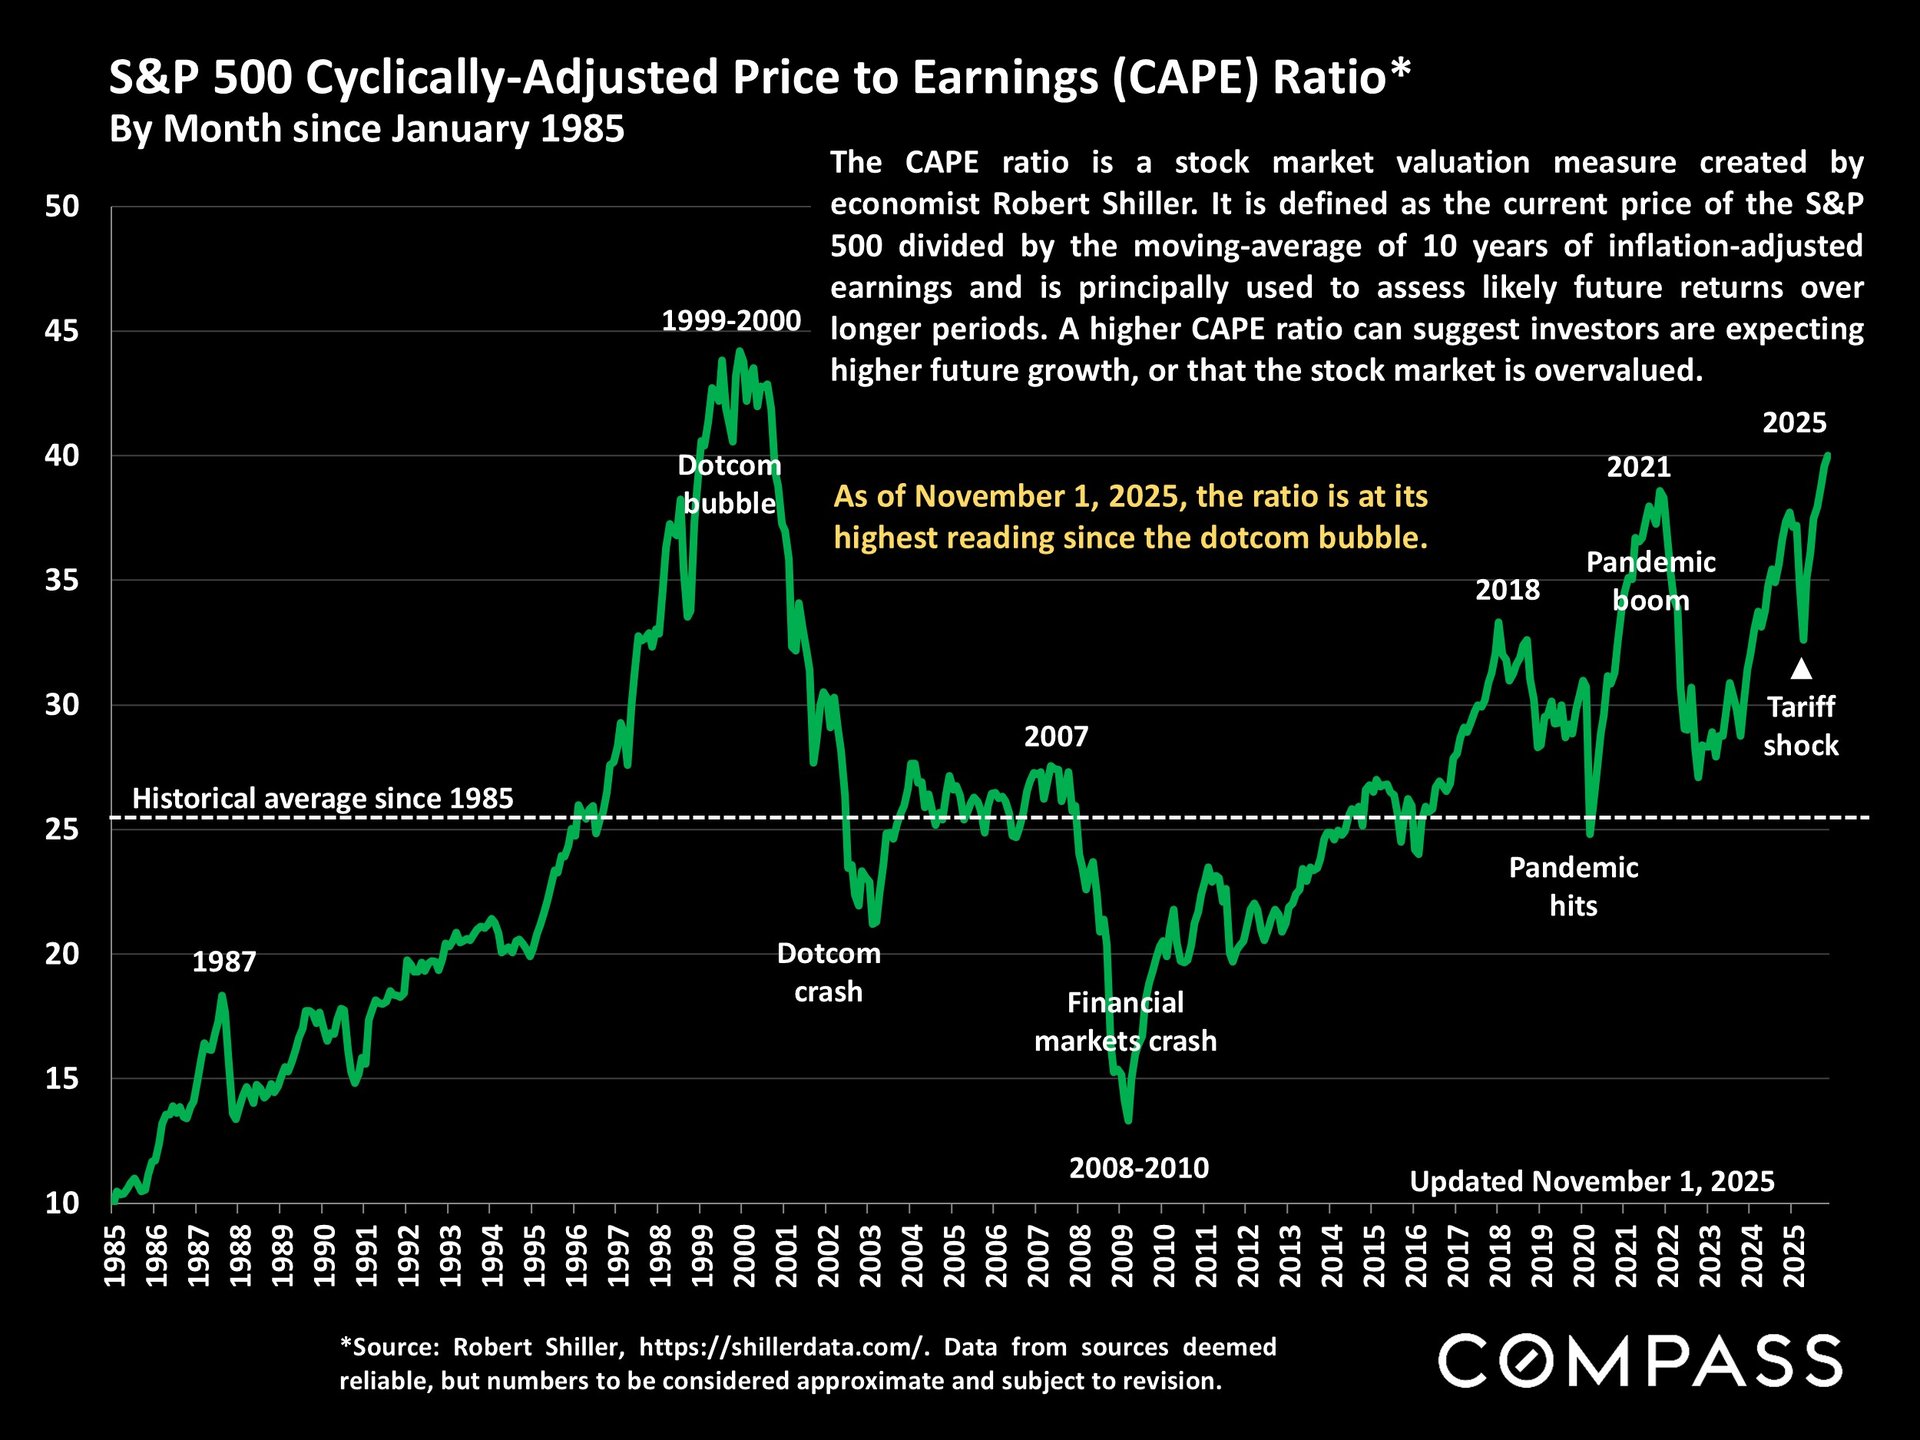
In my last update, I mentioned the "cyclically-adjusted price to earnings (CAPE) ratio" as one respected method of evaluating stock markets. I found the historical data to create the below chart, updated as of 11/1/25.
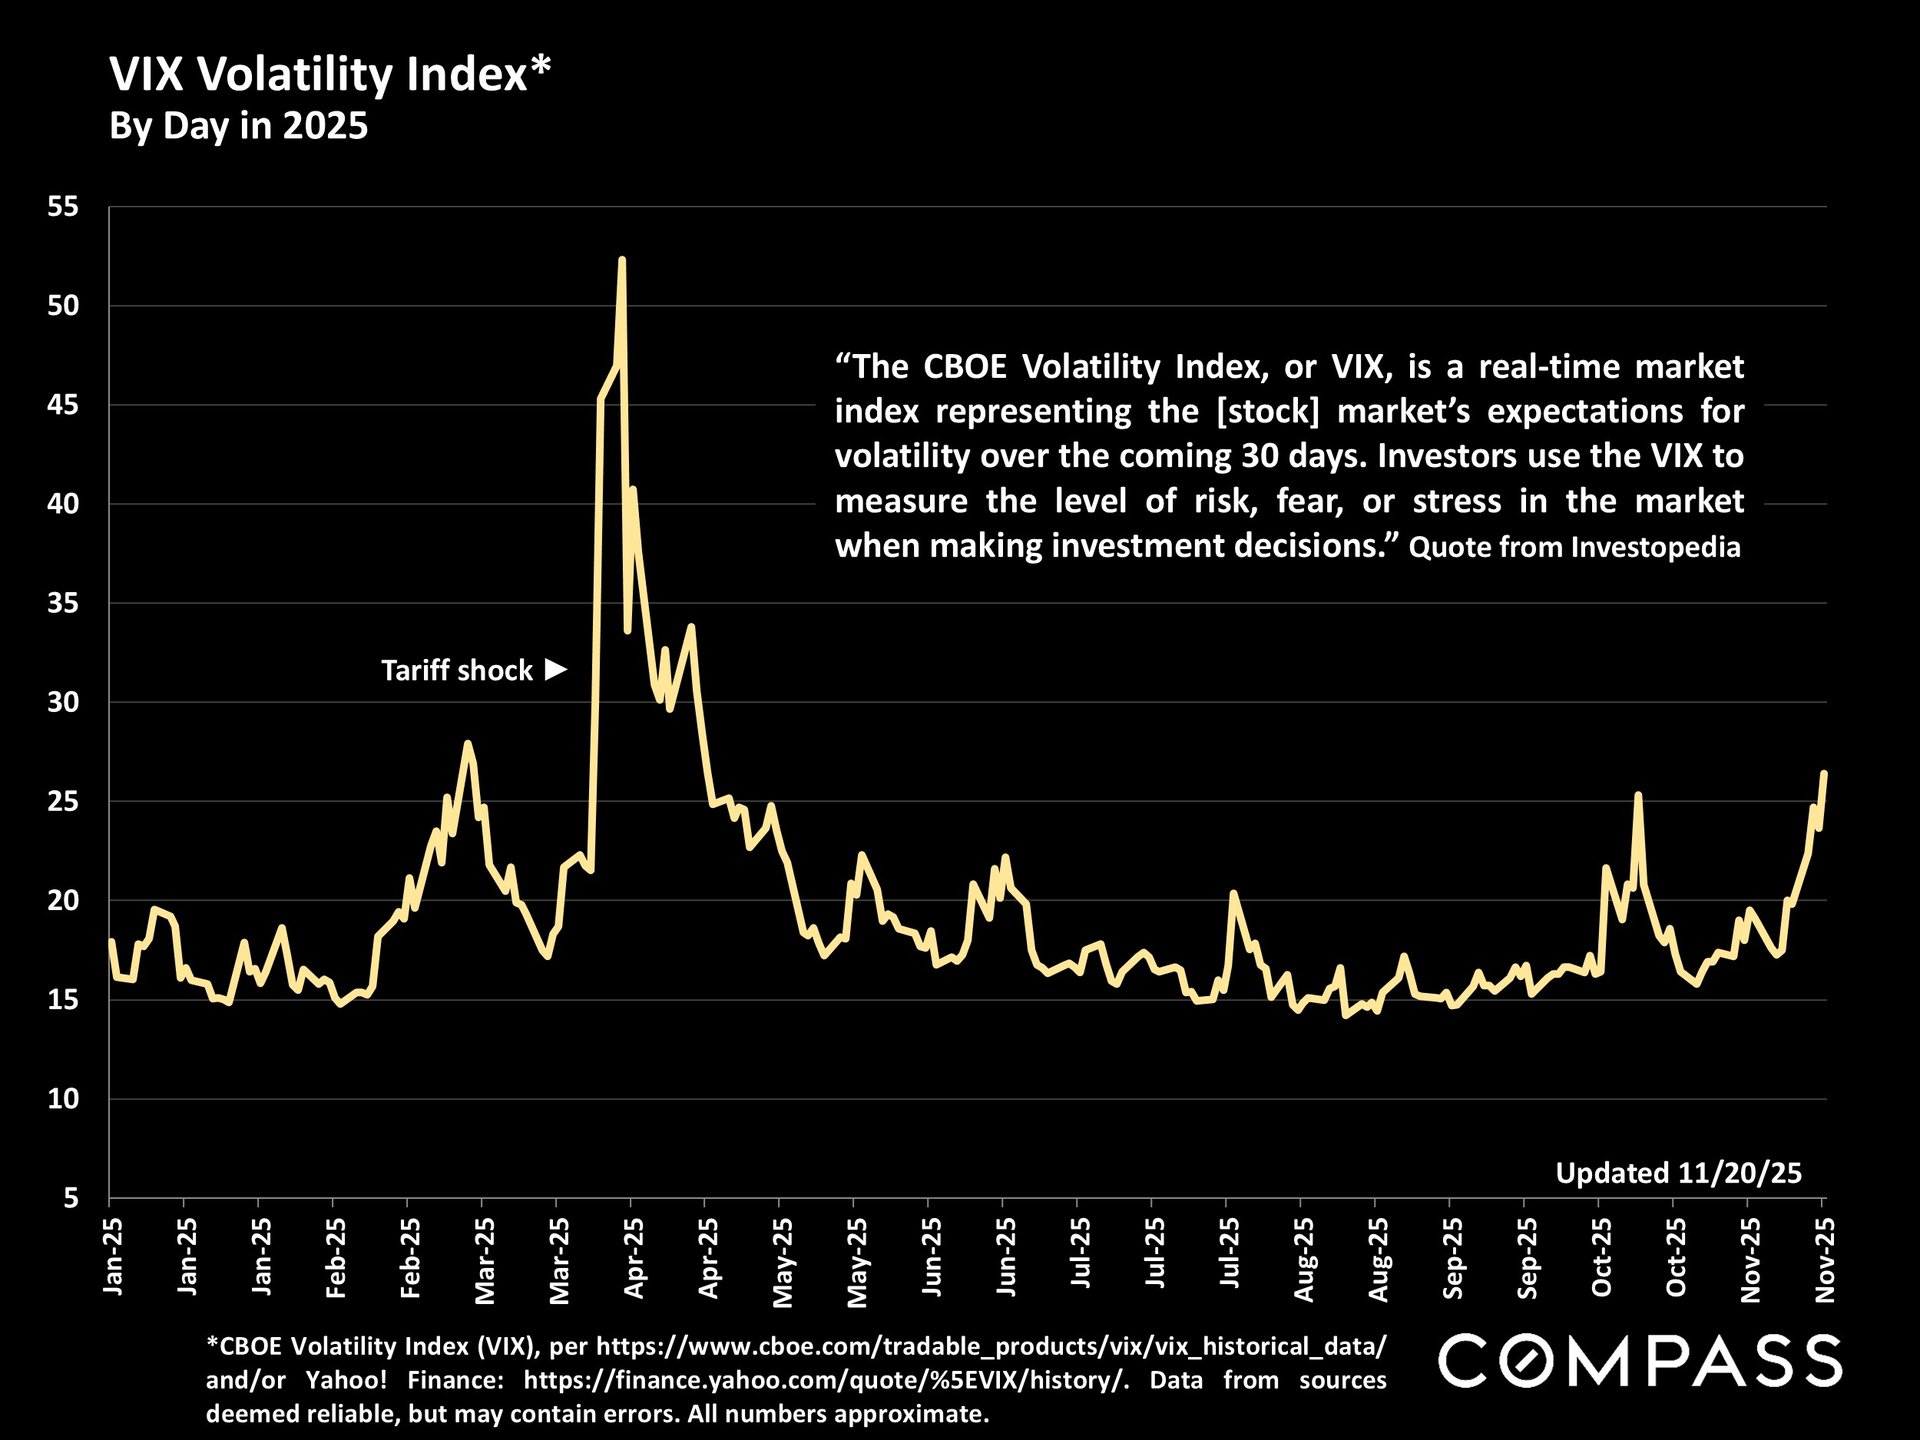
The VIX Volatility Index has been rapidly climbing since the month began.
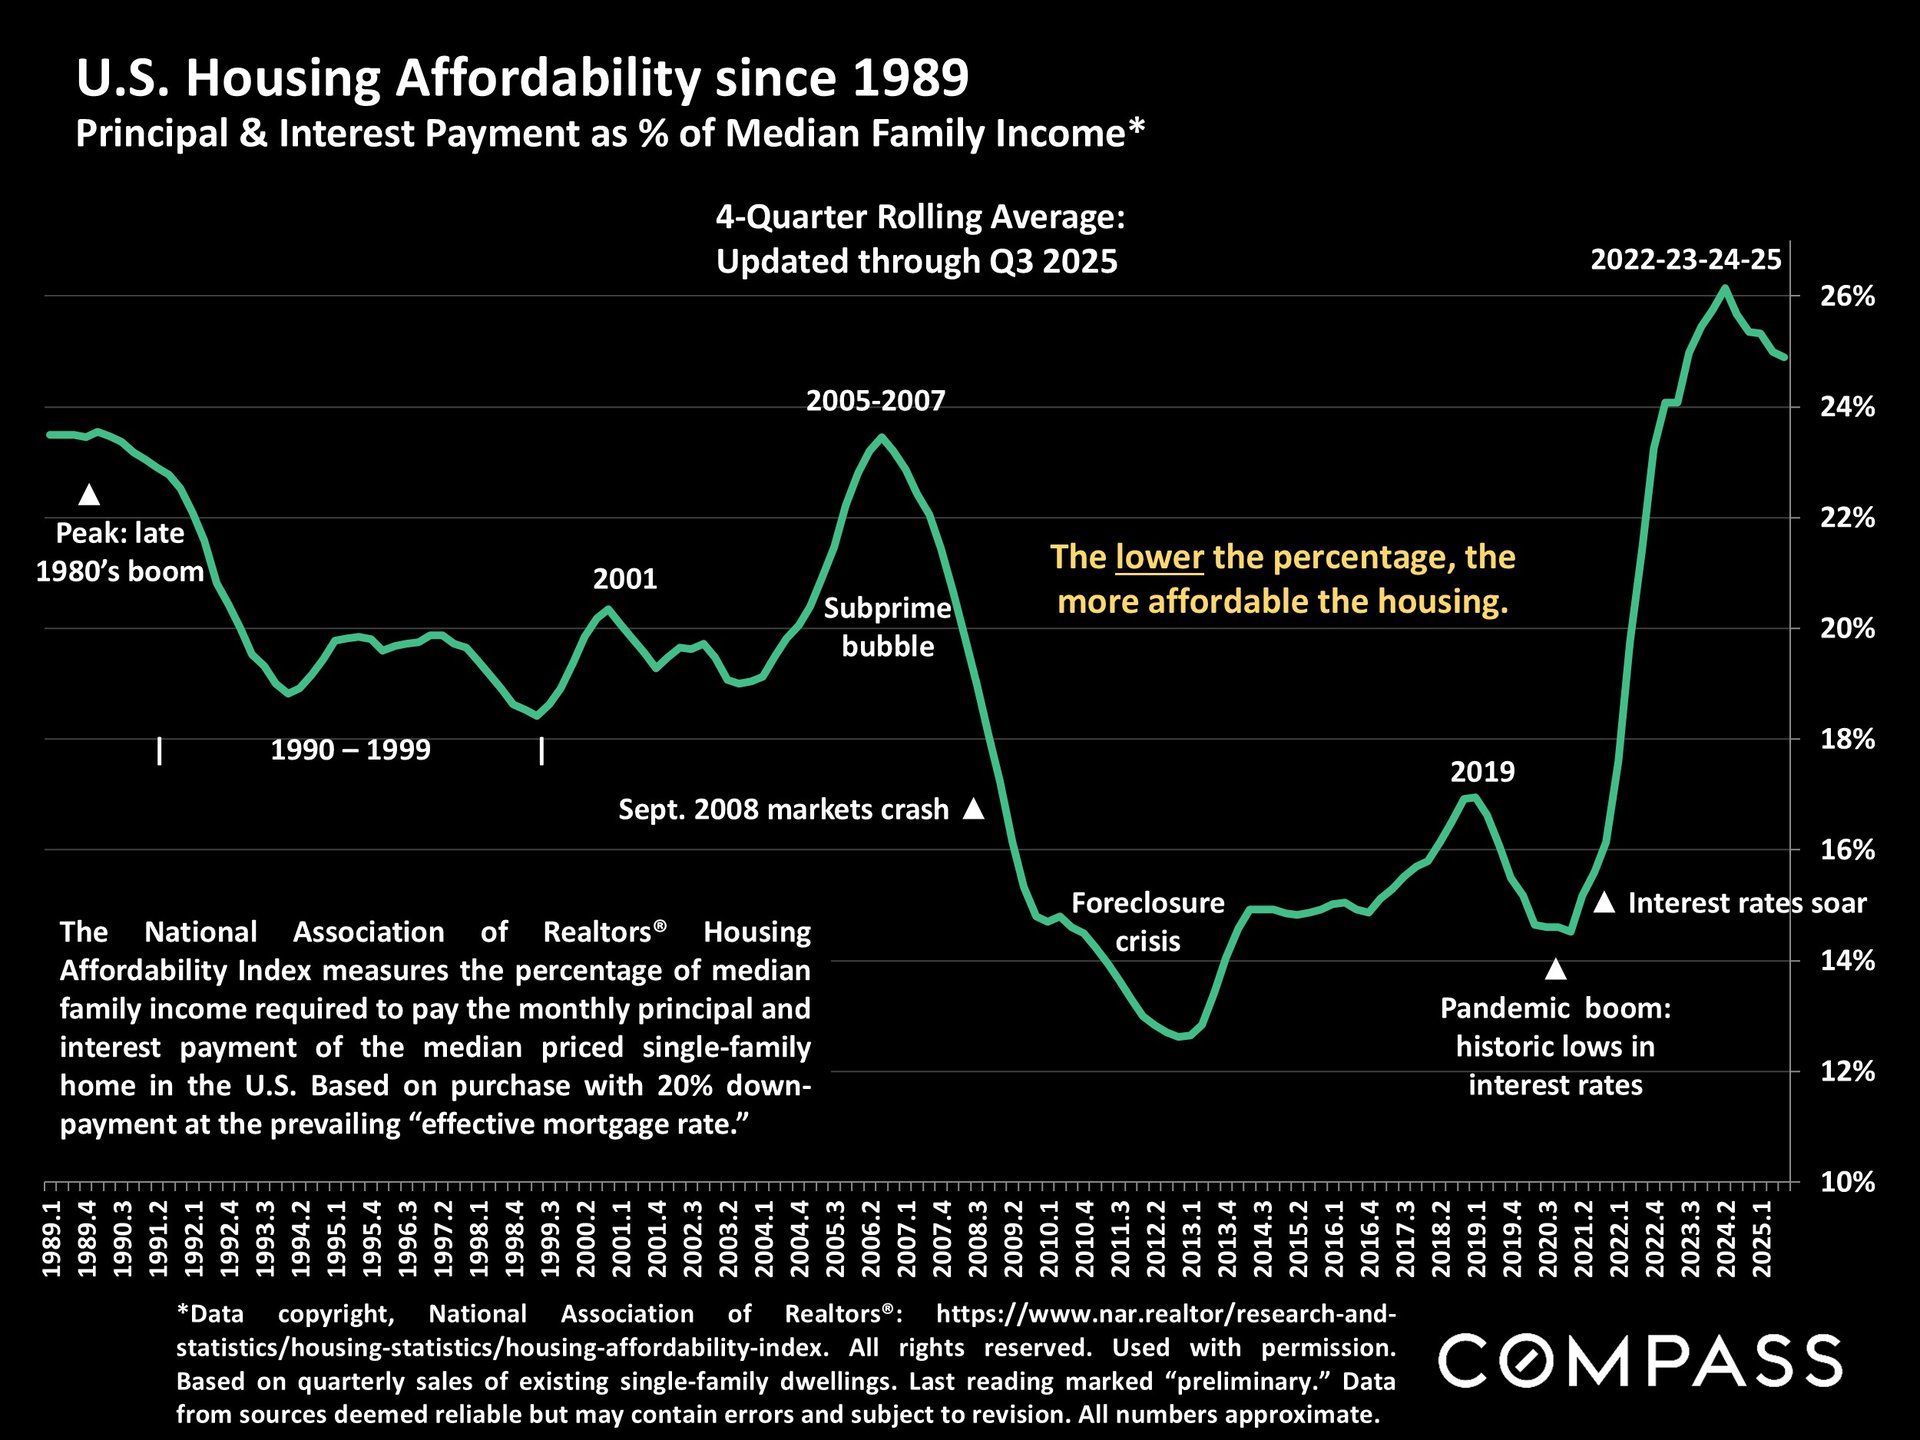
Housing affordability, per NAR calculations for Q3. Higher readings signify lower affordability. With the recent decline in interest rates, affordability has improved.
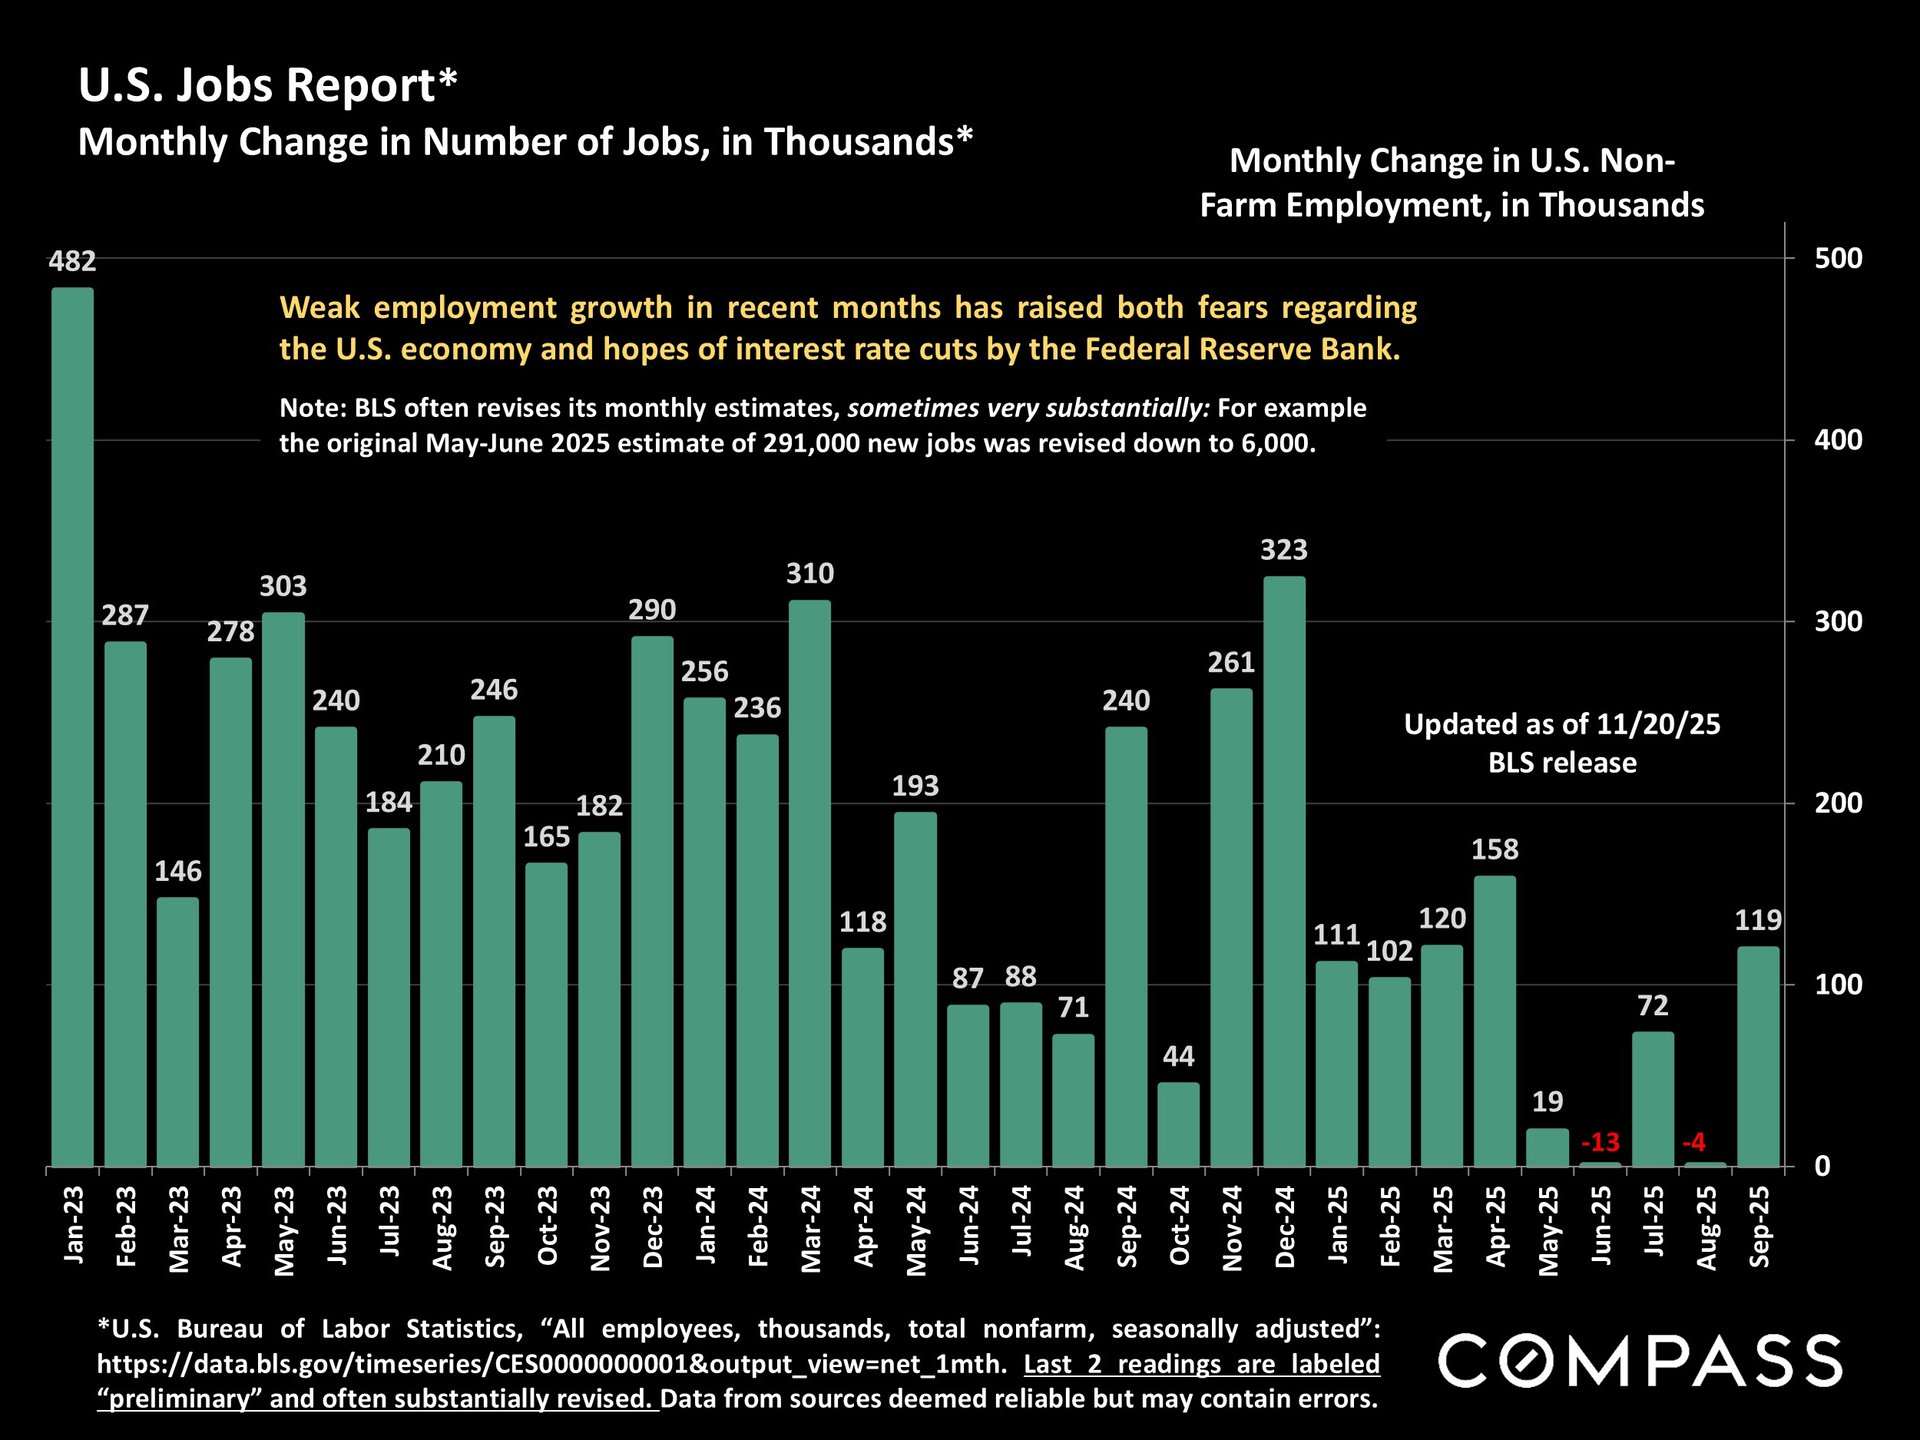
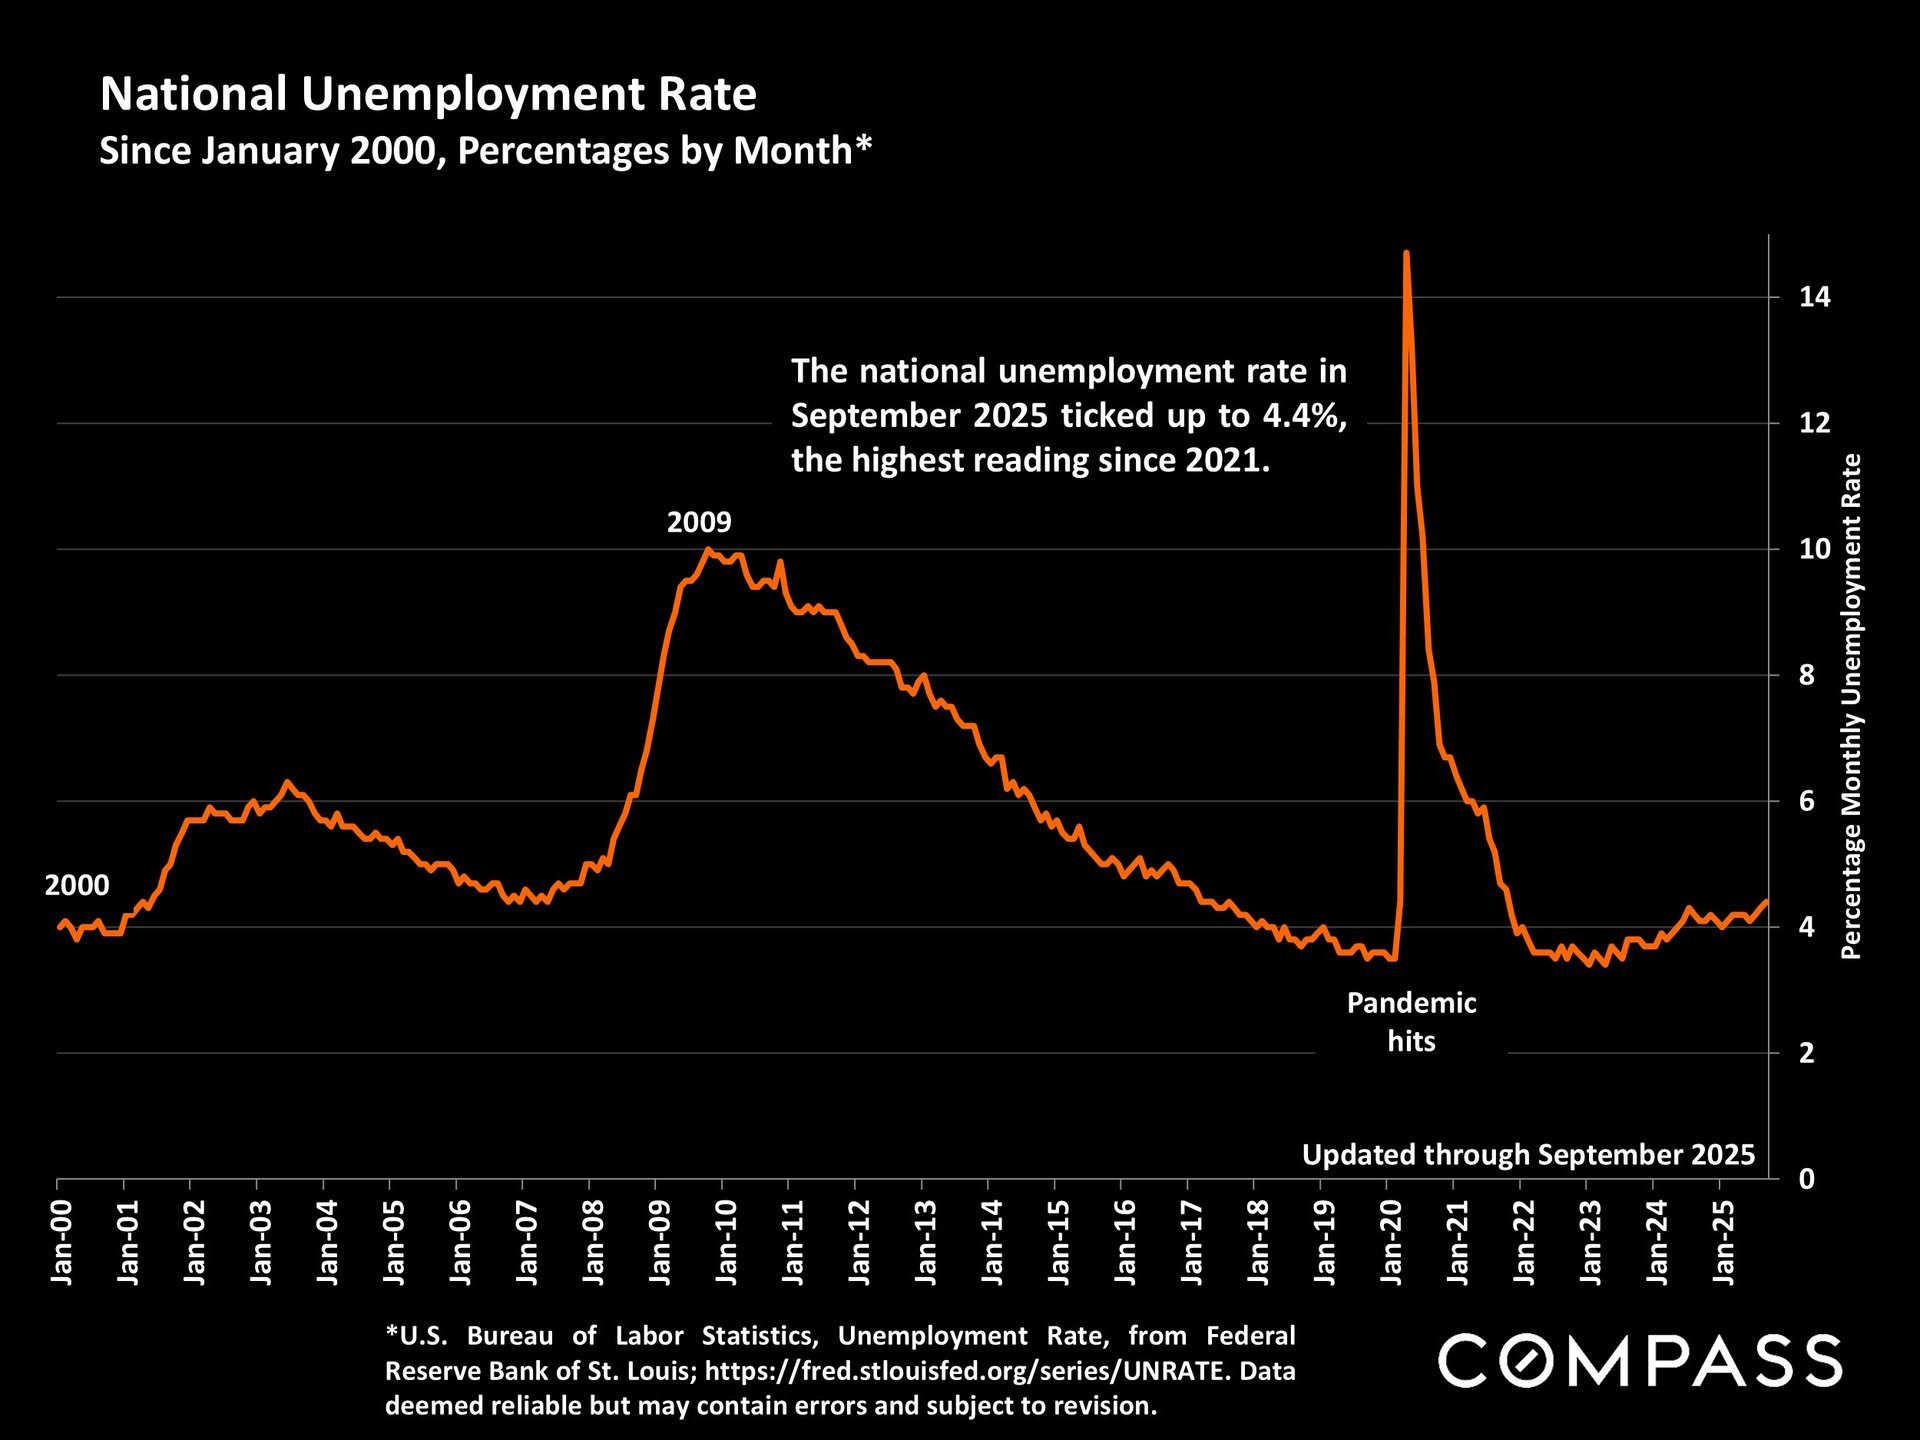
A new jobs report through September was just released. As mentioned in the past, the latest numbers are often revised so substantially in subsequent months that I don't know why economists, investors and analysts consider them reliable.
Unemployment has been ticking up. It is now up to its highest reading since 2021, though not high by long-term standards.
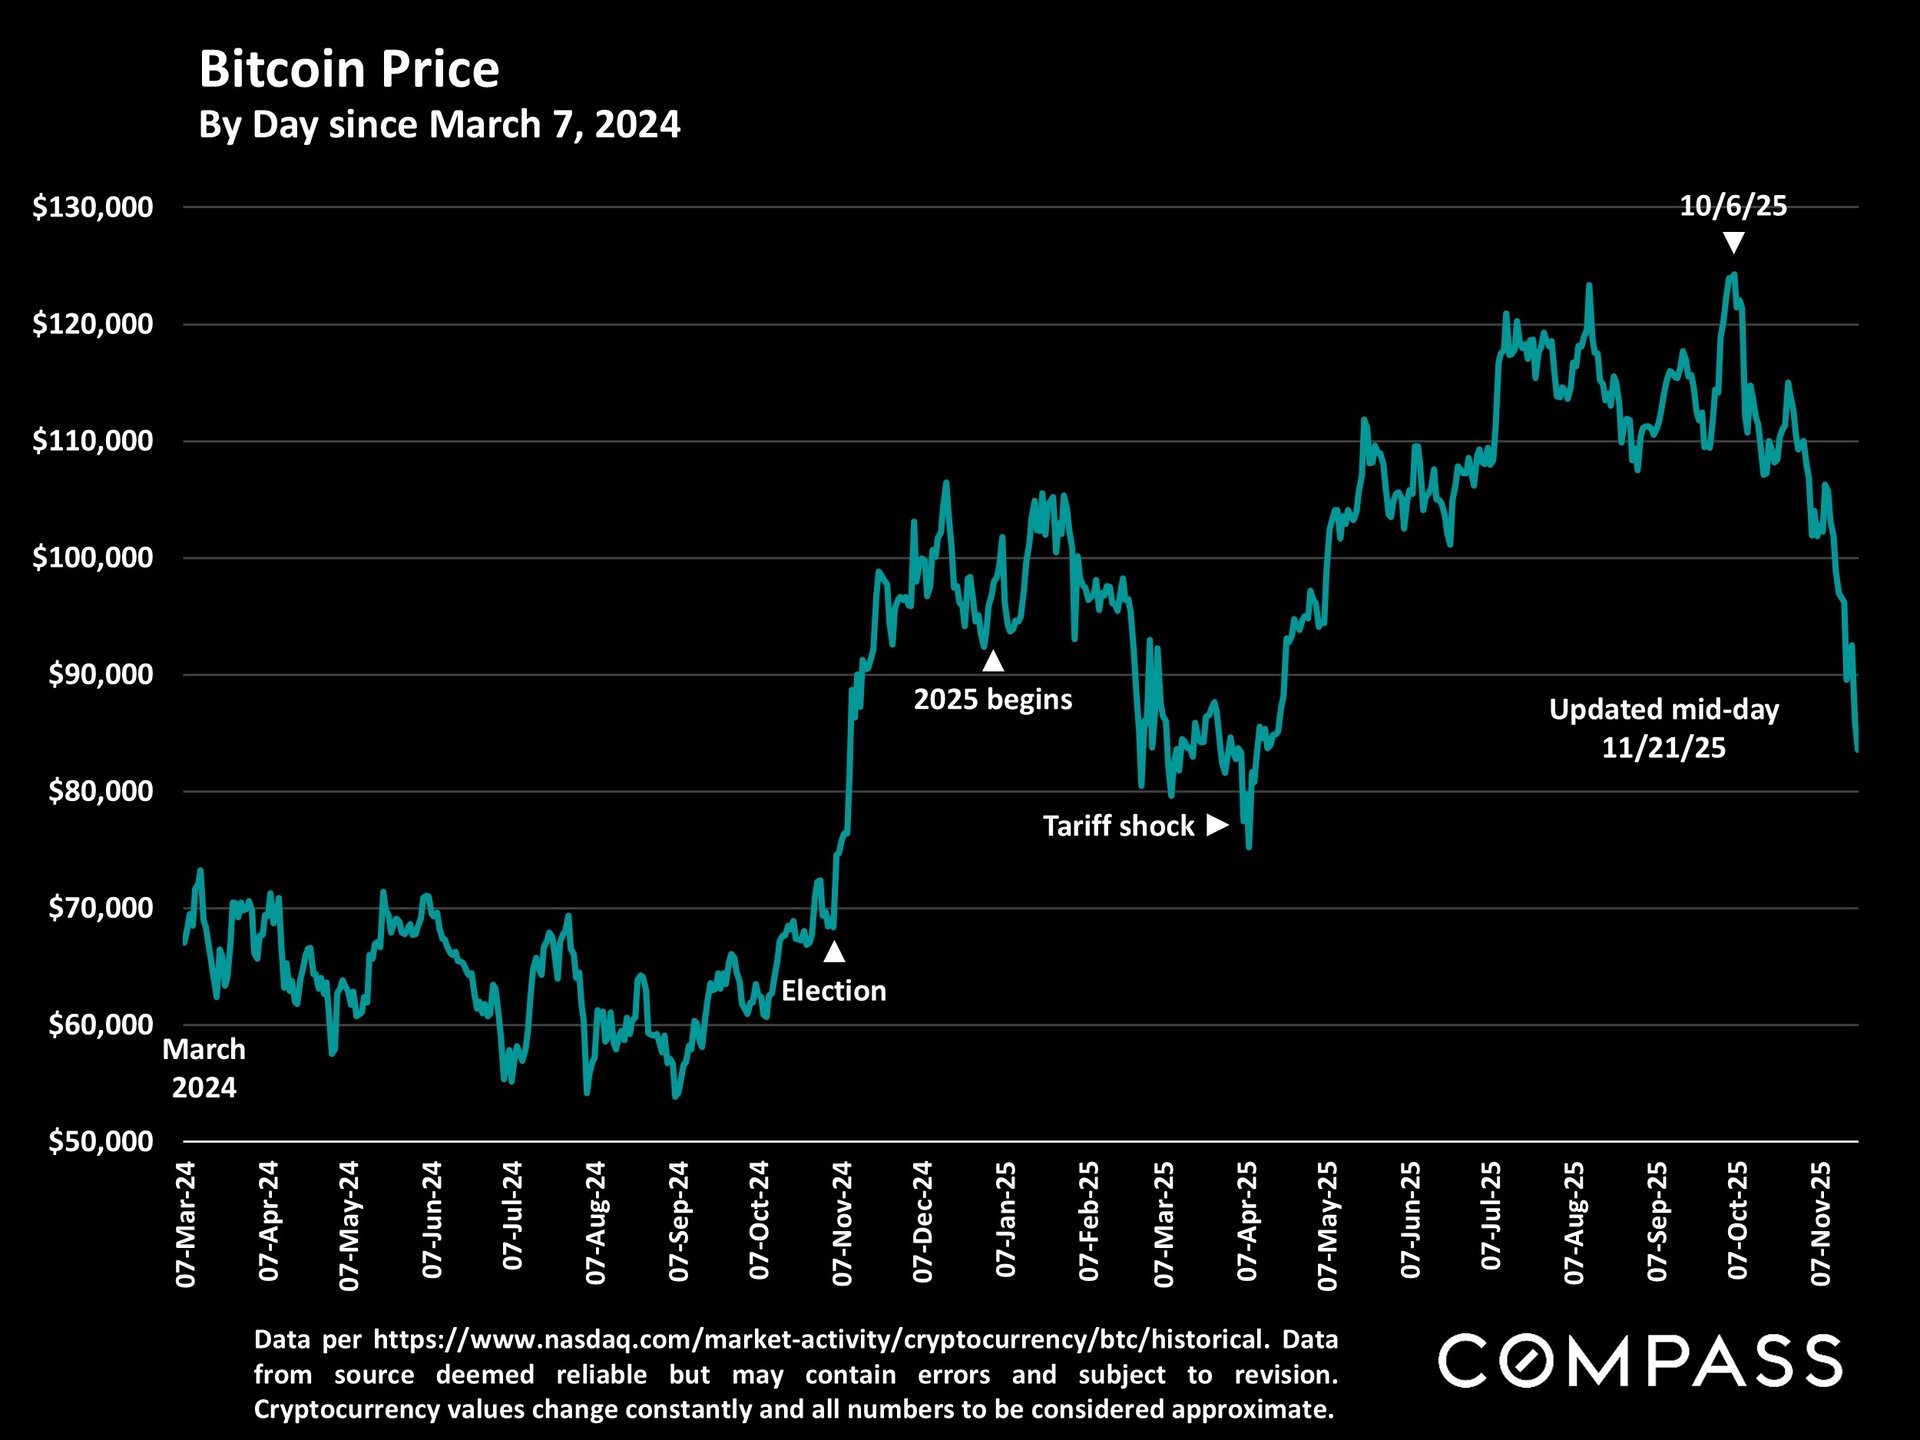
The price of bitcoin has been crashing (but has often seen extreme volatility over the years).
Consumer Sentiment as measured by the University of Michigan Consumer Surveys remains near a 45-year low, due to substantial concerns about prices, personal finances, inflation, and, increasingly, job security.
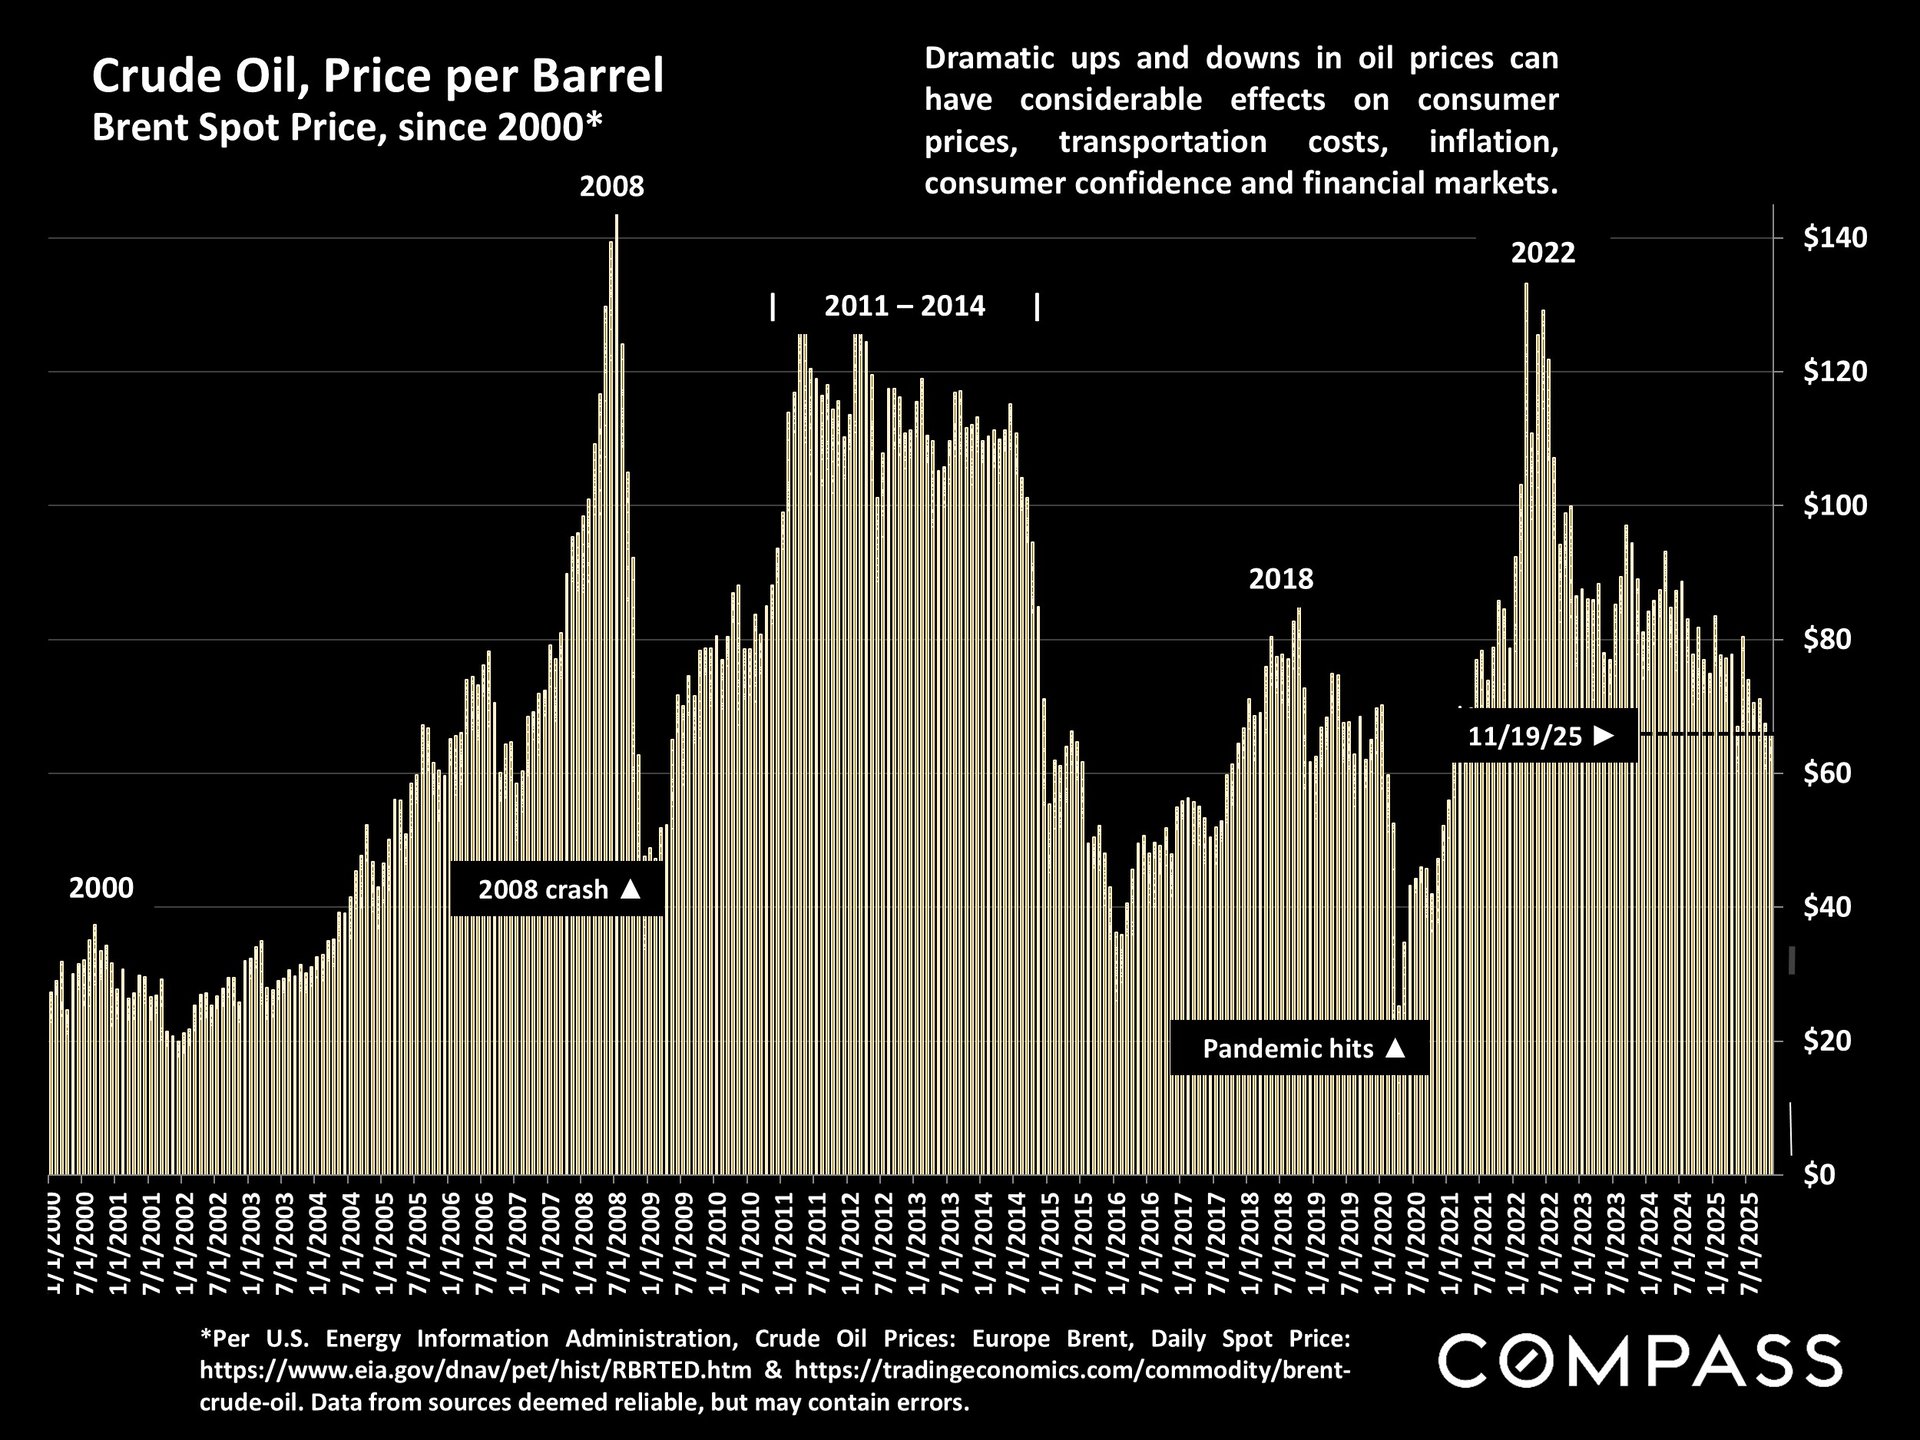
The price of oil: With concerns regarding the slowdown of the global economy, it has been declining - moving in a contrary direction to inflation - of which the latest reading was 3%.