Marin County Real Estate Market Begins to Bounce Back
Market activity begins to tick up after severe shelter-in-place plunge.
May 2020 Crisis Update
------------
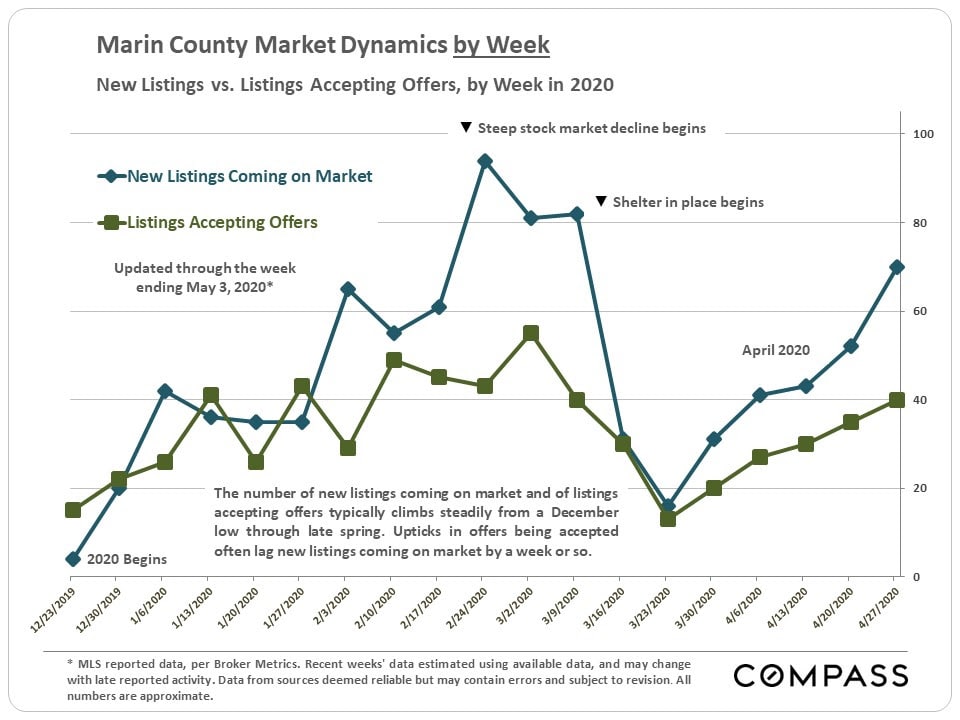
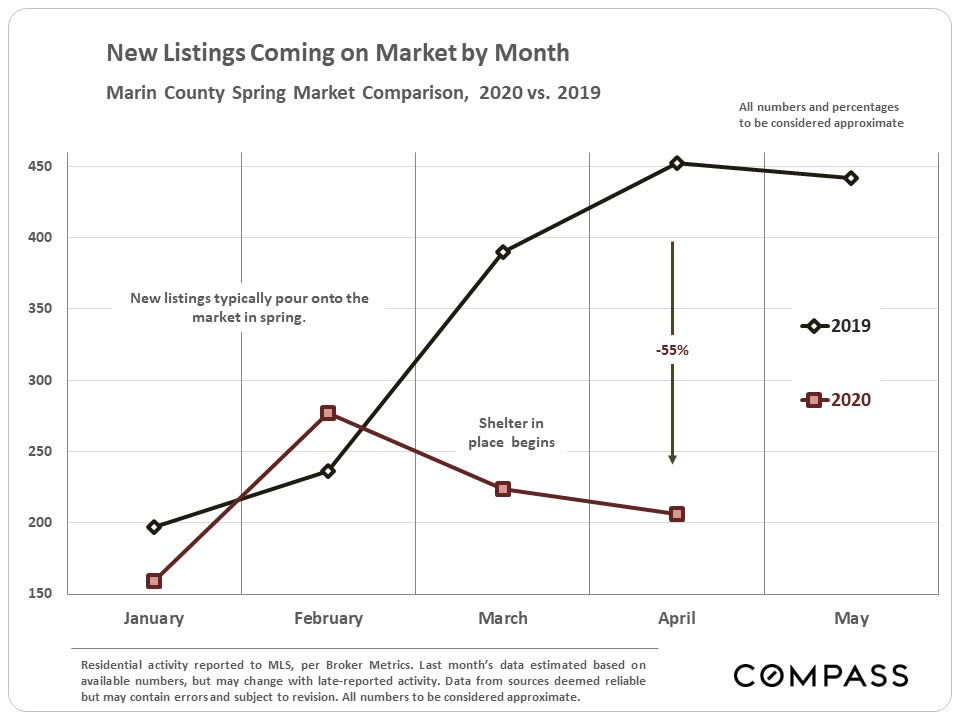
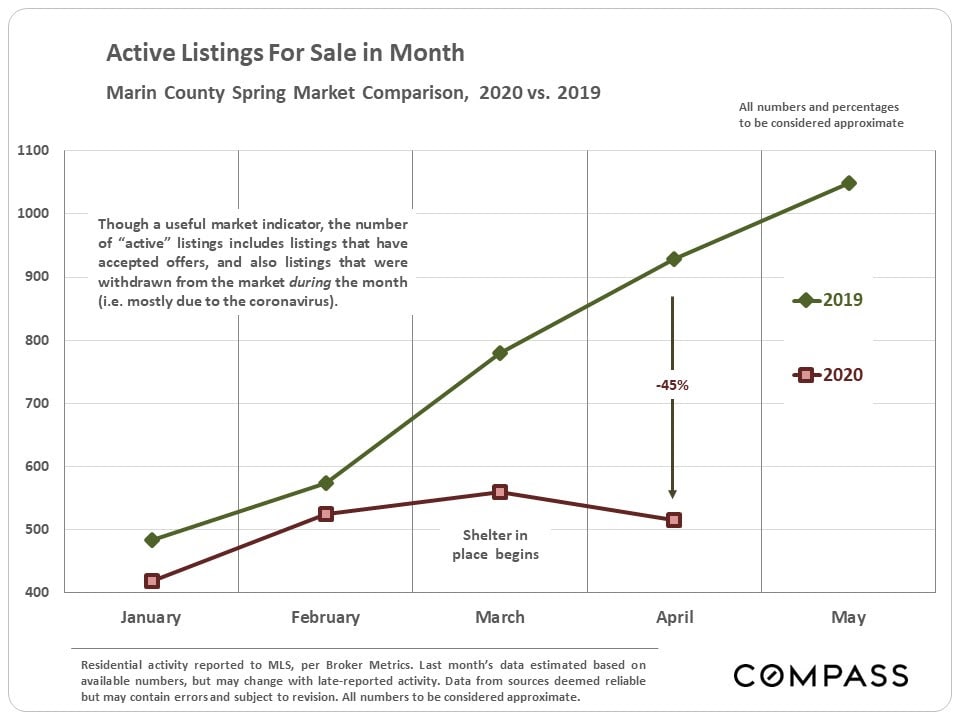
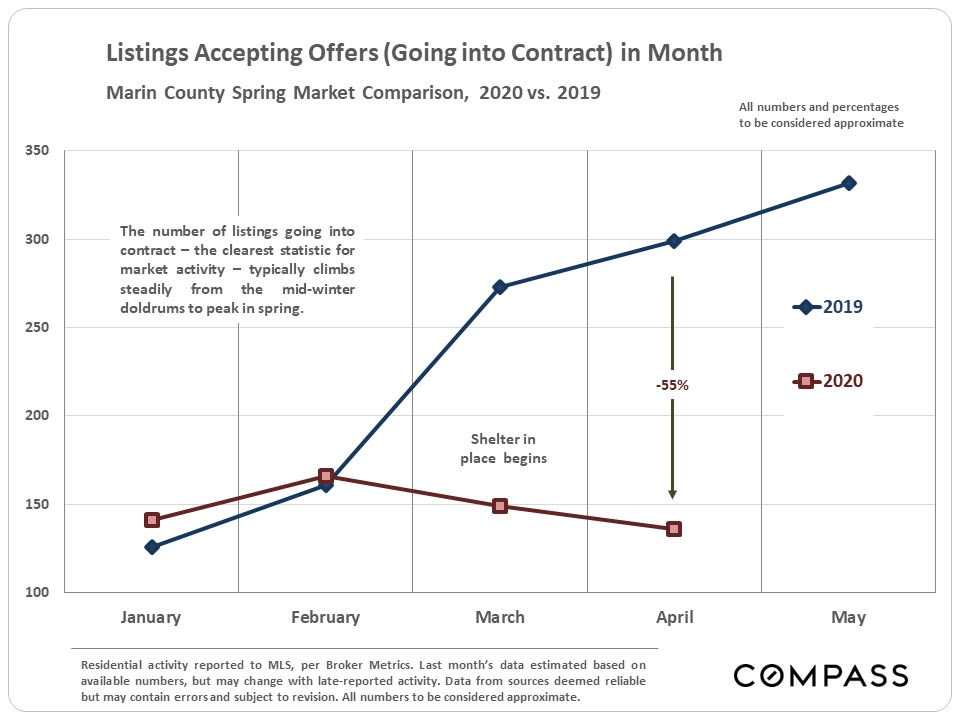
Since mid-March, shelter-in-place caused steep drops in activity across the board in what is typically the busiest selling season of the year. However, activity has been picking up since bottoming out in late March/early April, and will presumably continue to increase with the easing of both shelter-in-place and property-showing rules.
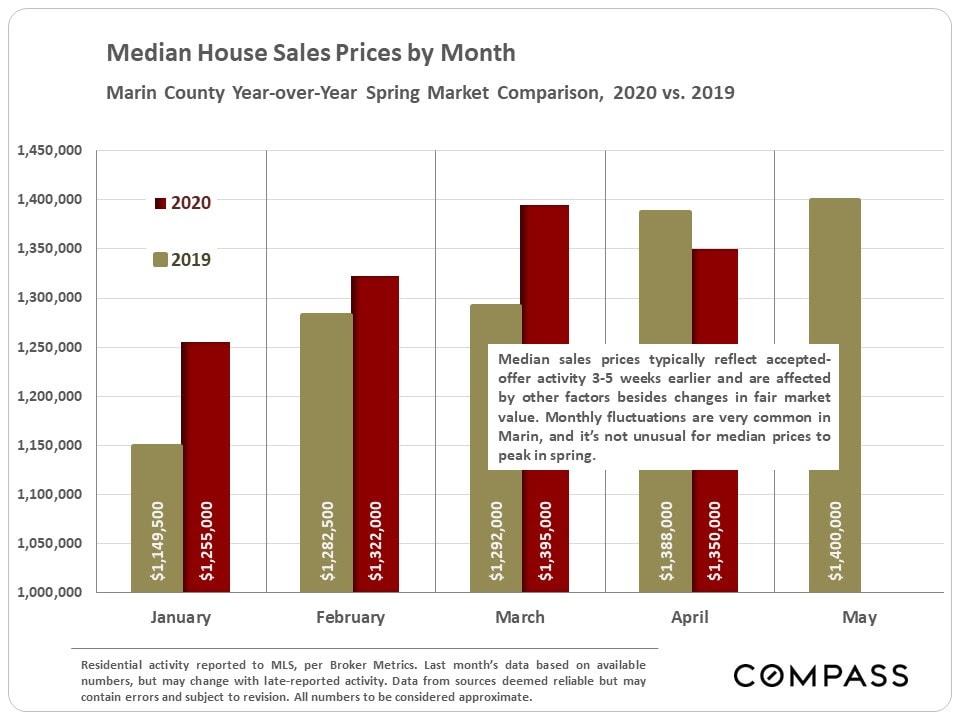
Though the Marin April median house price declined a little year over year (after 3 months of increases), too much should not be made of one month’s data – Marin’s monthly median sales price often fluctuates without great meaningfulness.
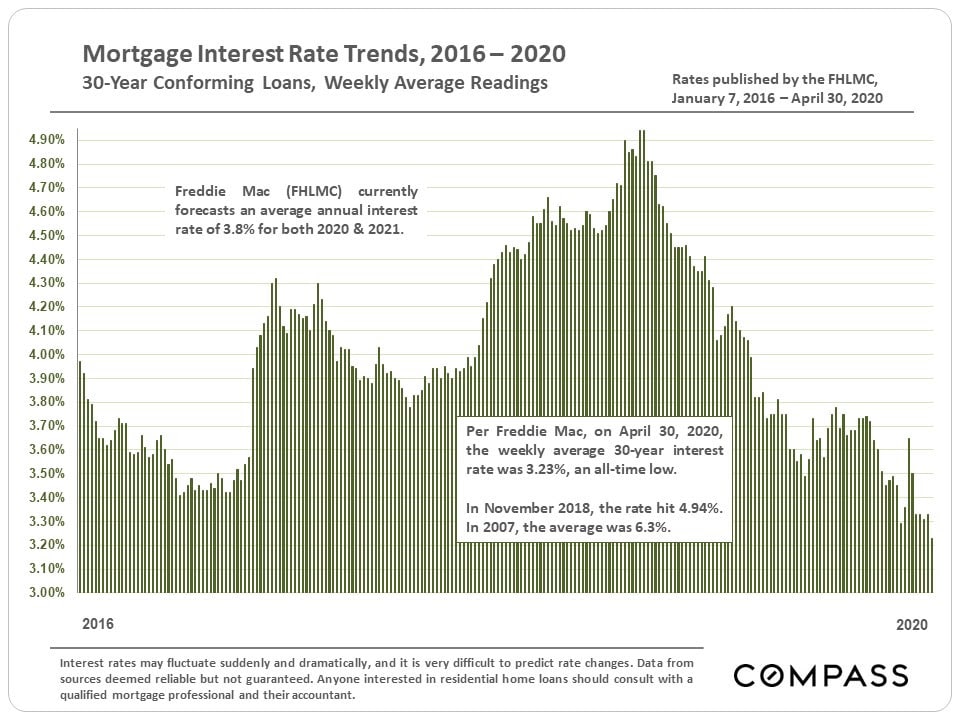
Interest rates hit a new historic low in the last week of April.
------------
Week by Week Supply & Demand Trends
The best way to clearly perceive the recent changes in the market - sudden plunge and the beginning of recovery - is by looking at WEEKLY trends in buyer and seller activity. These are illustrated in this first chart below.
Year-over-Year Changes in Median House Sales Prices
Generally speaking, the first months of 2020 have been characterized by often substantial, year-over-year increases in median home sales prices across the Bay Area. As mentioned, no firm conclusions should be made regarding the April y-o-y decline in Marin until substantiated over the longer term: Marin monthly median prices often fluctuate without great reference to changes in fair market value.
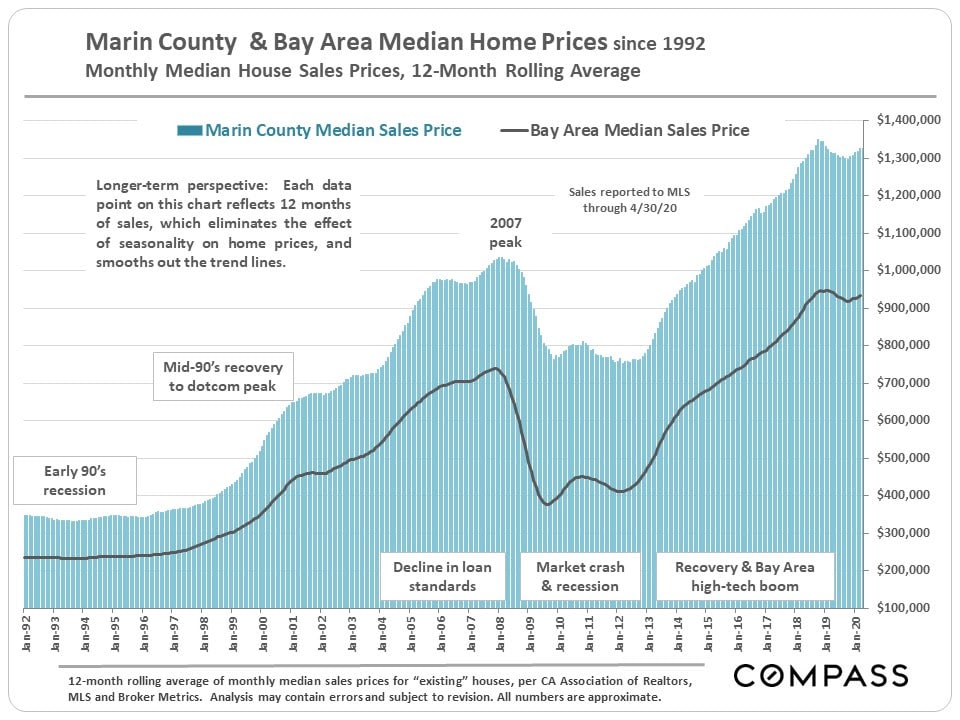
Long-Term Trends in Median Home Prices- 12-Month Rolling Illustration
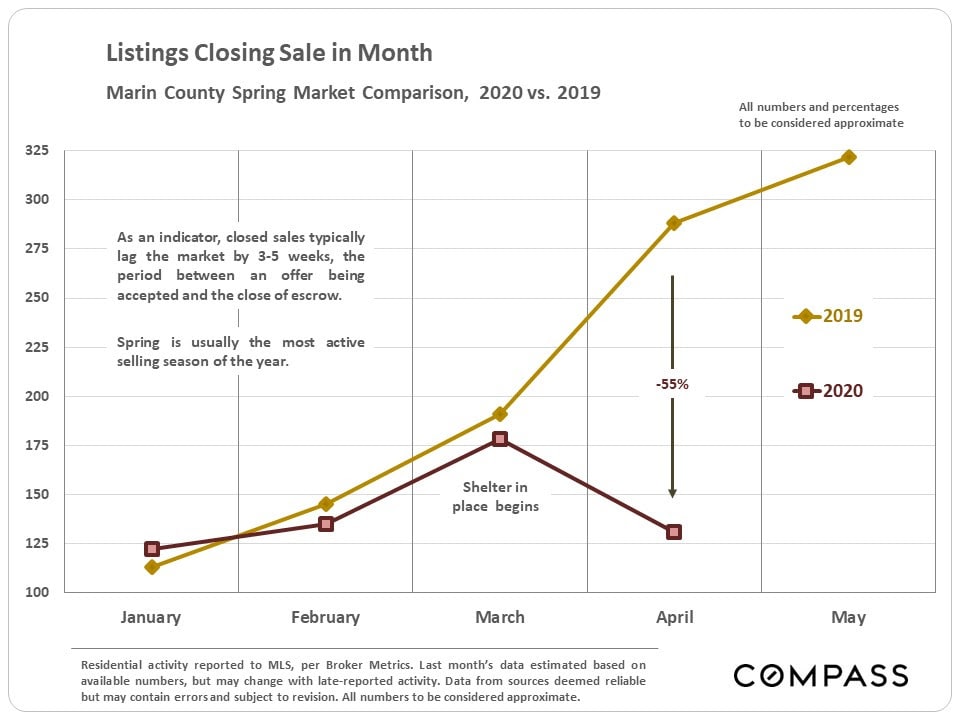
Monthly Supply & Demand, Year-over-Year Comparisons
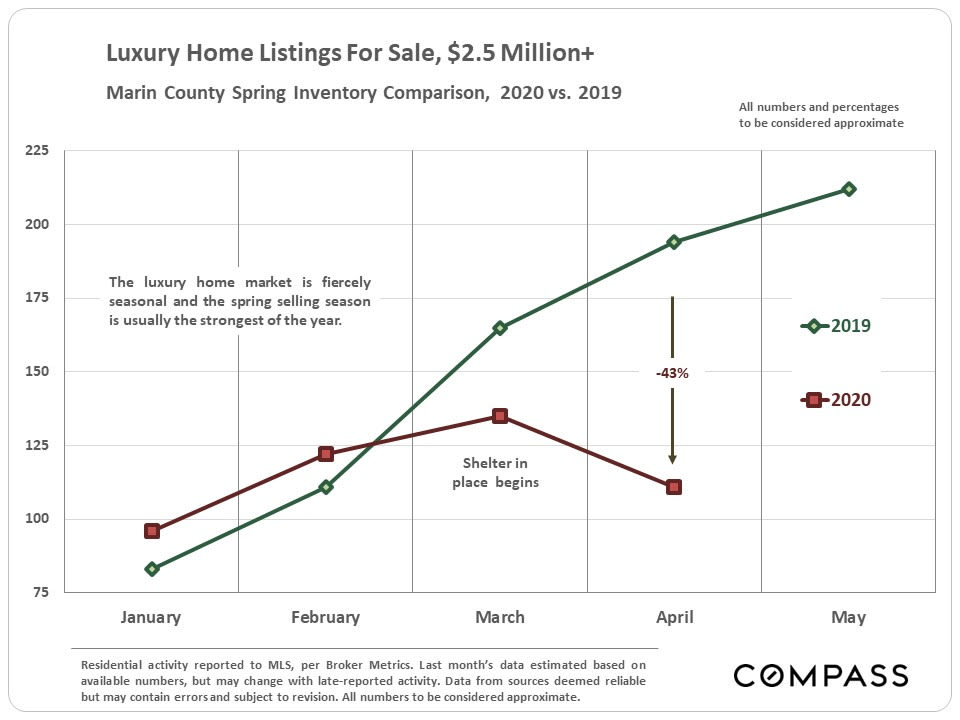
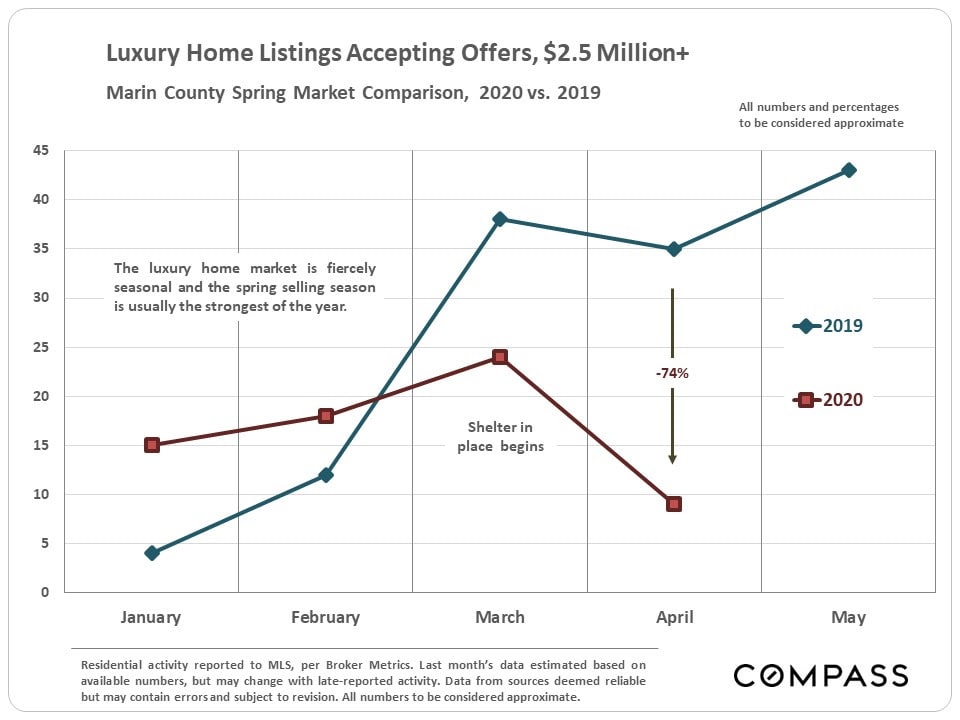
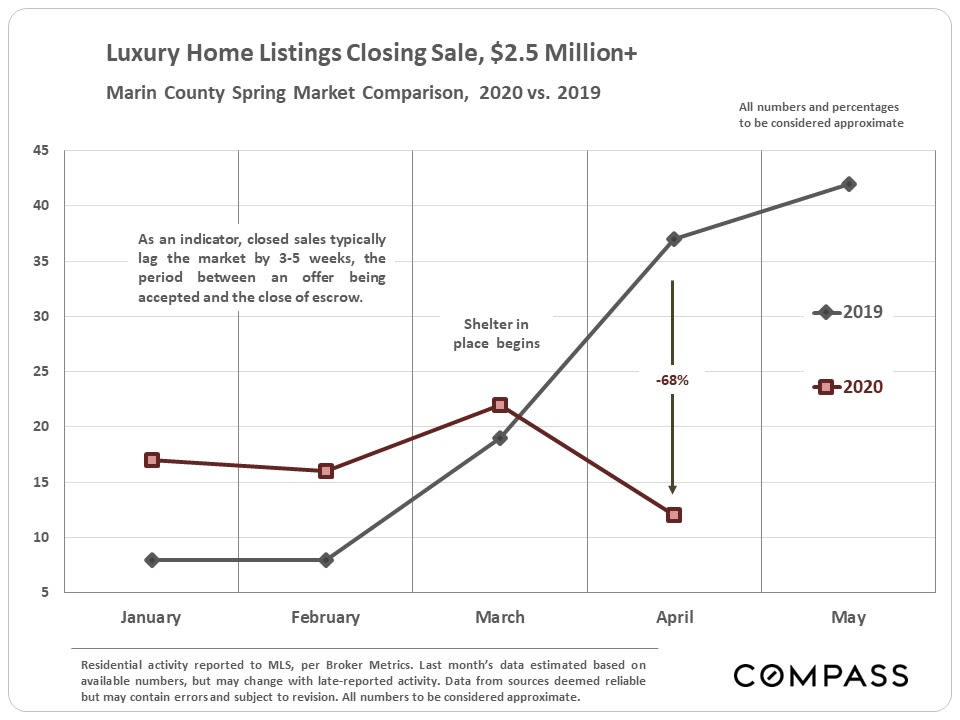
The next series of charts reflects the dramatic changes in seller and buyer dynamics by MONTH as compared to spring 2019. These don't reflect the uptick in activity in the most recent weeks.
Year-over-Year Changes in Luxury Home Markets
Mortgage Interest Rates
Unemployment
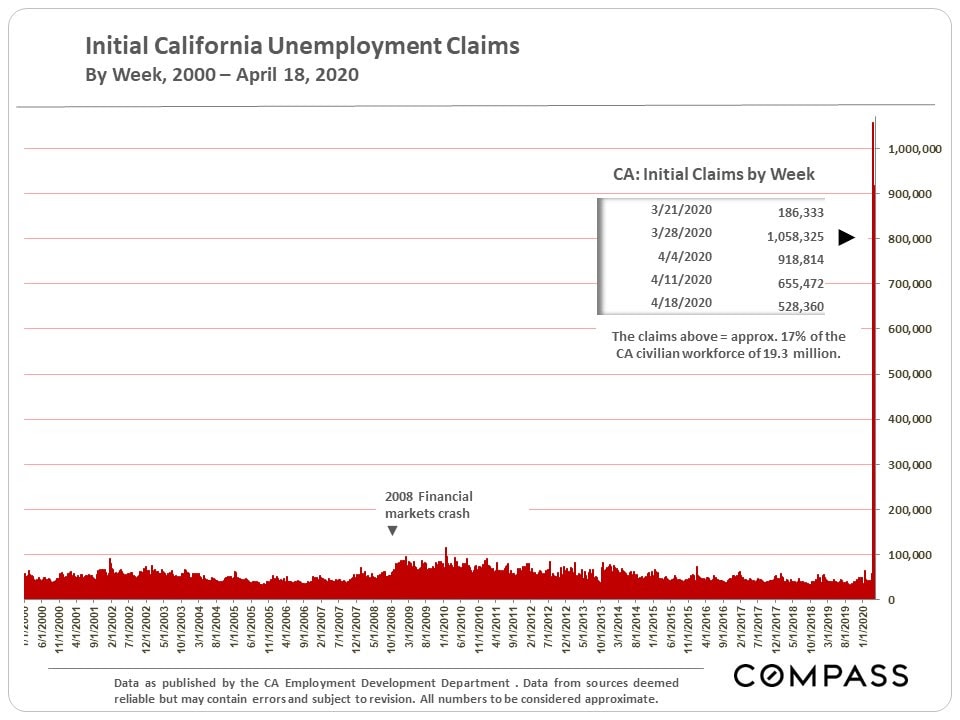
We are not going to review the economic news already extensively covered in the media, except for this stark illustration of the unparalleled rise in unemployment. How quickly this horrifying trend can be reversed will probably be the single largest factor behind an economic recovery (after the discovery of a vaccine).