
Updated Home Price Maps, Auto-Updating County Stats & Selected Economic Indicators
Staying informed is one of the most powerful tools in real estate. Below you'll find the latest updated home price maps for the Bay Area, Sacramento, and Lake Tahoe markets, auto-updating county-level market statistics, and selected economic indicators—all compiled in one place for your reference.
1) Updated Home Price Maps
Home price maps for Bay Area counties, the Sacramento region, and Lake Tahoe markets have been updated. These maps use 12 months of sales data because it eliminates seasonality from prices—using Q1 data, when prices are low, ahead of Q2, when prices peak, is not useful—and provides much larger, more reliable datasets for the calculations. If you already have a map embedded on your website, it will have updated automatically.
City of San Francisco Home Price Map
View San Francisco Neighborhood Map Online →Peninsula / South Bay Home Price Map: San Mateo, Santa Clara & Southern Alameda Counties
View Peninsula / South Bay Map Online →East Bay Home Price Map: Alameda & Contra Costa Counties
View East Bay Map Online →Marin County Home Price Map
View Marin County Map Online →Napa, Sonoma & Solano Counties Home Price Map
View Napa / Sonoma / Solano Map Online →Santa Cruz & Monterey Counties Home Price Map
View Santa Cruz / Monterey Map Online →Lake Tahoe Home Price Map
View Lake Tahoe Map Online →Sacramento Region Home Price Map
View Sacramento Region Map Online →2) Online, Auto-Updating County Market Statistics
An extensive compilation of links to Infosparks auto-updating, online market stats charts for 17 NorCal Counties. These provide a wealth of market data at your fingertips, accessible at any time. Please allow at least 5 business days from month's end for the data to be entered into MLS.
San Francisco County
Marin County
Sonoma County
Napa County
Contra Costa County
Alameda County
Santa Clara County
San Mateo County
Santa Cruz County
Monterey County
Solano County
Sacramento County
Placer County
El Dorado County
Mendocino County
Lake County
California Statewide Housing Market Overview (C.A.R.) →
3) Selected Economic Indicators
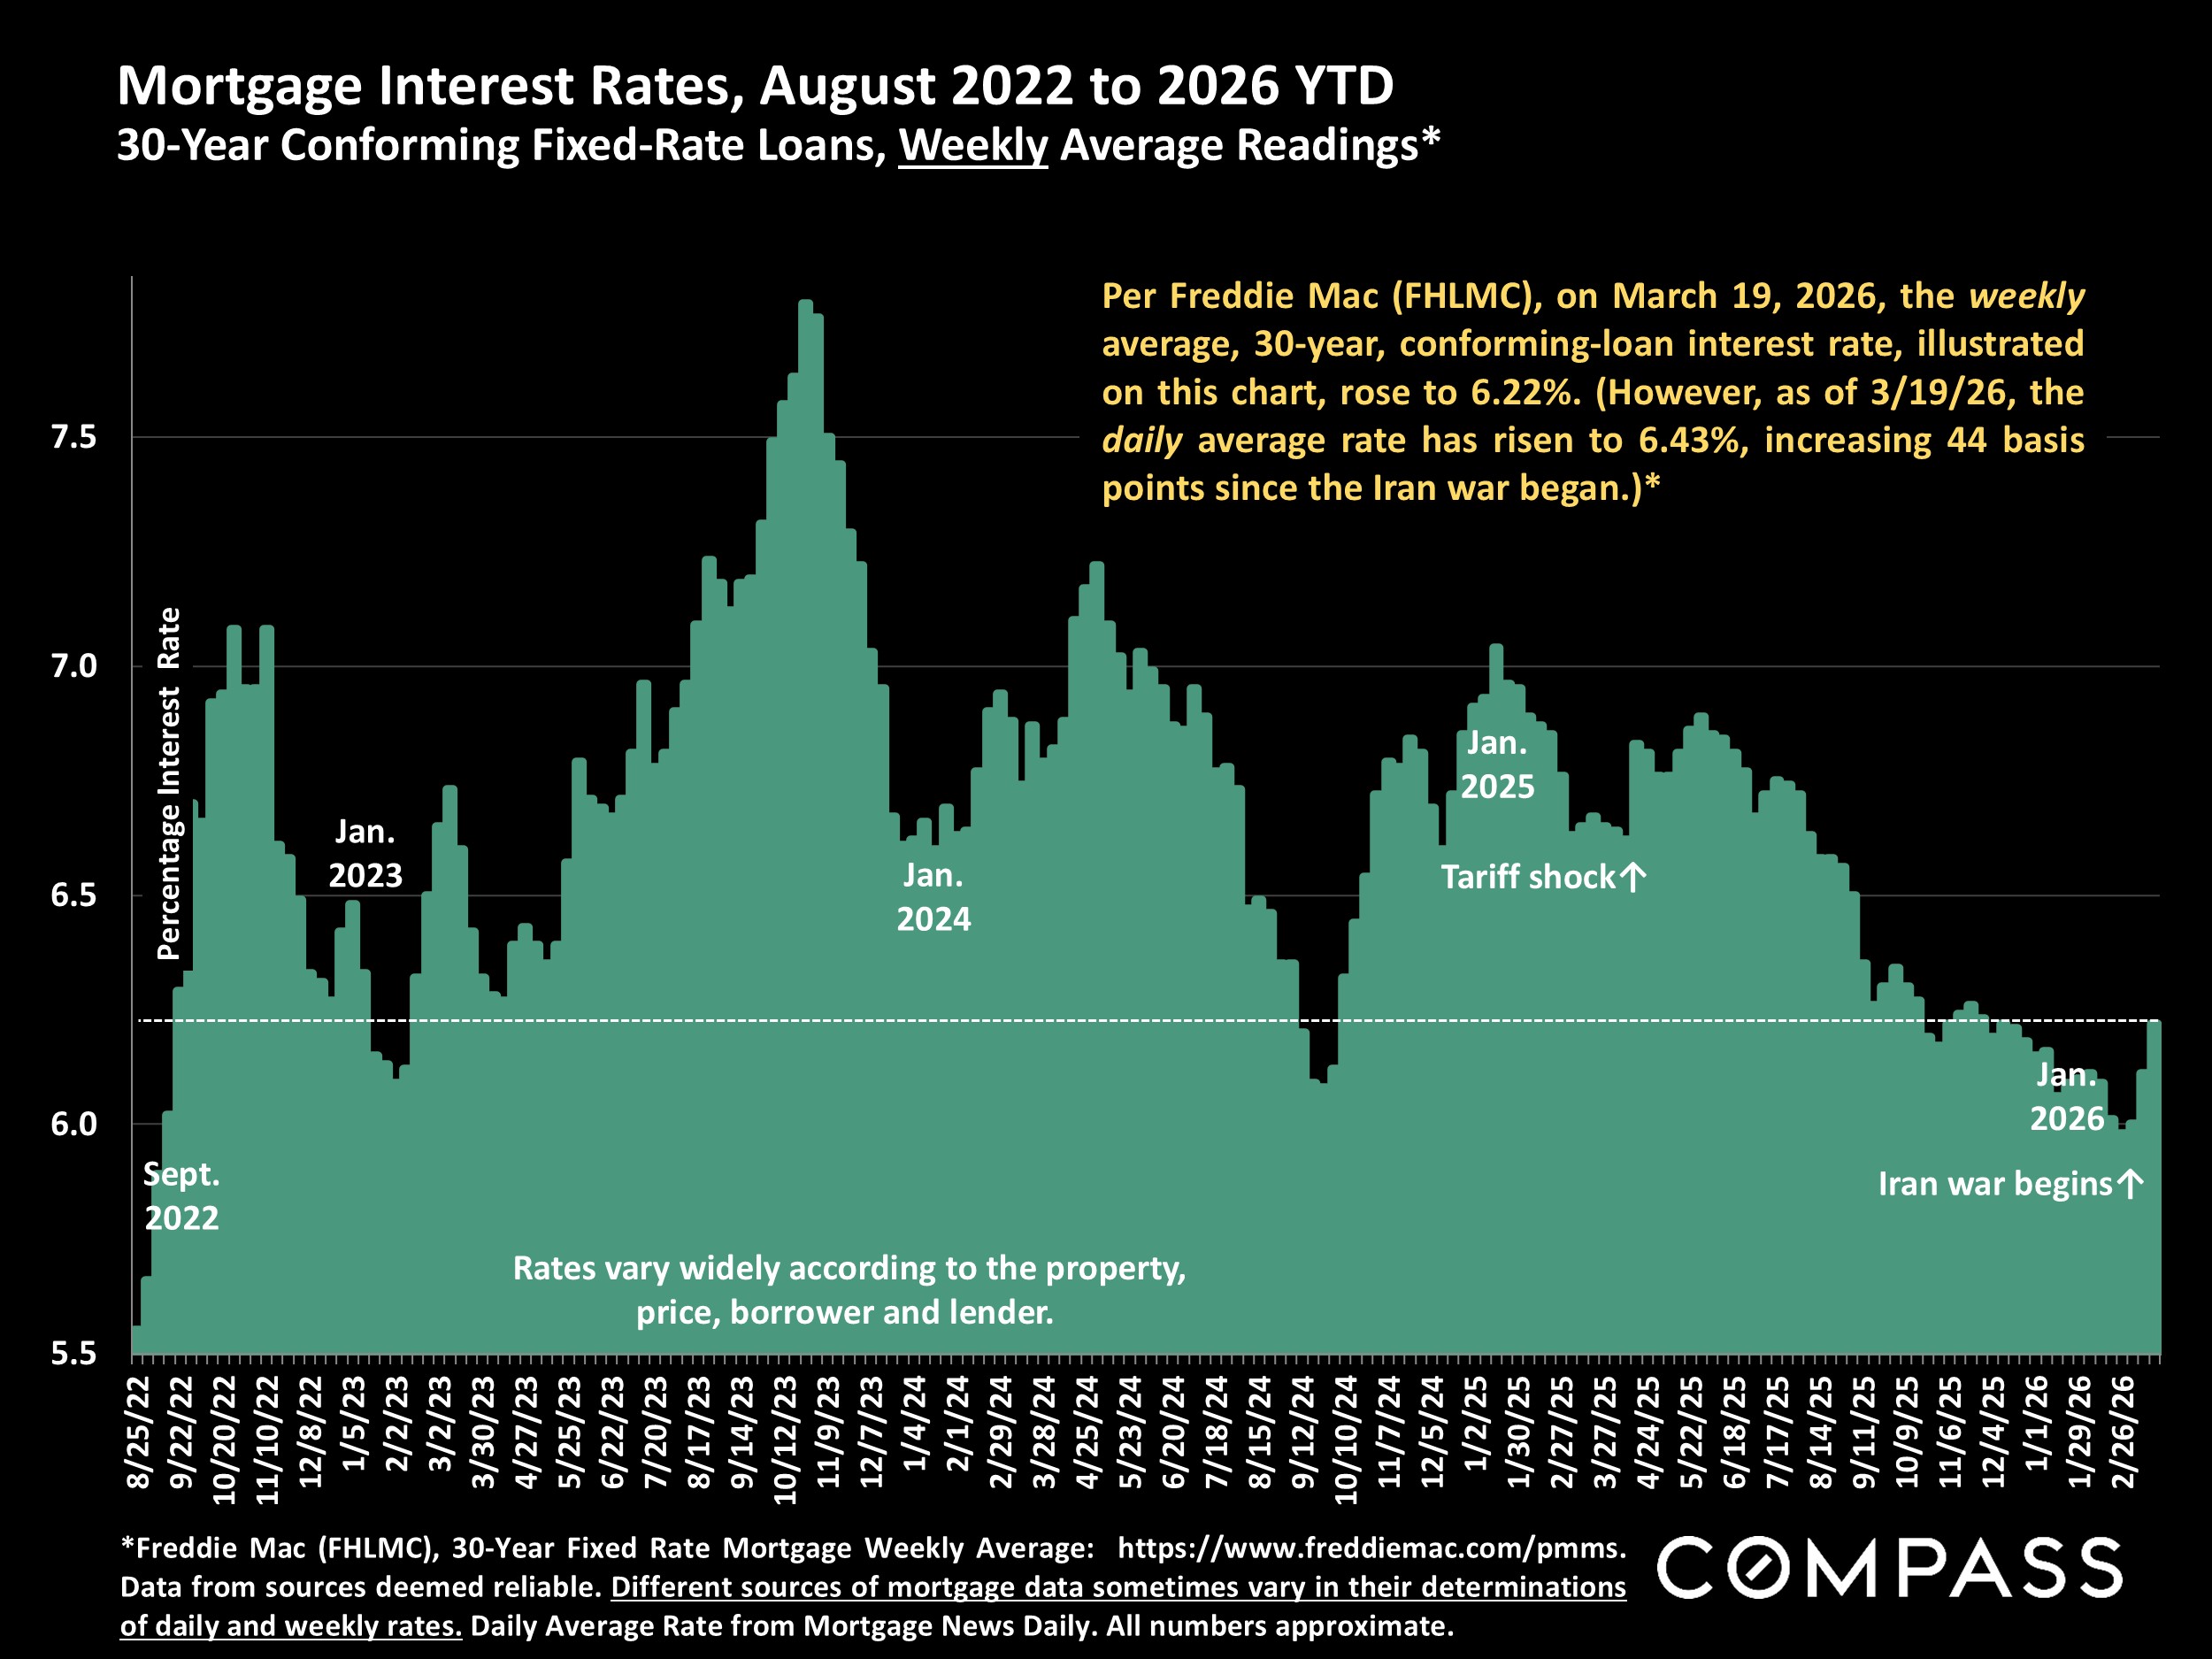
Mortgage Interest Rates
The weekly average 30-year conforming-loan interest rate rose to 6.22% as of March 19, 2026. However, the daily average rate has risen to 6.43%, increasing 44 basis points since the Iran war began.
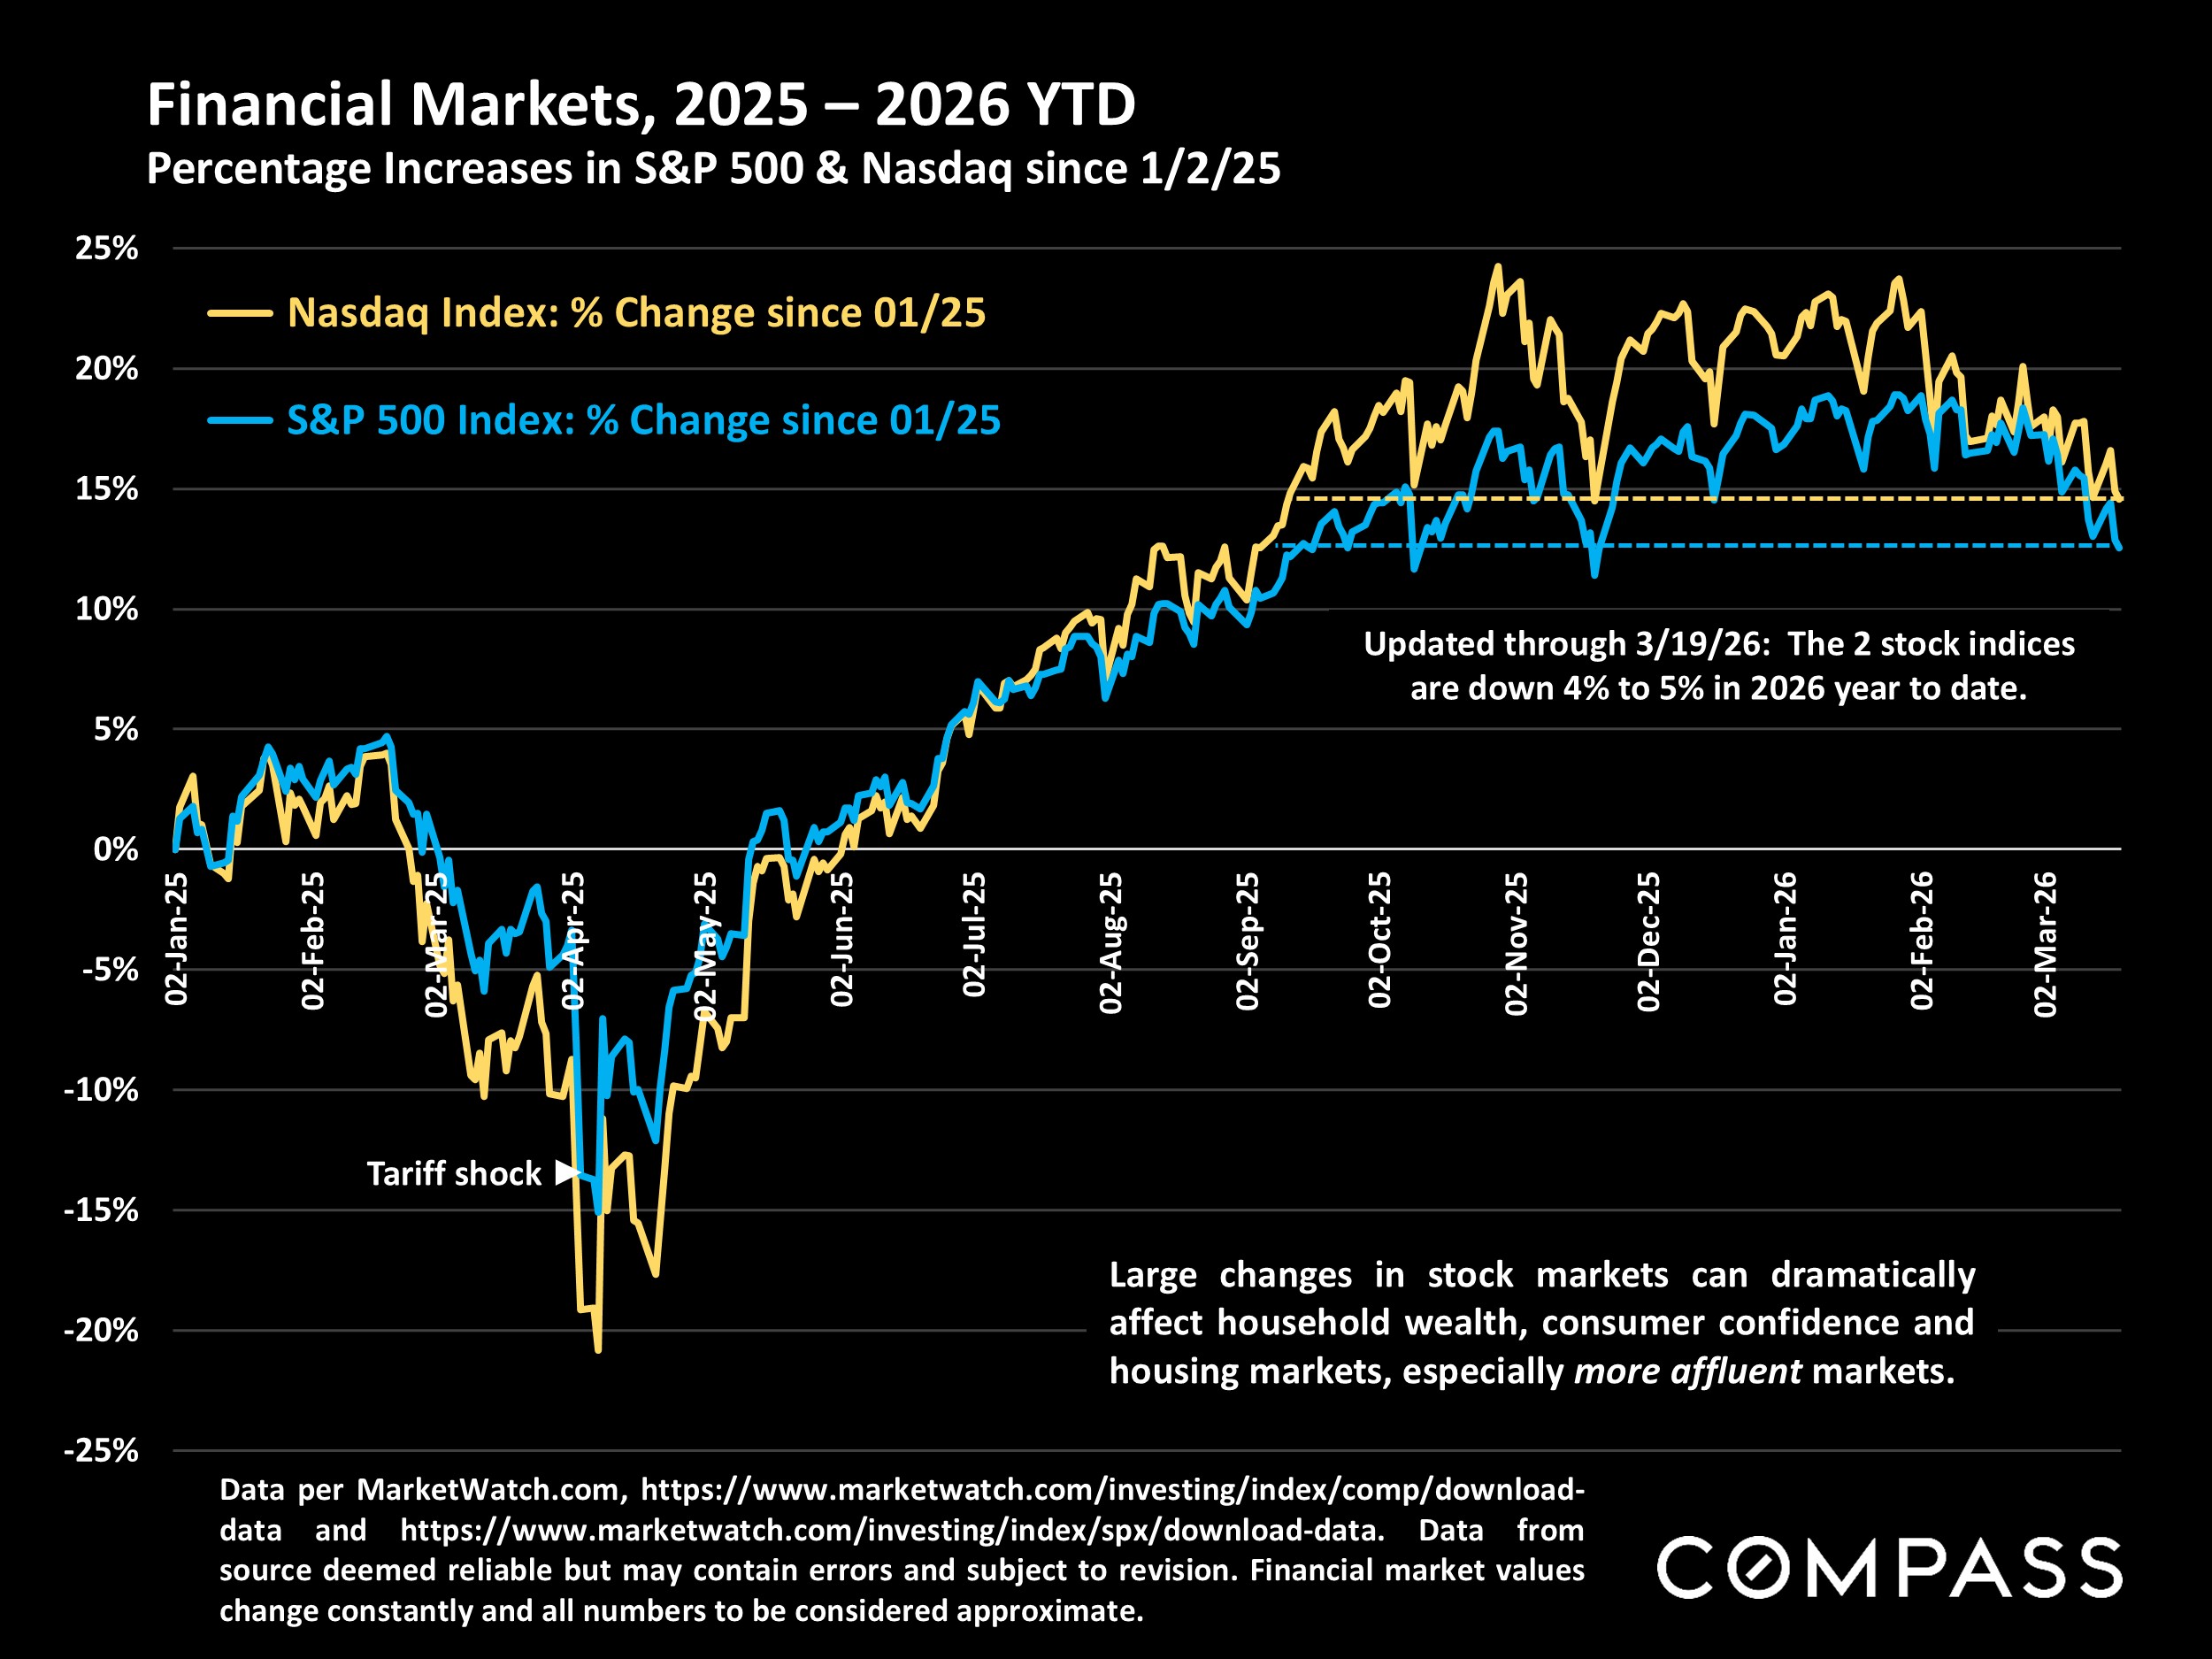
Financial Markets
Amid regular ups and downs, stock markets have been generally trending down, and have fallen 4% to 5% since 2026 began. Large changes in stock markets can dramatically affect household wealth, consumer confidence, and housing markets, especially more affluent markets.
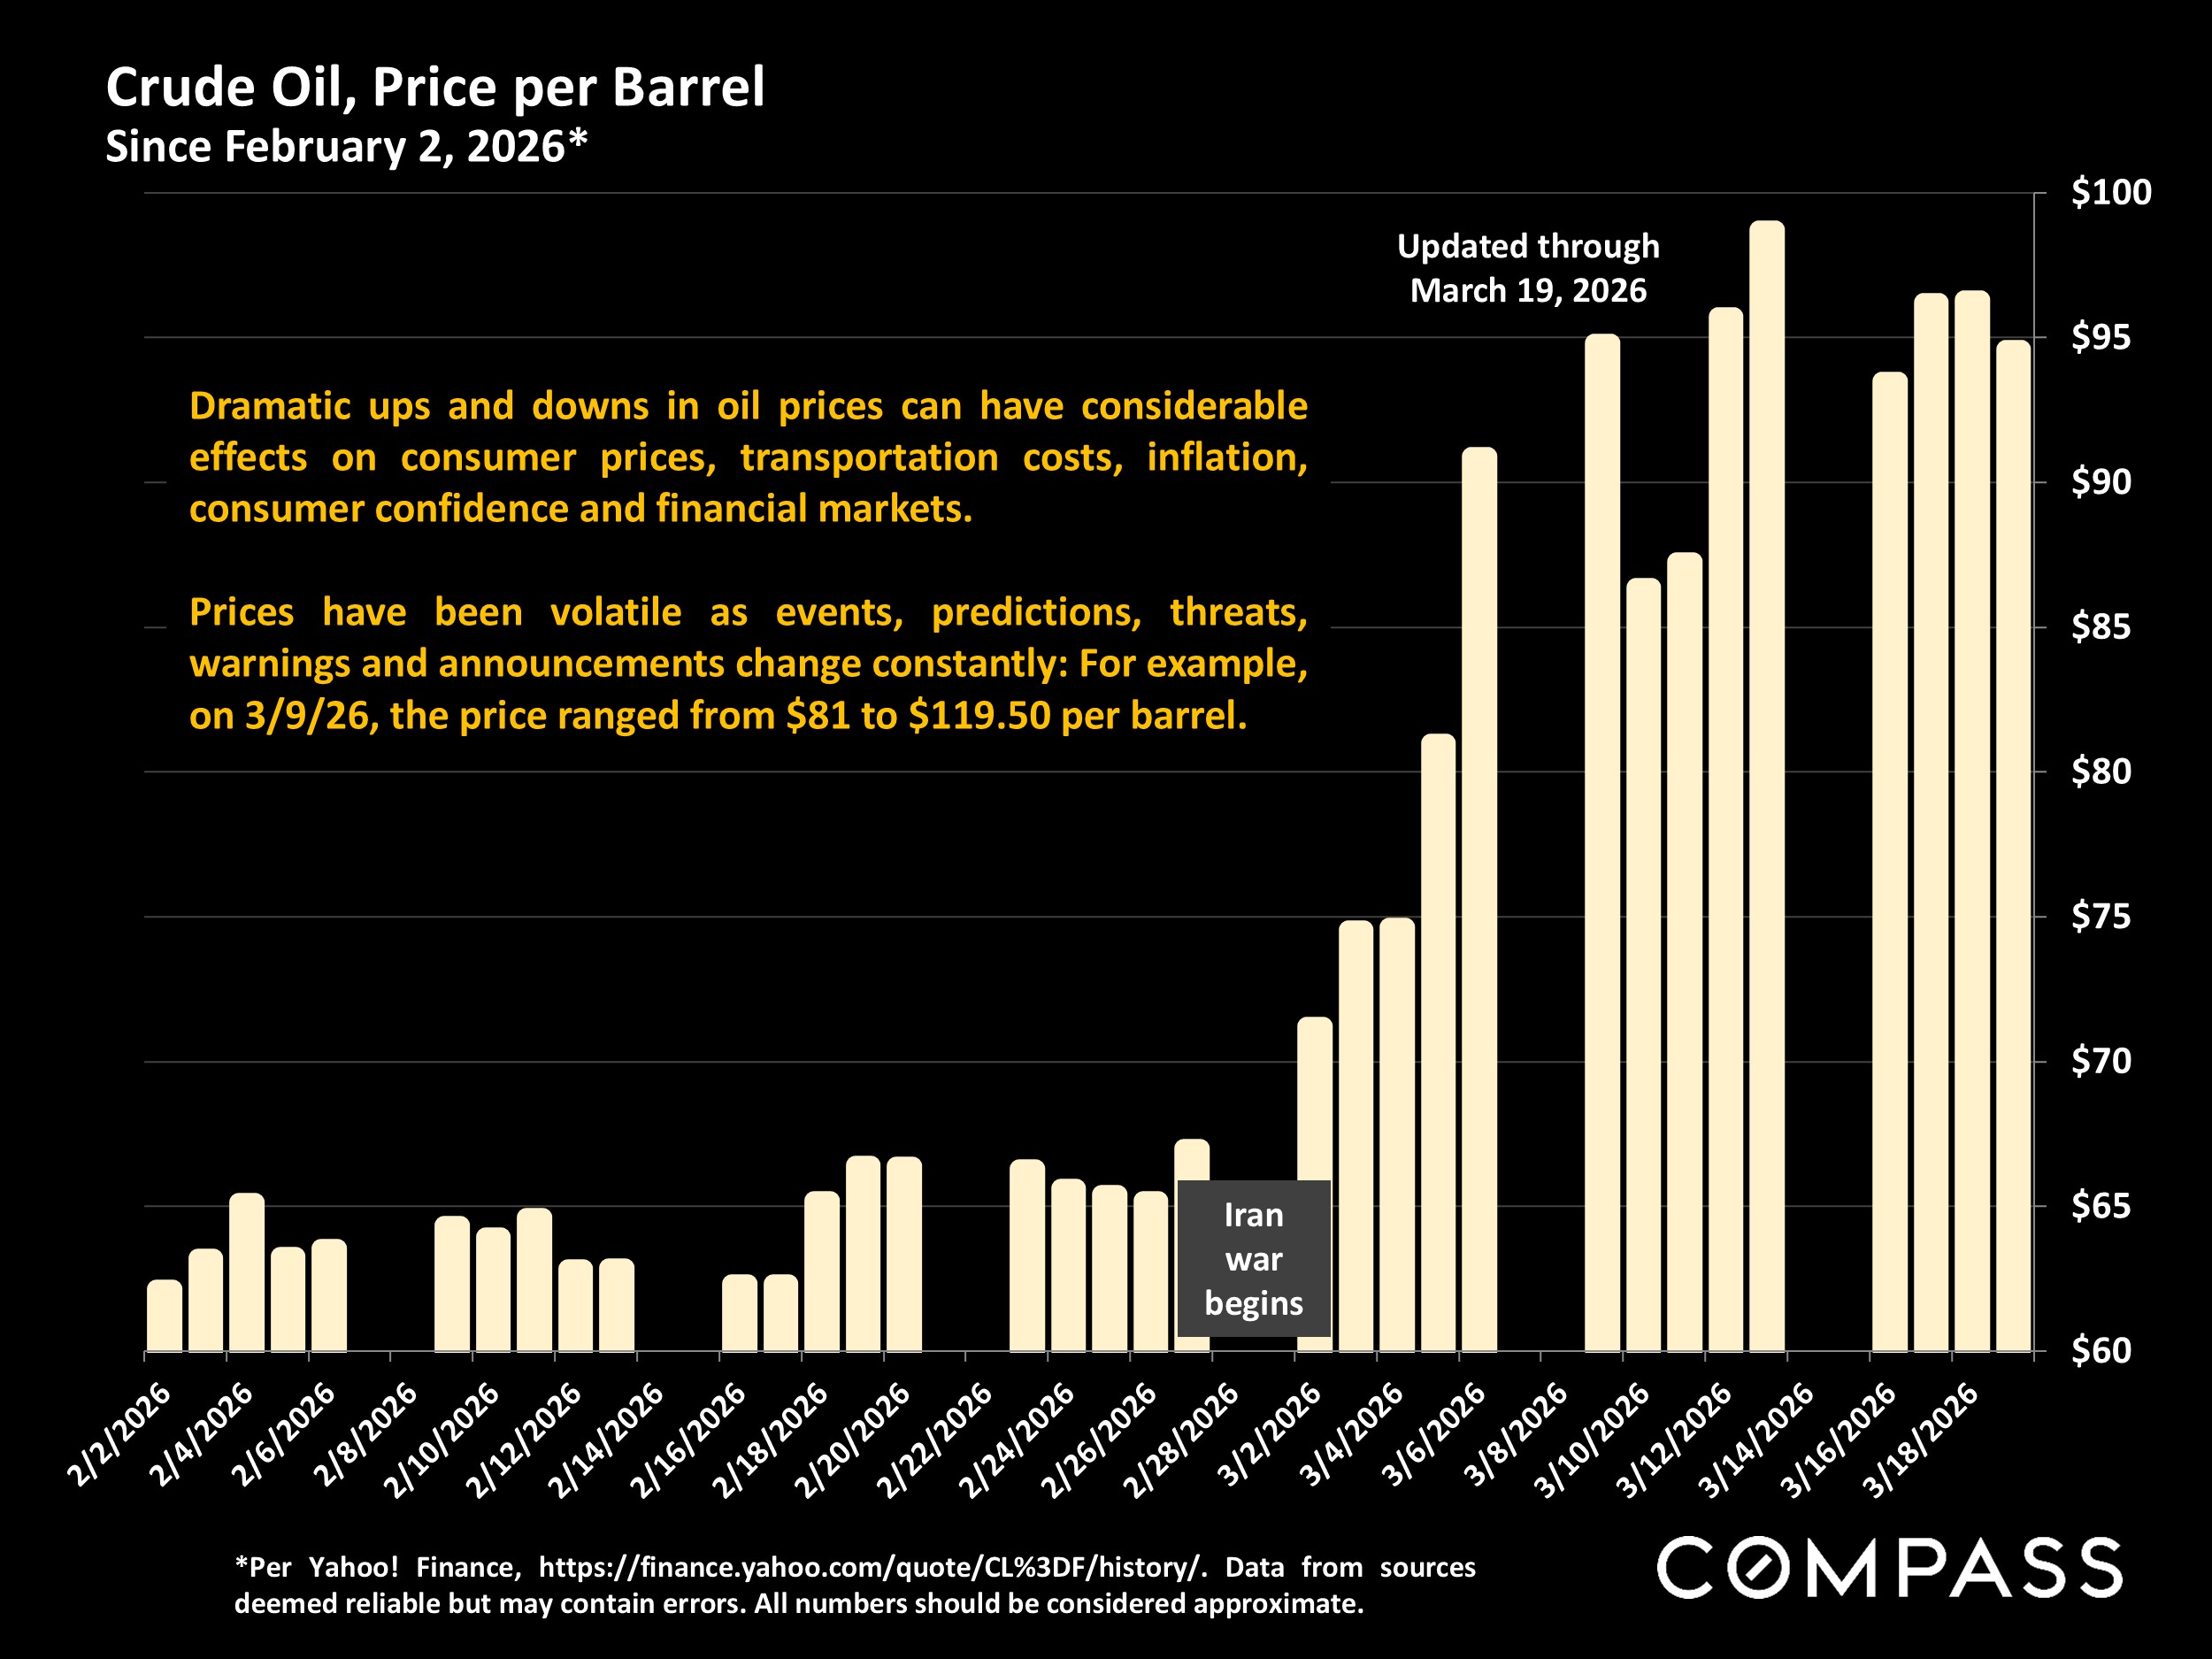
Oil Prices
Oil prices: the huge wildcard for the world economy. Dramatic ups and downs in oil prices can have considerable effects on consumer prices, transportation costs, inflation, consumer confidence, and financial markets. On 3/9/26, the price ranged from $81 to $119.50 per barrel.
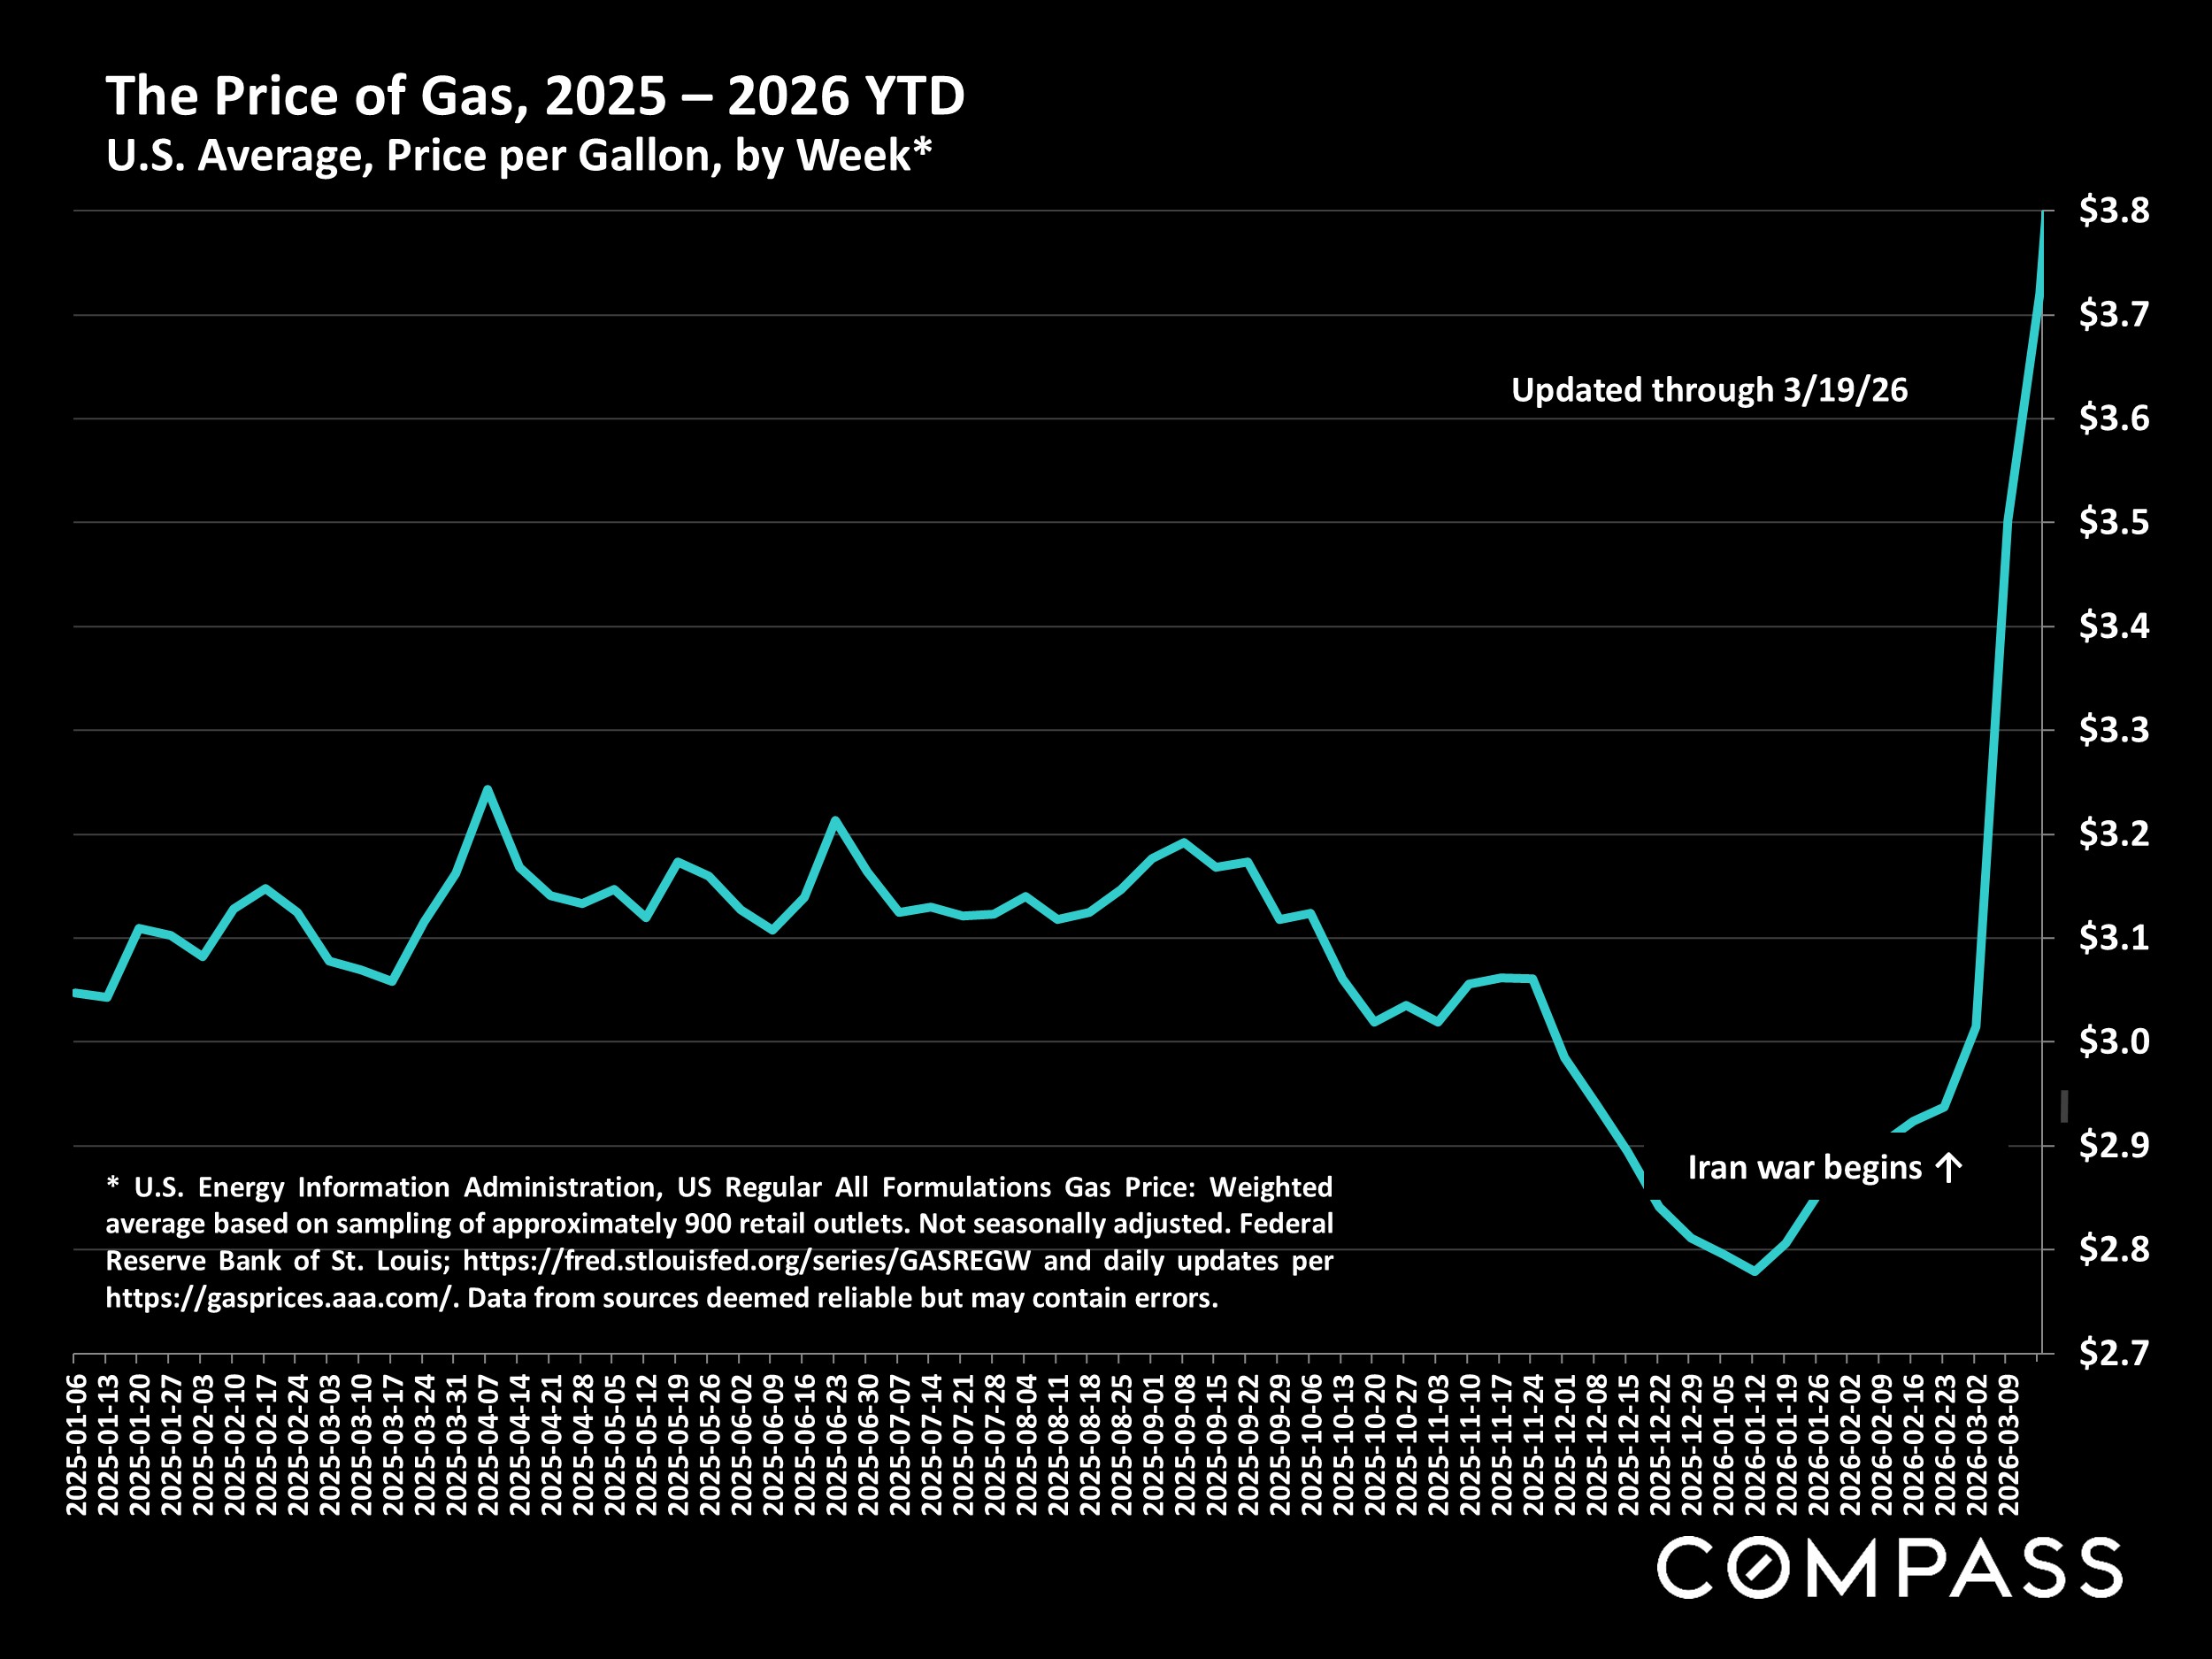
The Price of Gas
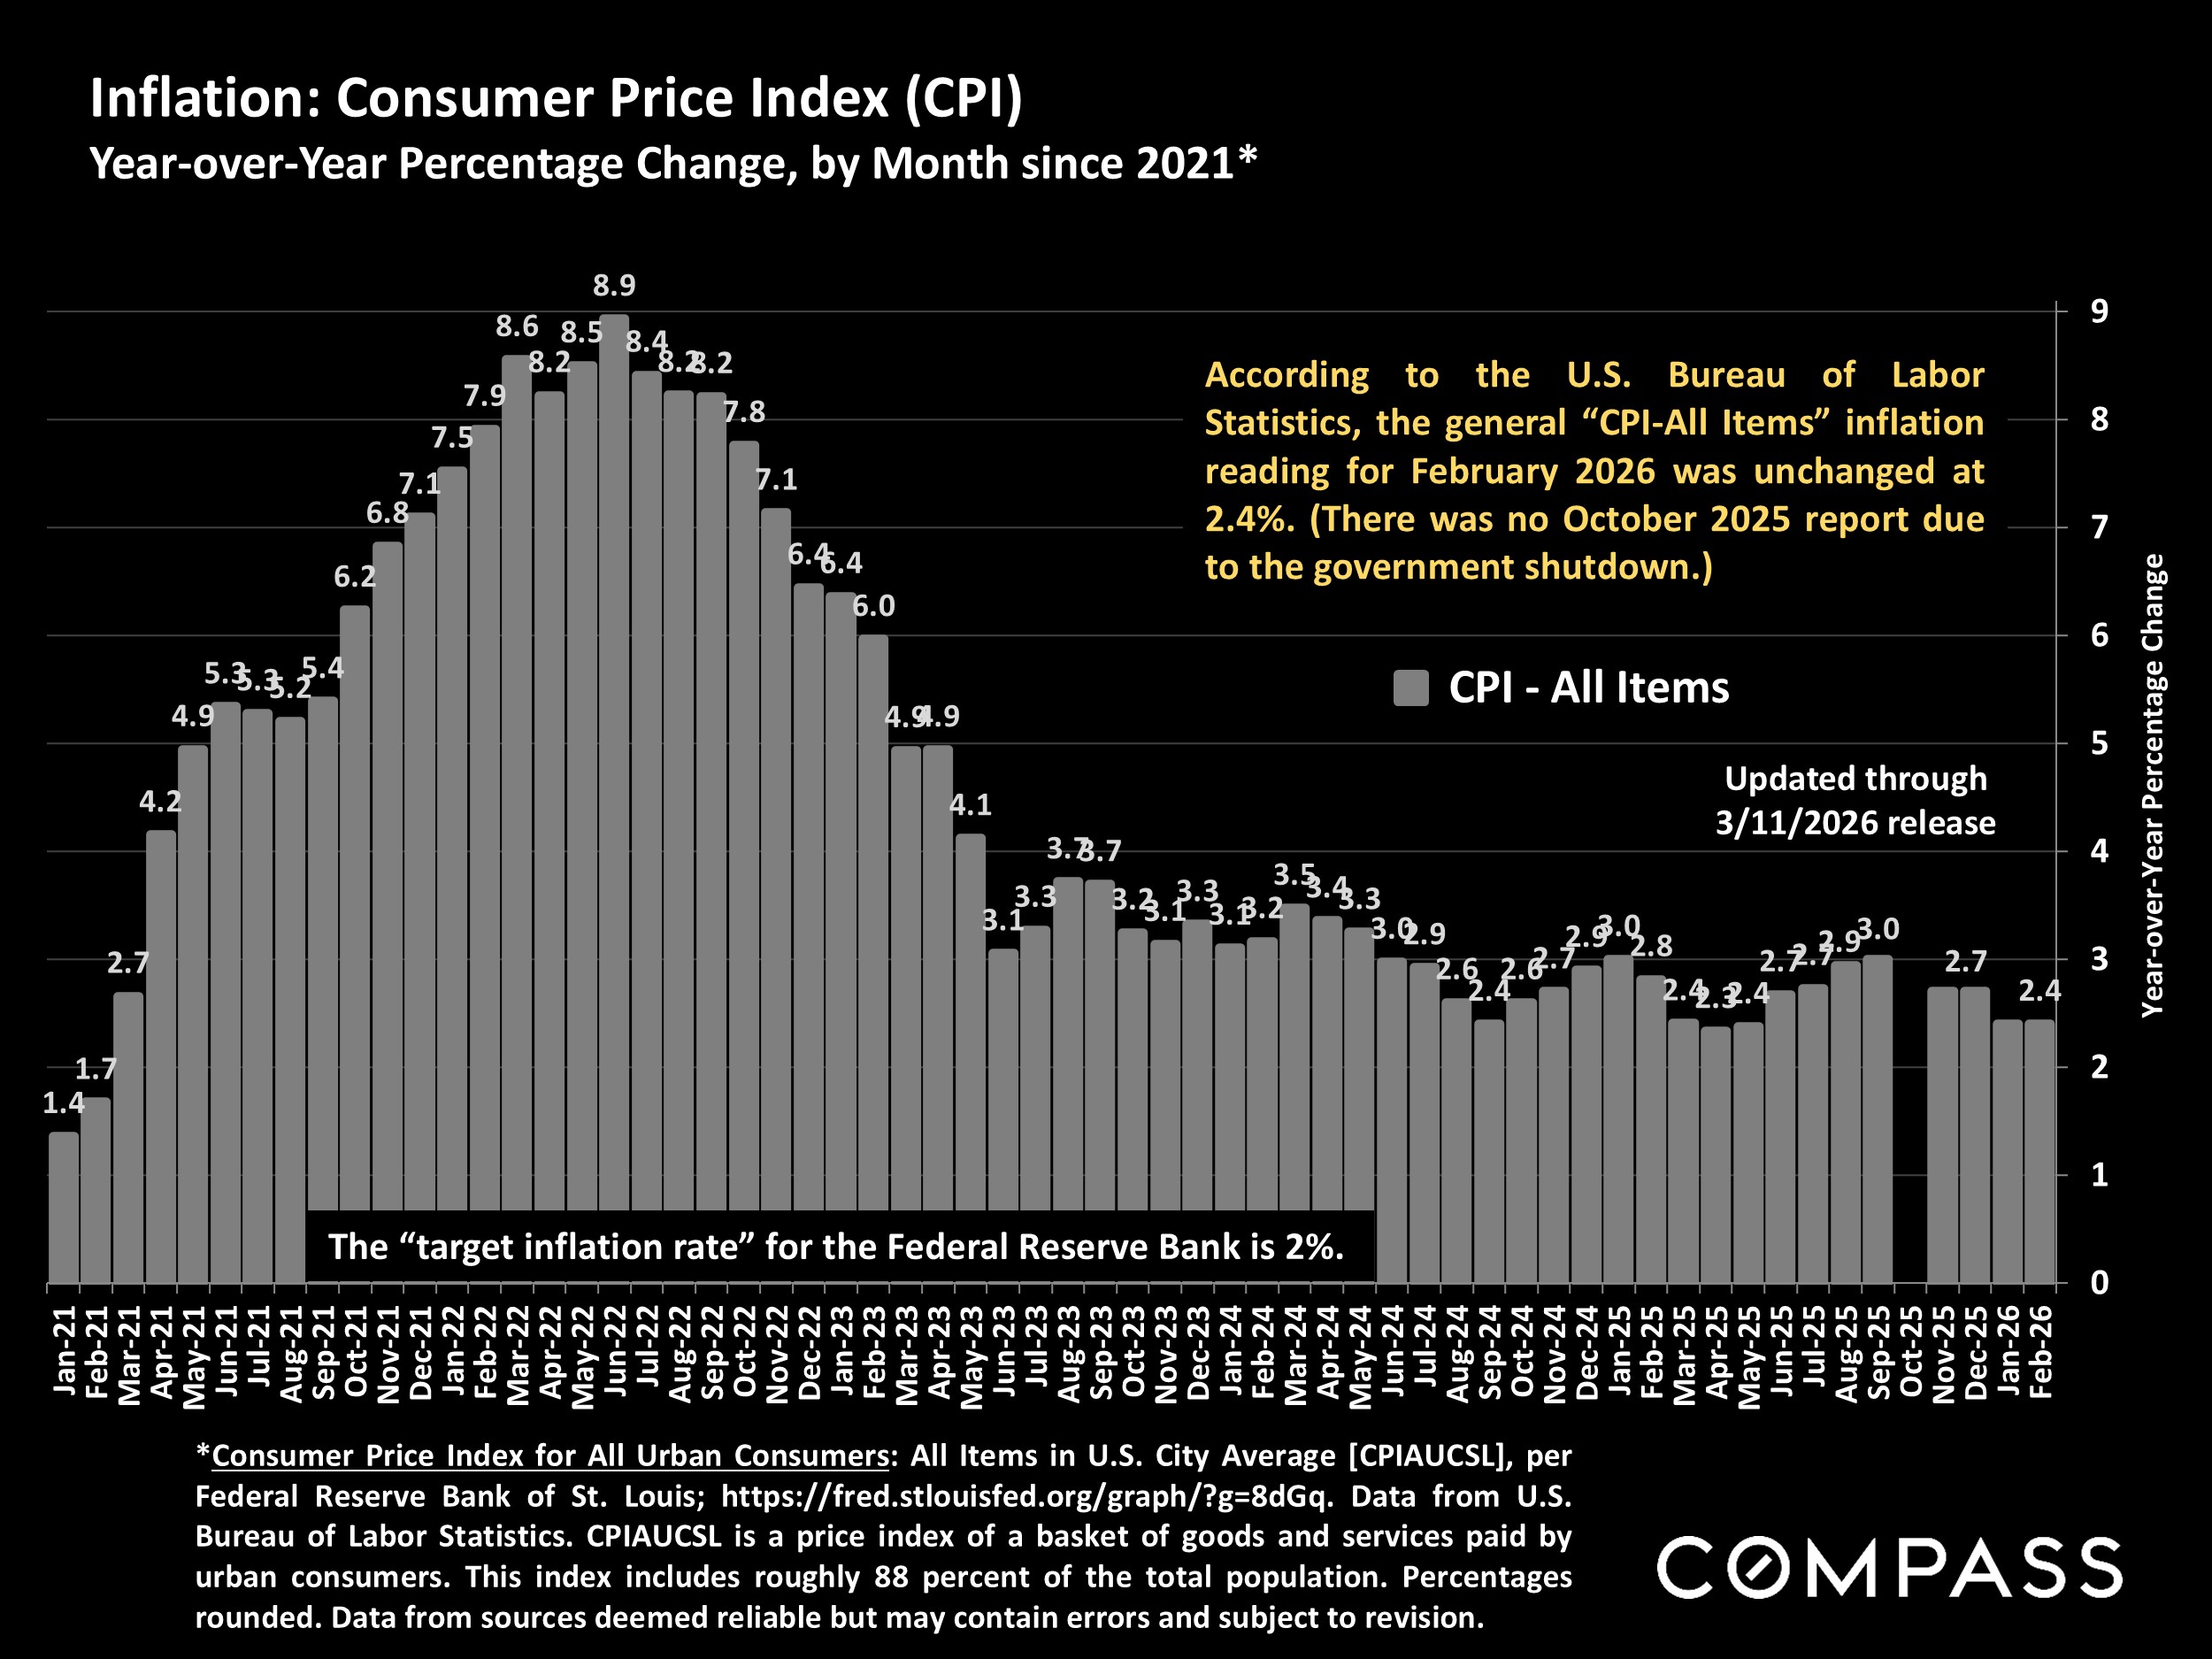
Inflation: Consumer Price Index (CPI)
Last month's inflation reading was subdued. According to the U.S. Bureau of Labor Statistics, the general CPI-All Items inflation reading for February 2026 was unchanged at 2.4%.
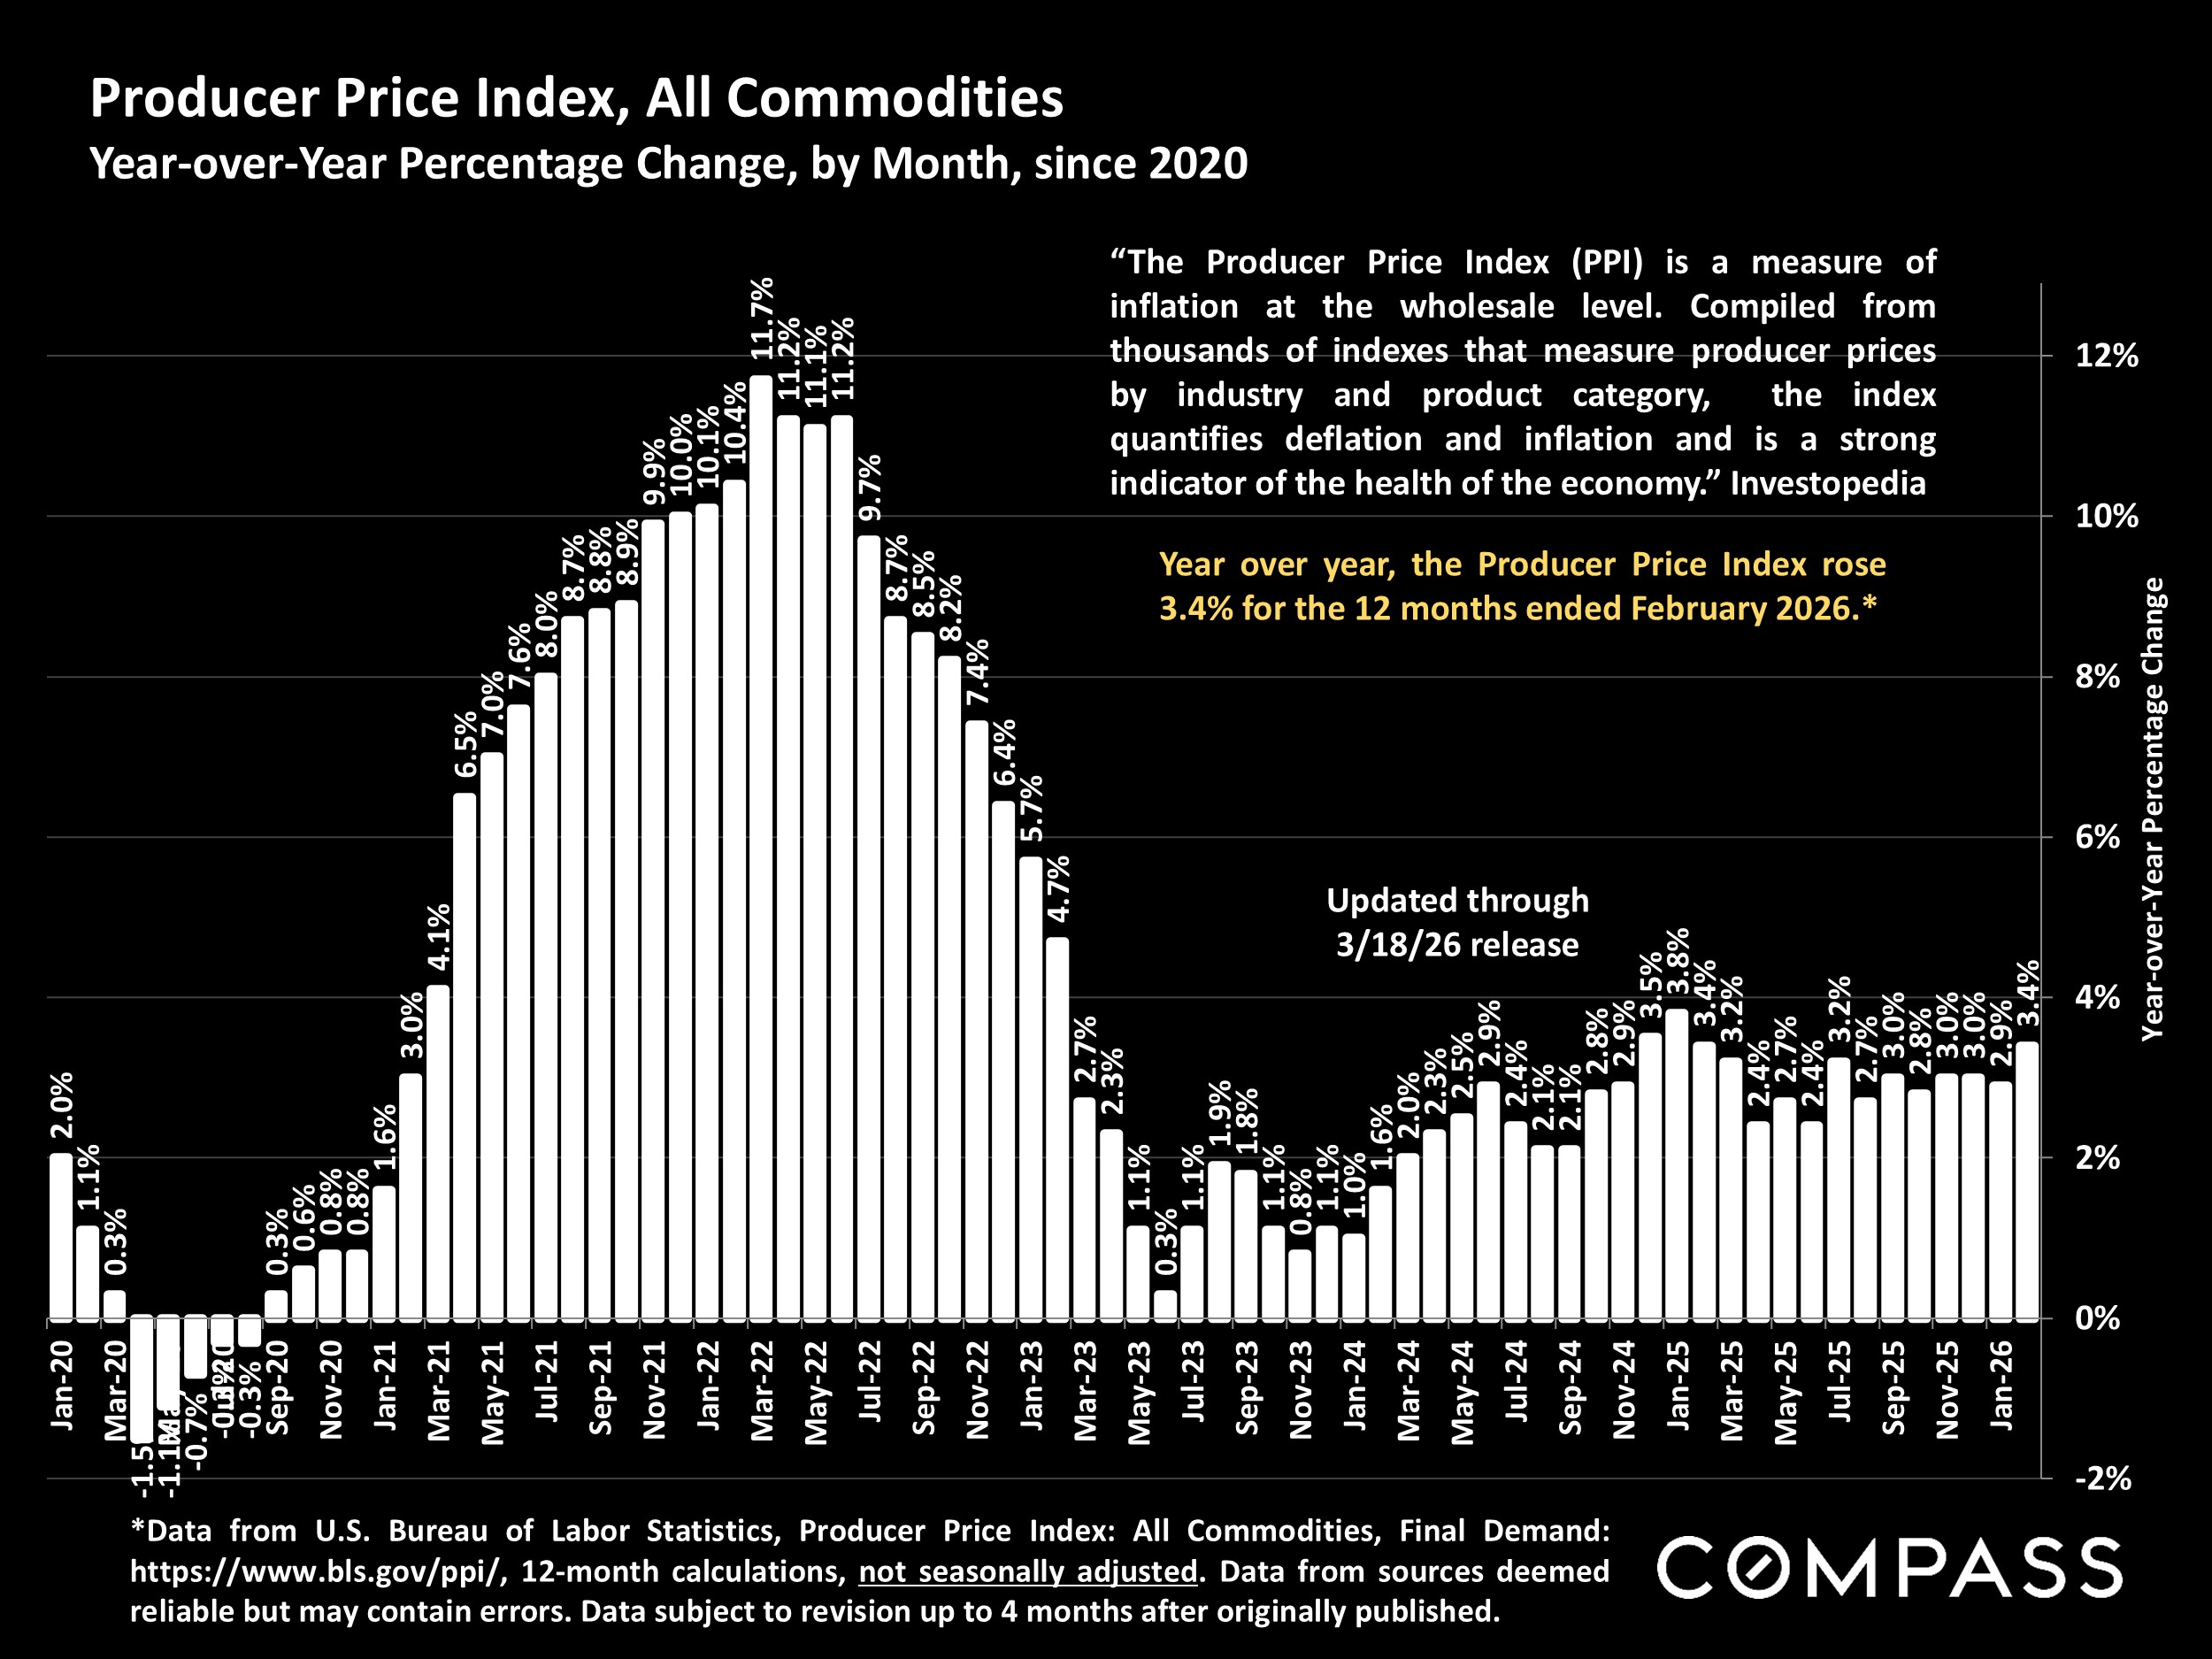
Producer Price Index (PPI)
The Producer Price Index, often a forward indicator for consumer inflation, rose to its highest reading in 12 months. Year over year, the PPI rose 3.4% for the 12 months ended February 2026. Any effects of the Iran war, should they occur, will not yet appear in either of these charts.
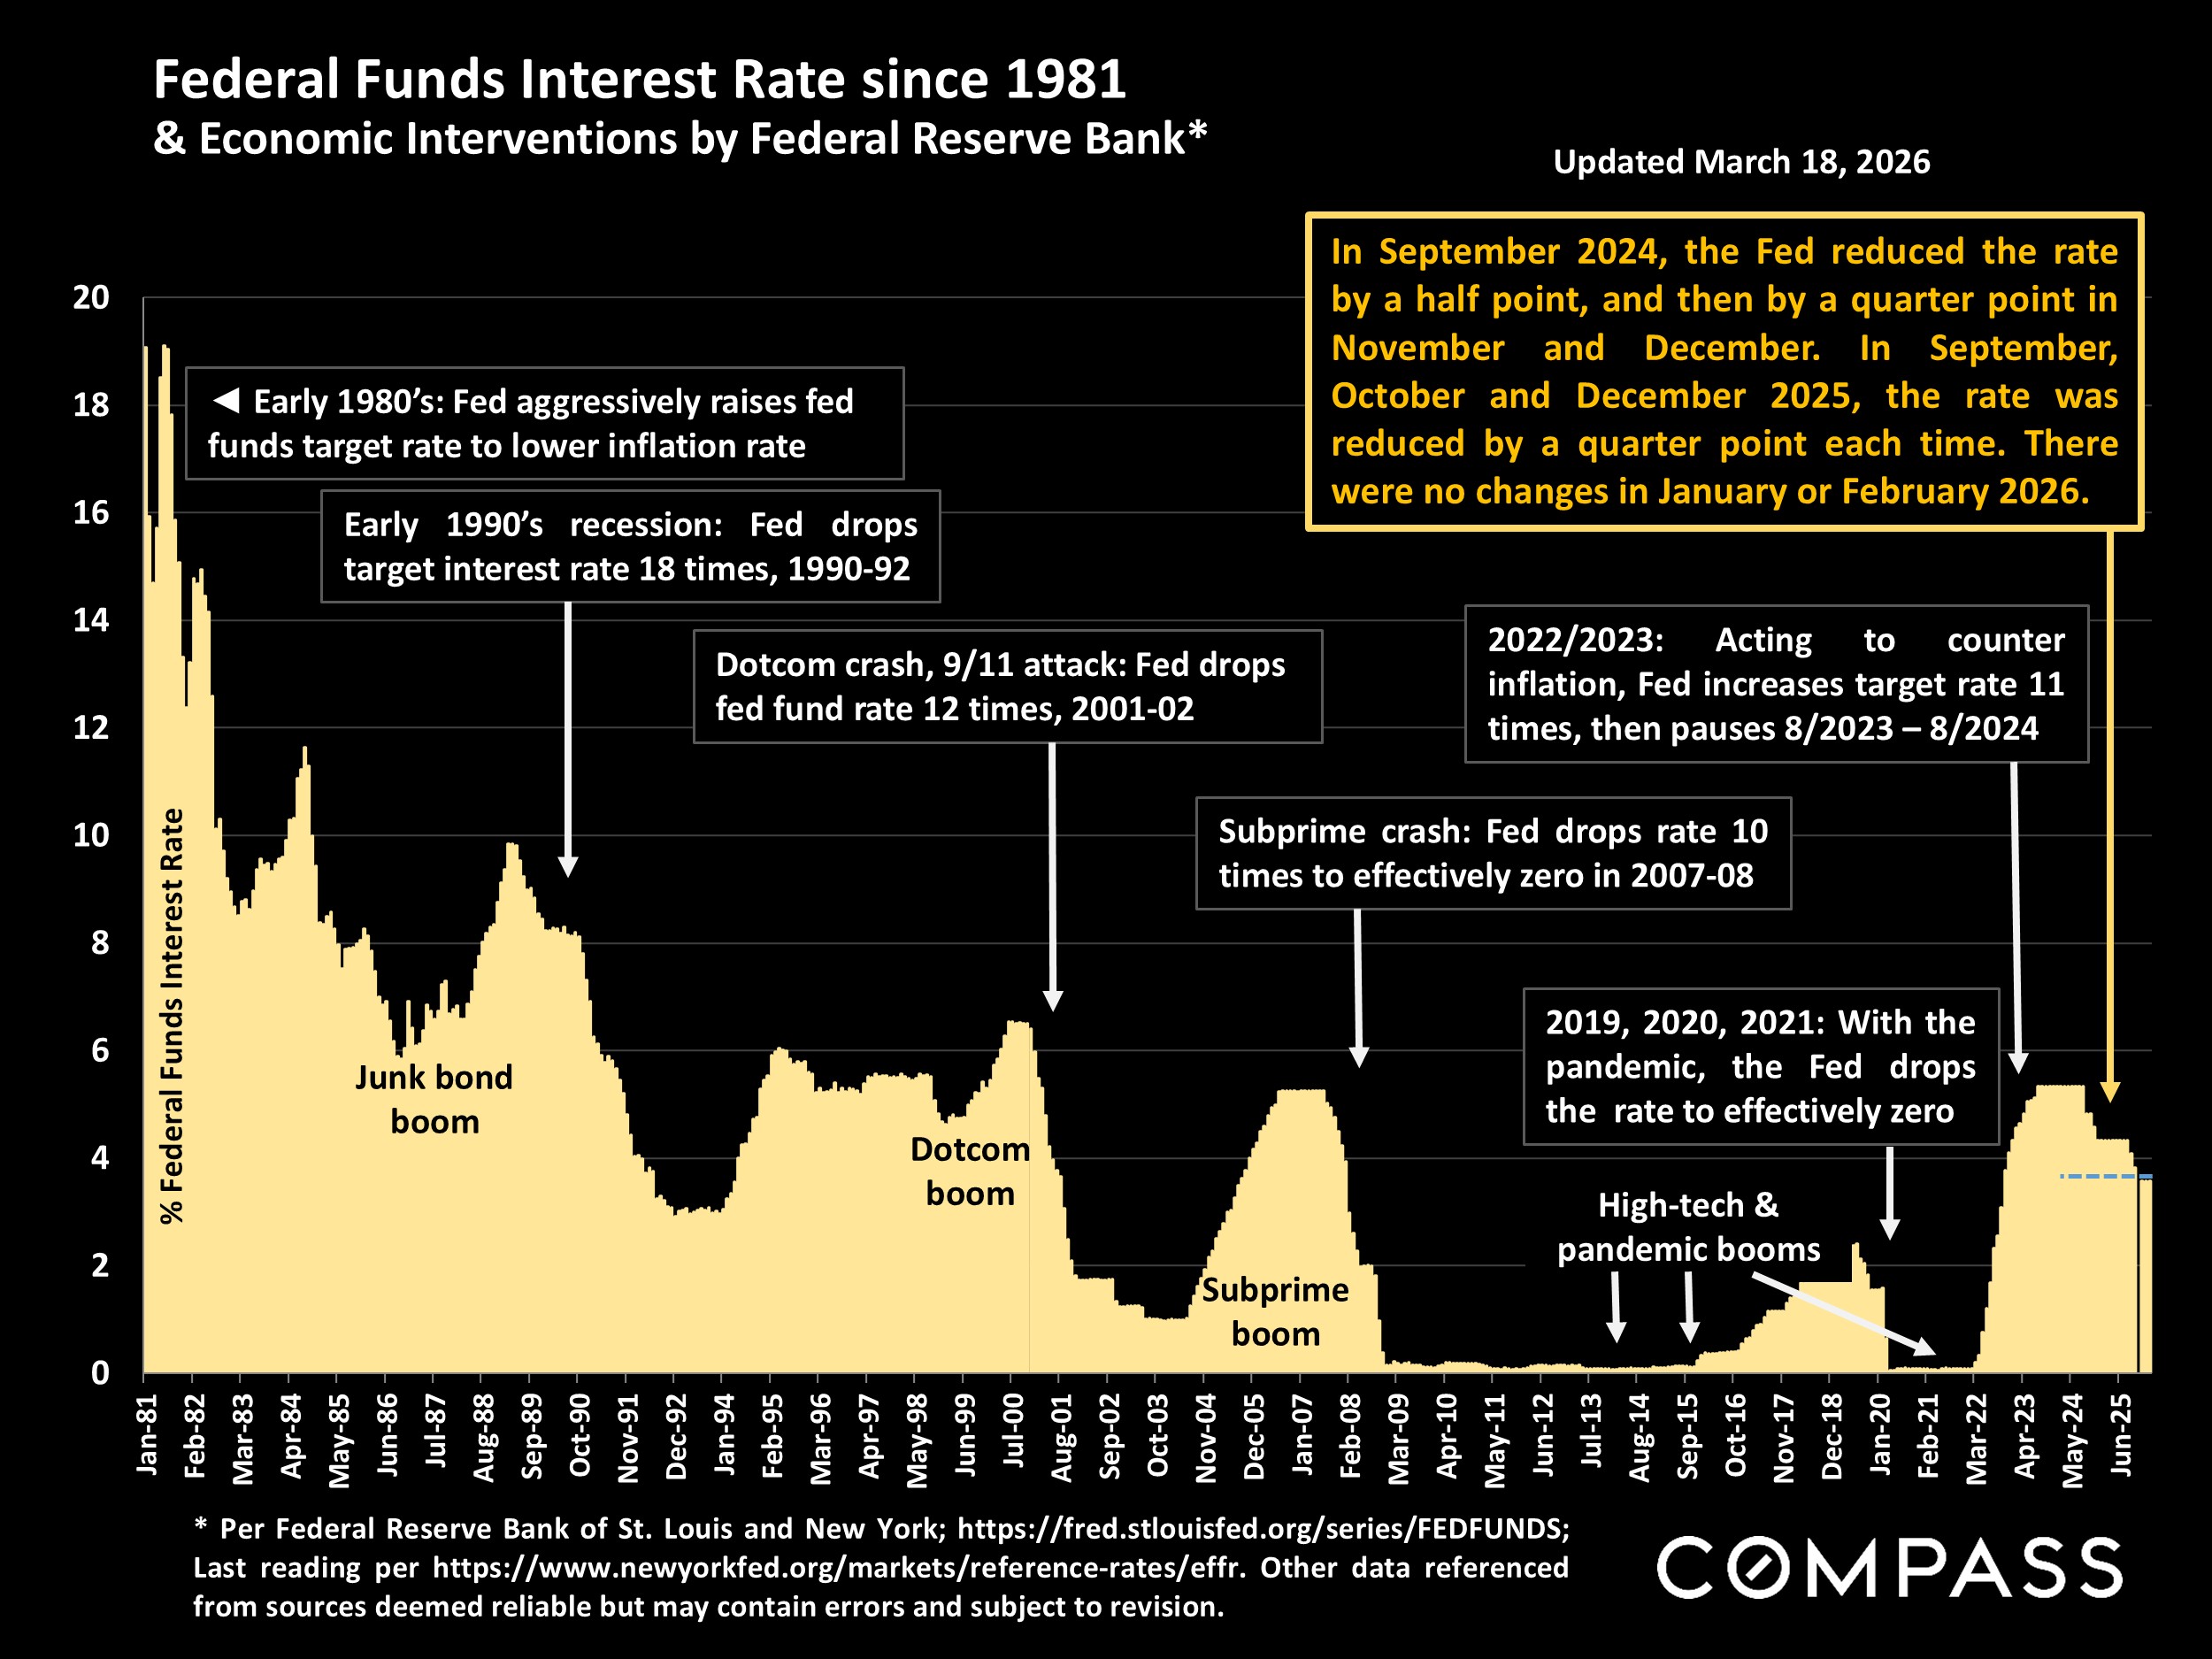
Federal Funds Interest Rate & Fed Policy
The Fed left its benchmark rate unchanged at its March meeting. In September 2024, the Fed reduced the rate by a half point, then by a quarter point in each of October, November, and December 2025. There were no changes in January or February 2026. The board currently projects 1 rate reduction in 2026 (but that can change quickly).
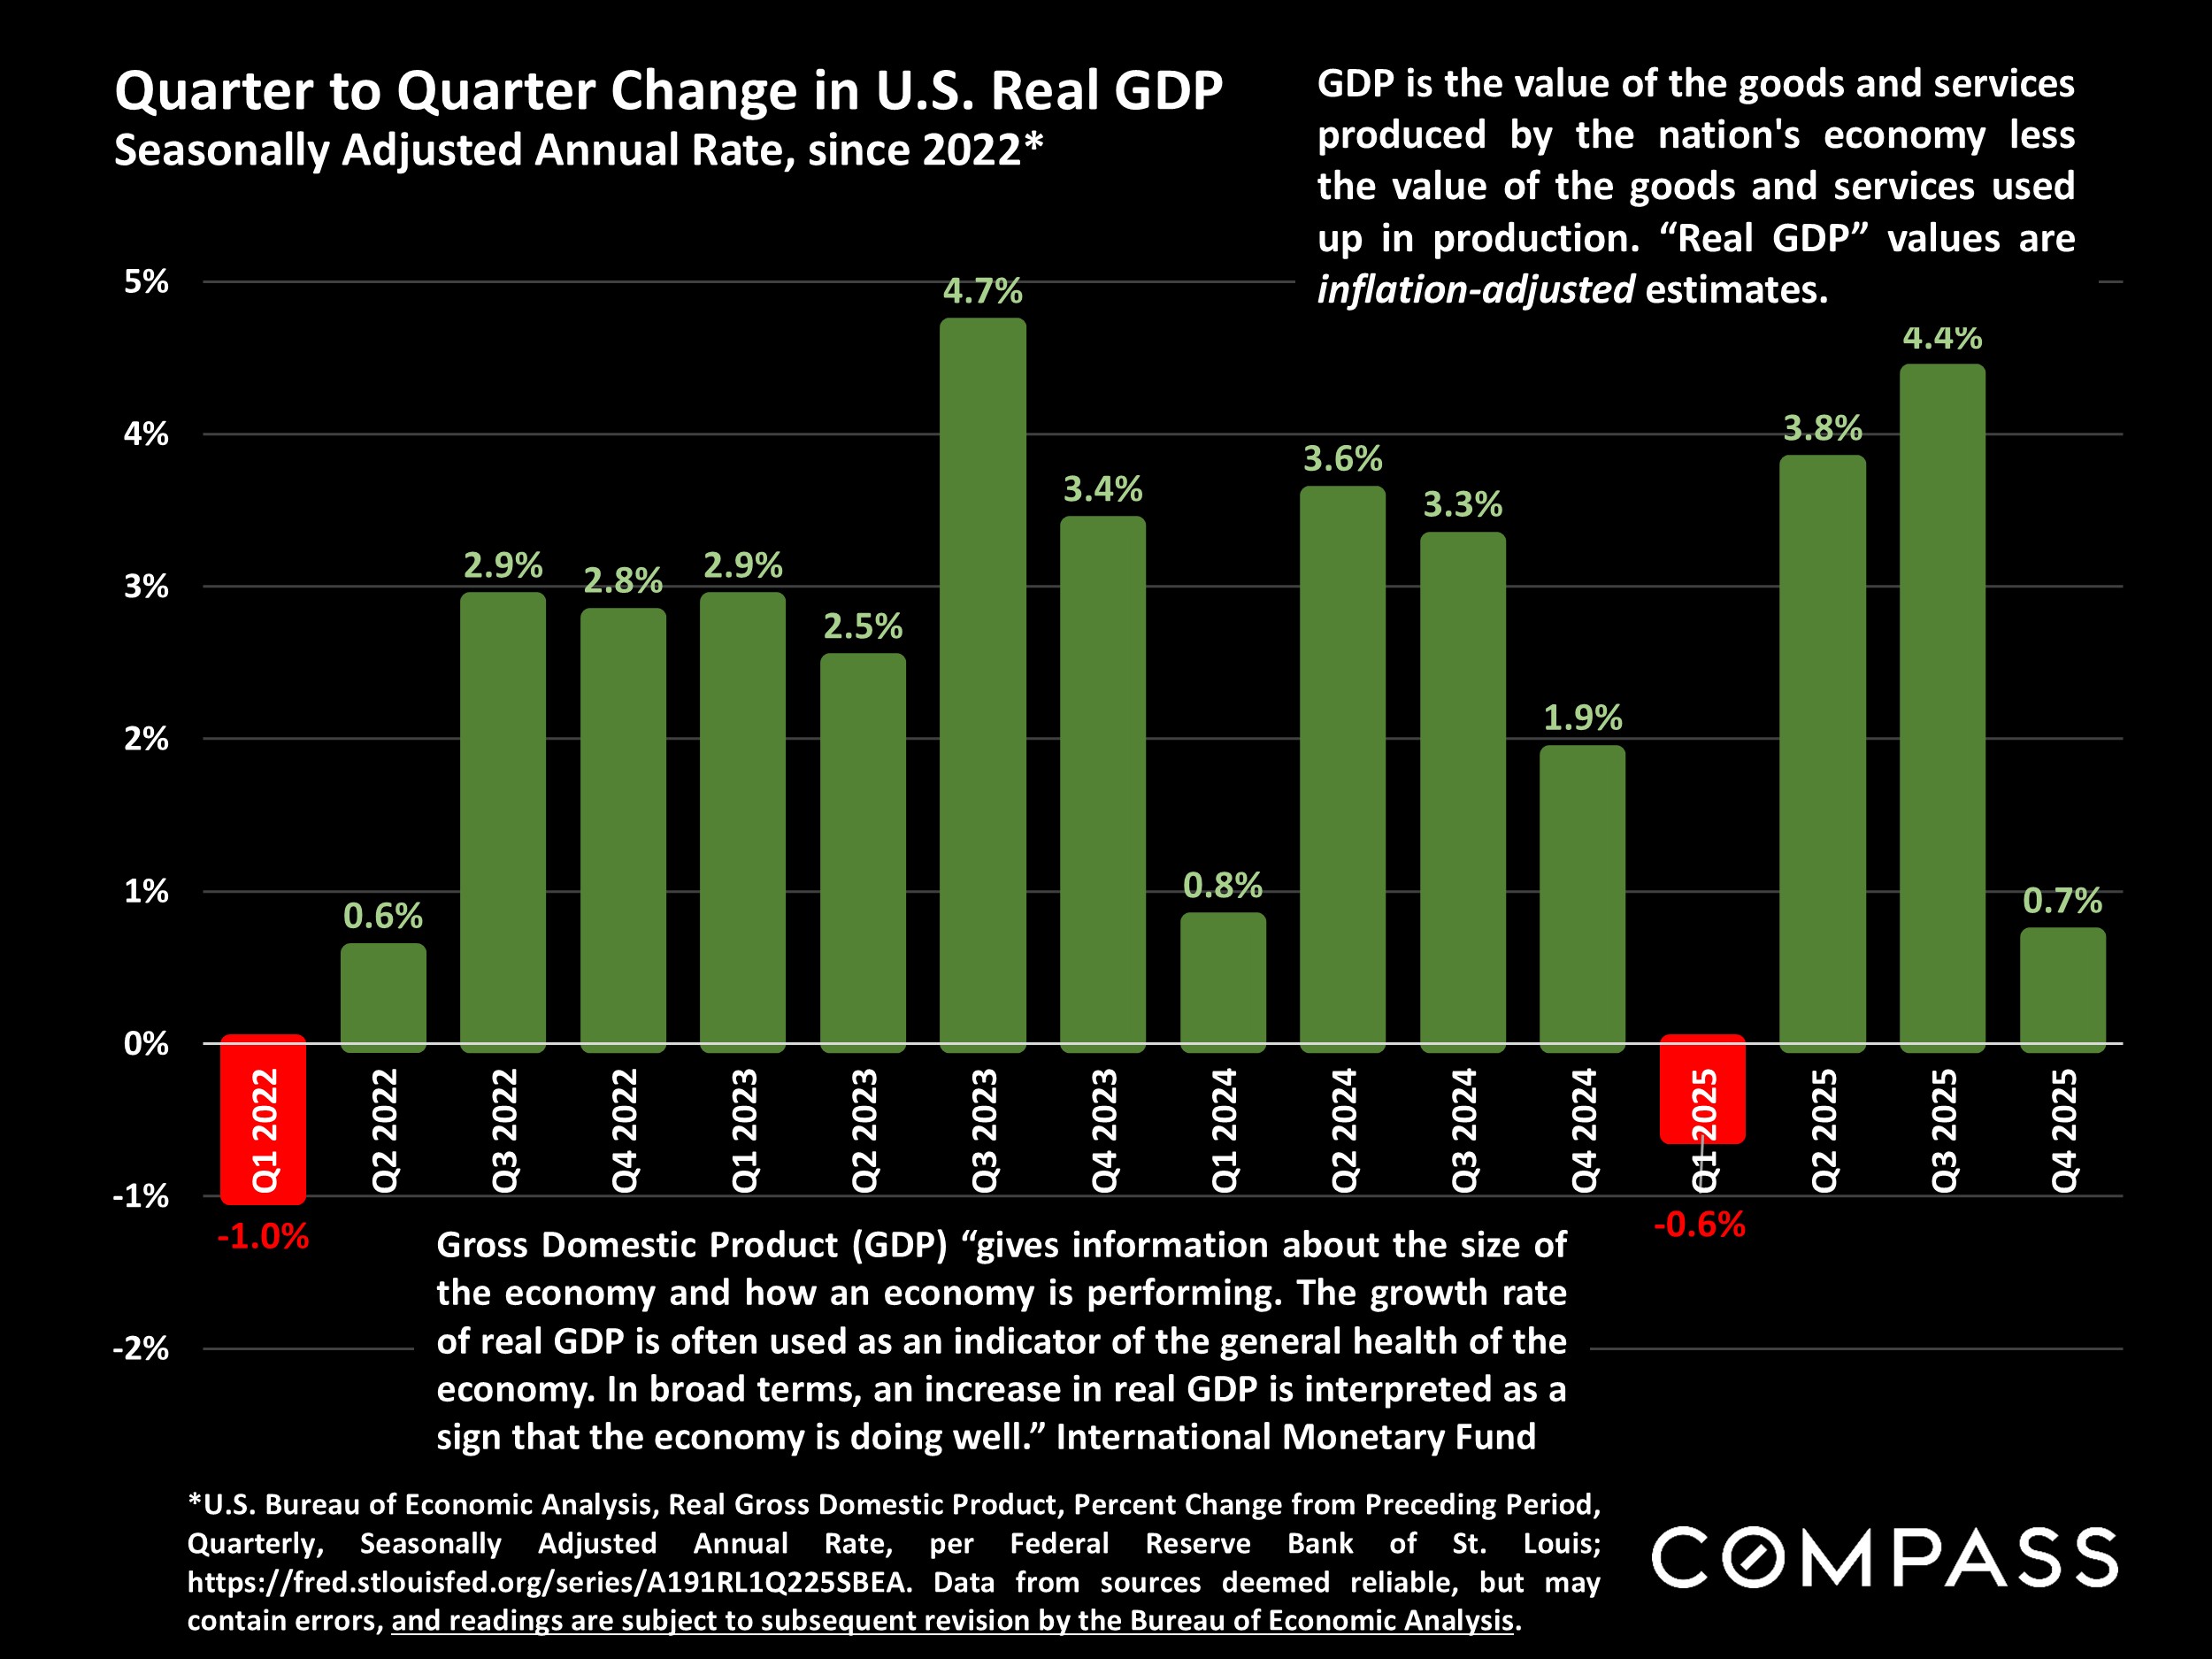
U.S. Real GDP
Q4 2025 GDP was revised significantly downward to -0.6%, following a strong Q3 reading of 4.4%.
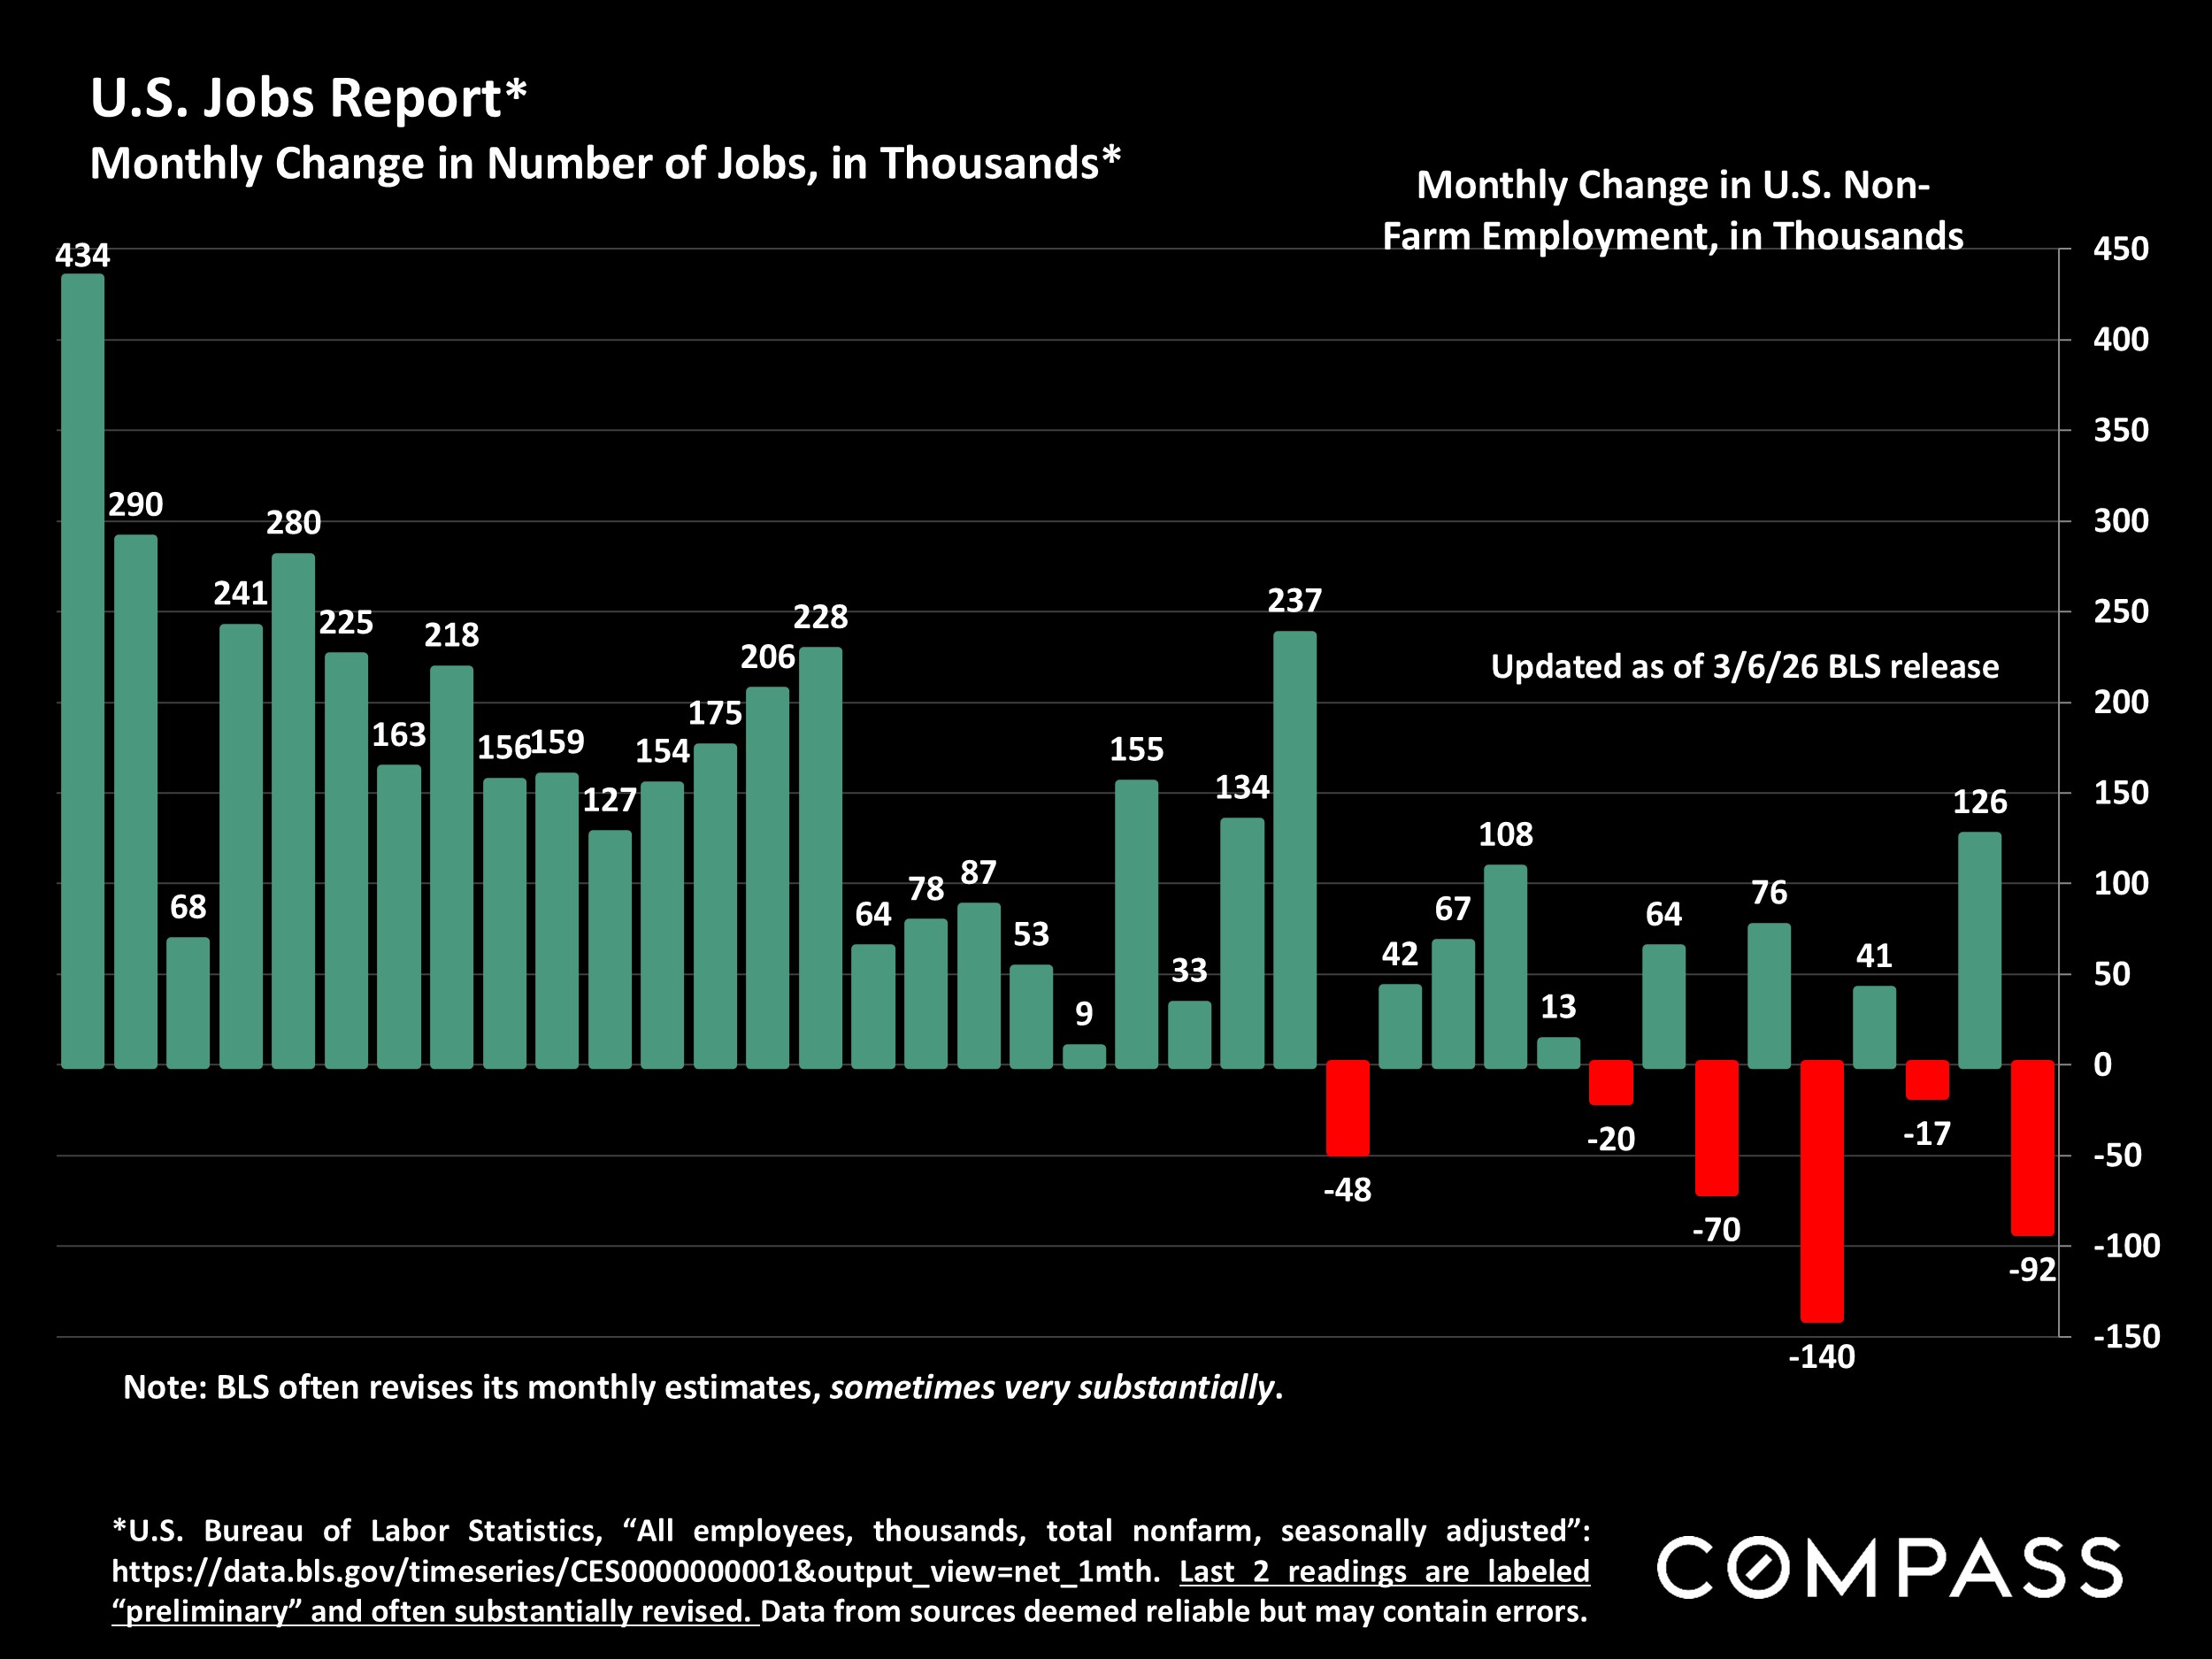
U.S. Jobs Report
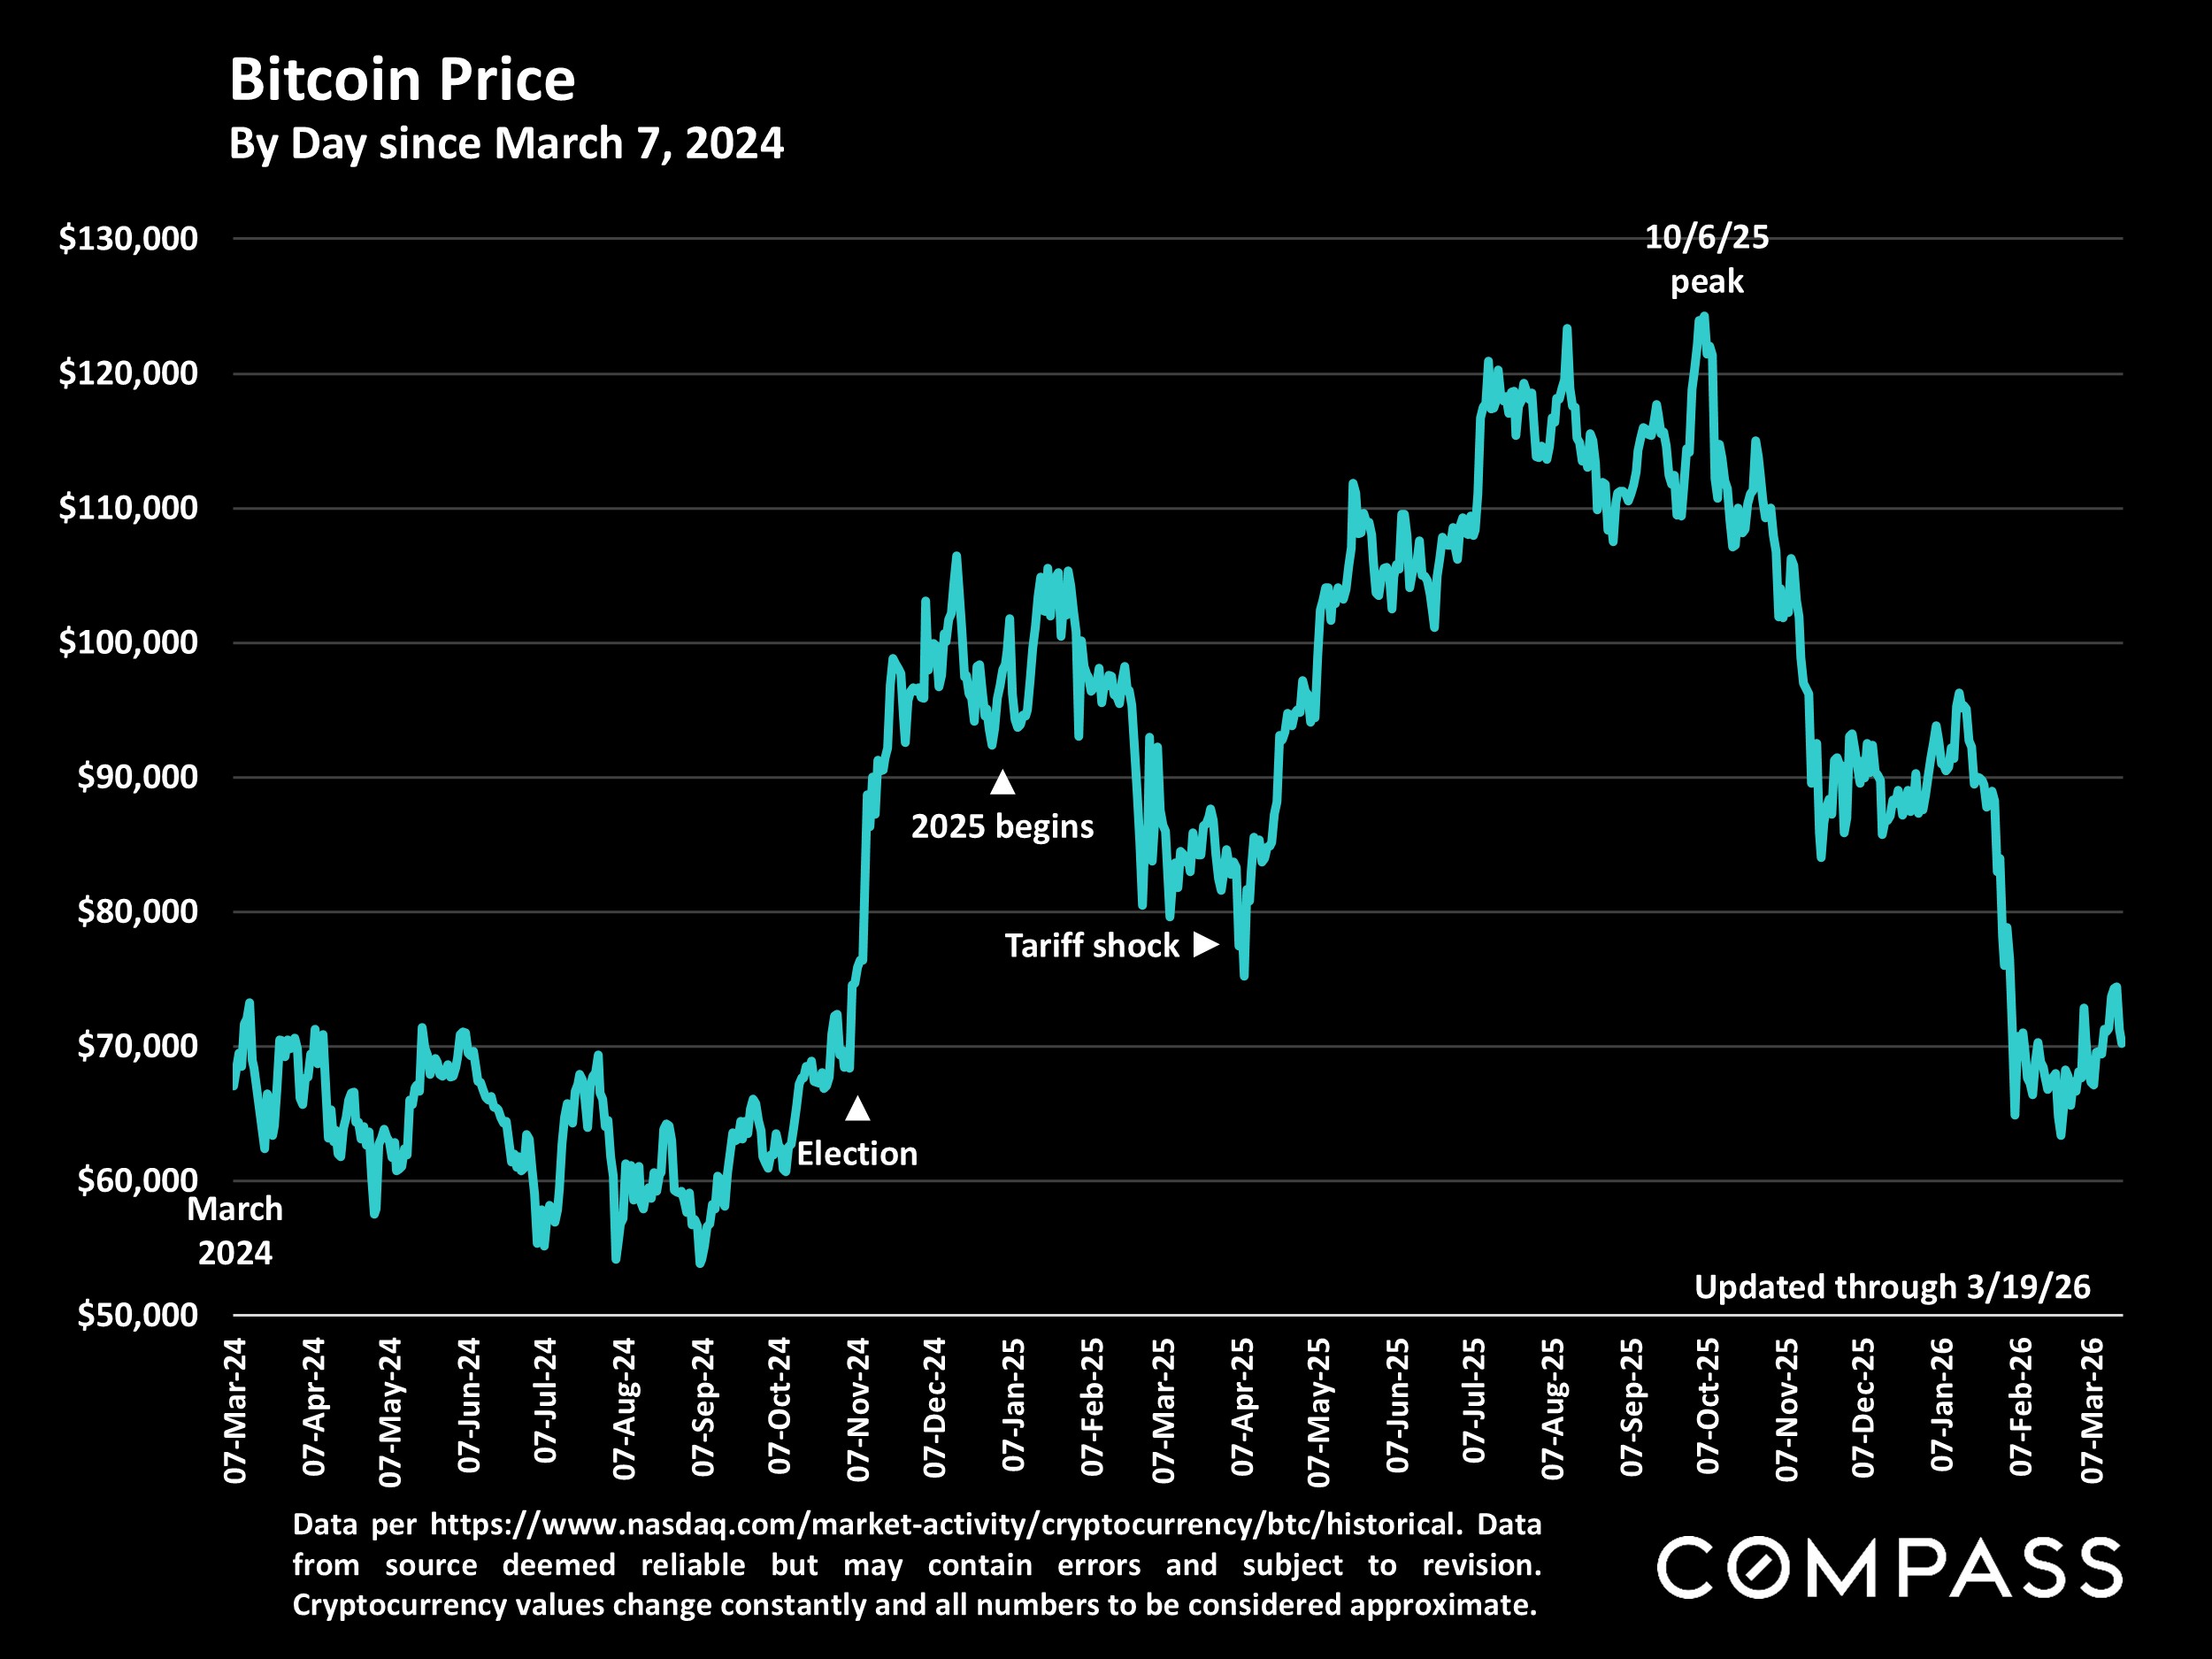
Bitcoin Price
Consumer Confidence
Consumer confidence remains very low, and we do not yet have a reading reflecting the reaction to the war.
Have questions about what the numbers mean for your specific situation? Reach out—we’re always happy to discuss what the market is doing and how it affects your goals.
Broker Associate | REALTOR® | Team Leader | DRE 01913767
Faber Real Estate Team | Compass
(415) 686-4980 | FaberRealEstateTeam.com
250 E Blithedale Ste D, Mill Valley, CA 94941