12 Months since Shelter-in-Place - Bay Area Report
New survey of Bay Area real estate in the year since the pandemic hit

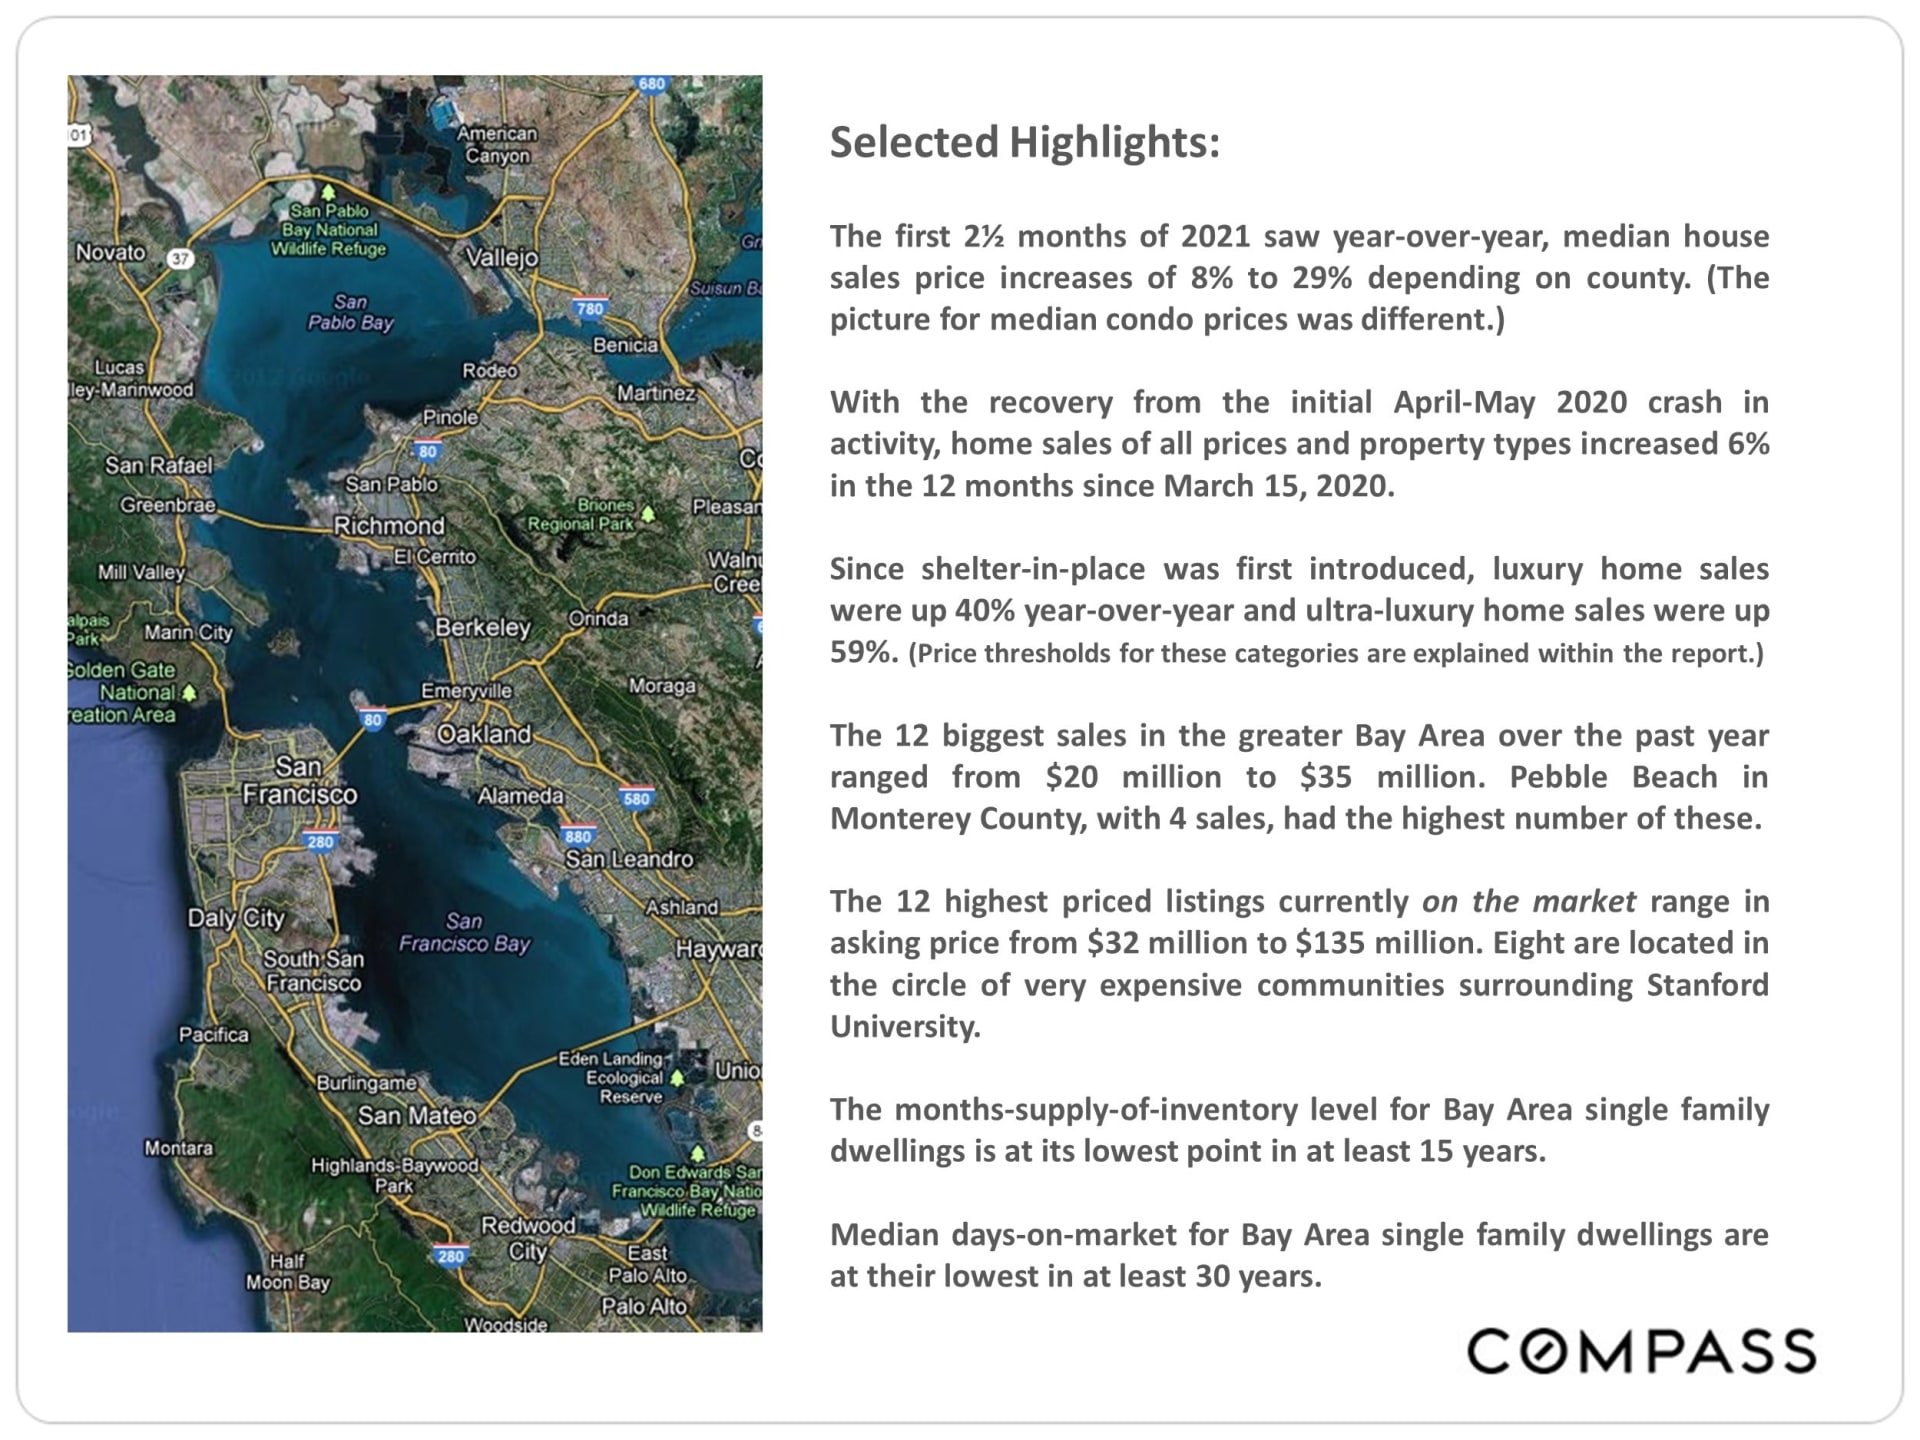
Selected Highlights:
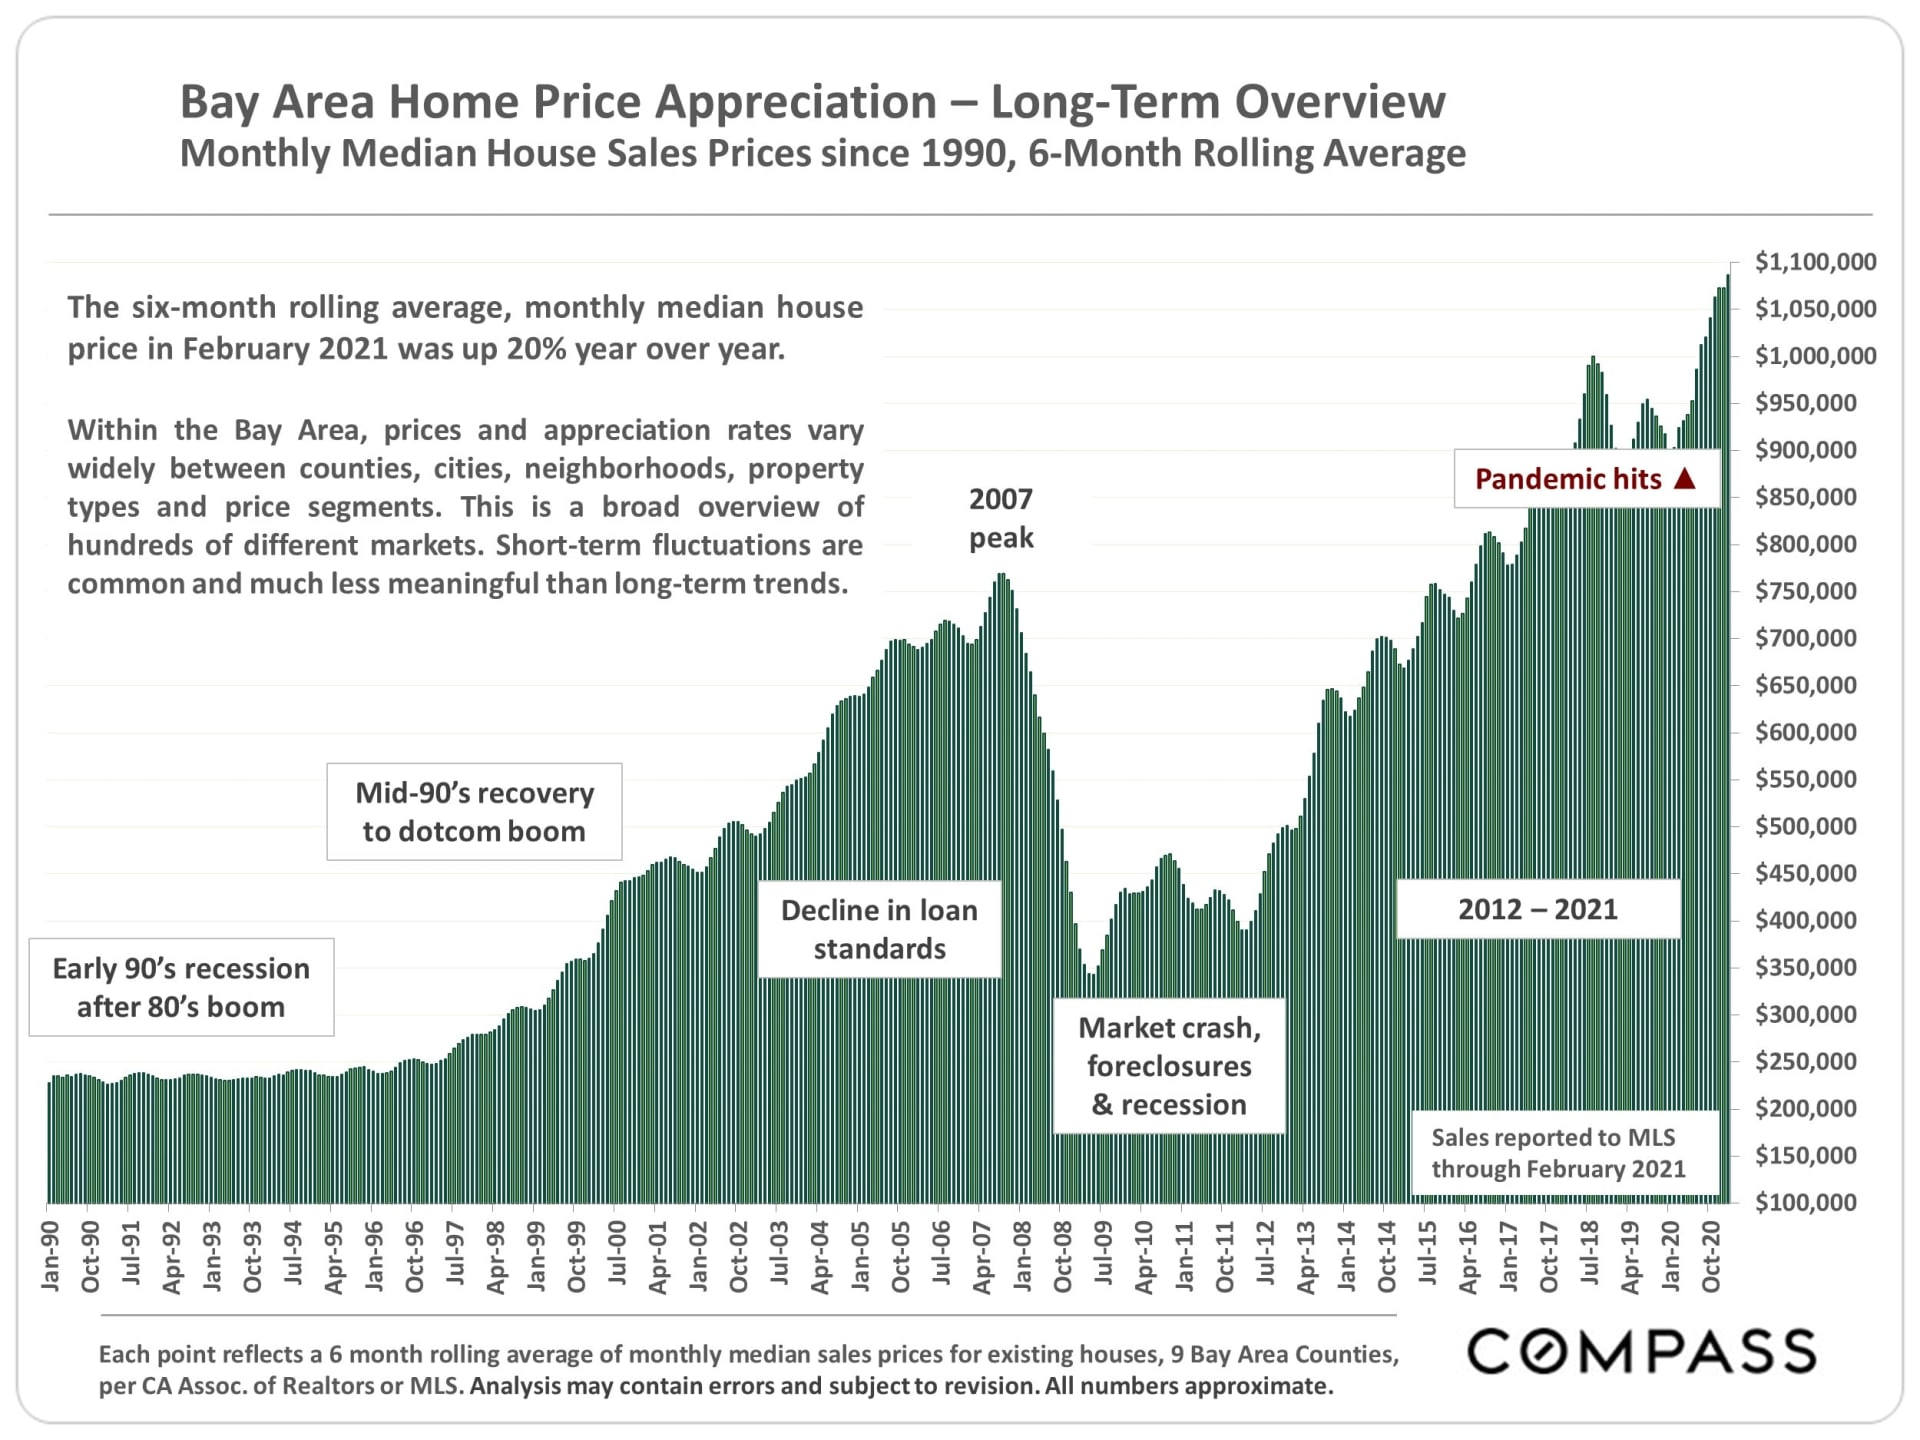
Bay Area Home Appreciation - Long Term Overview
Monthly Median House Sales Prices since 1990, 6-Month rolling Average
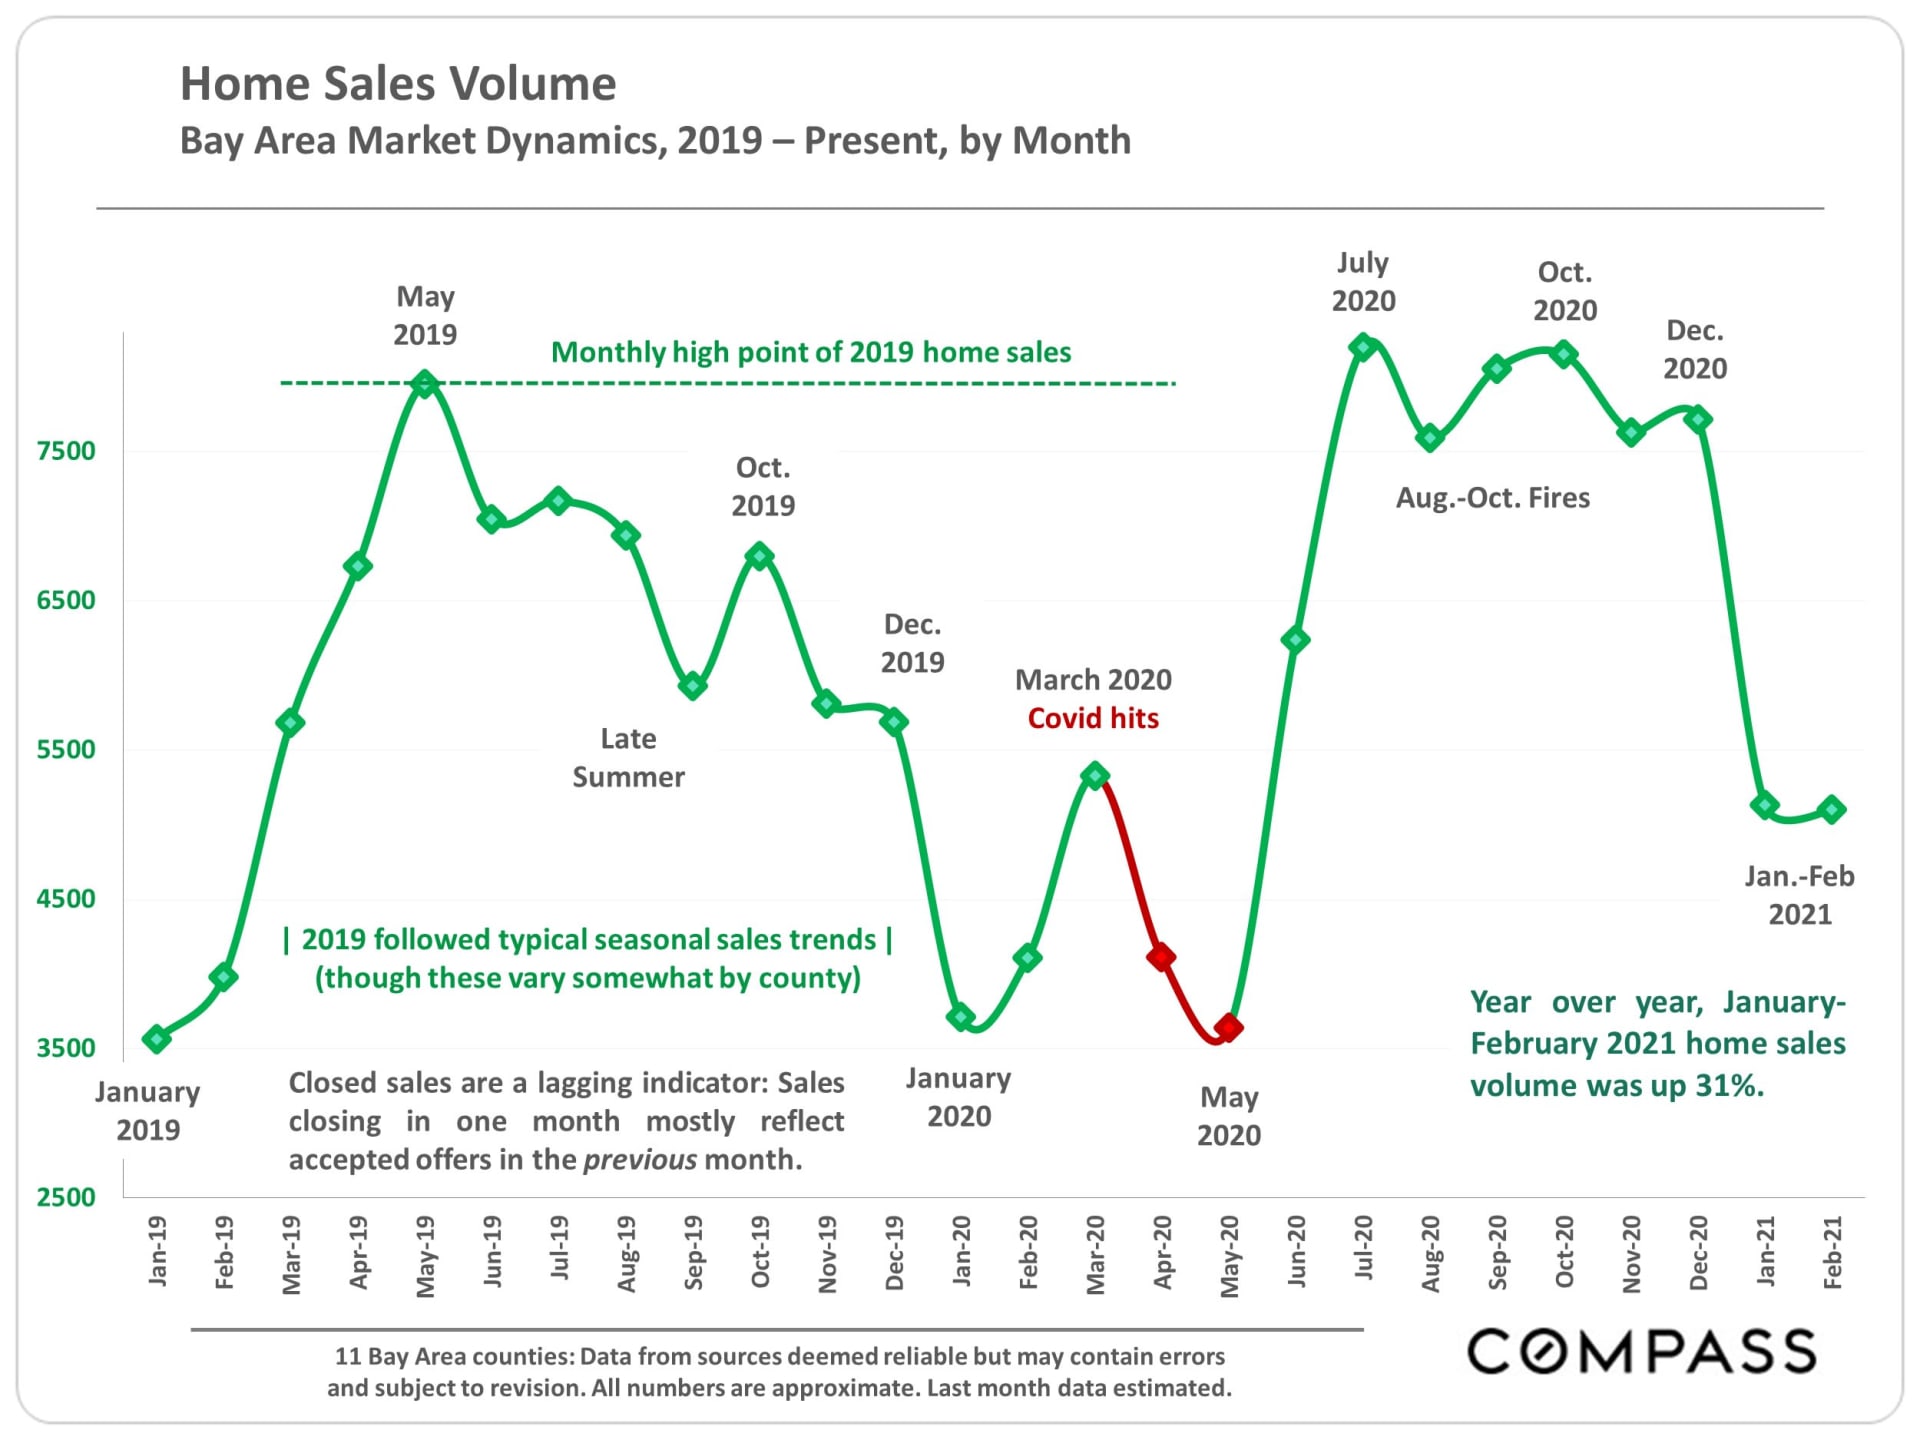
Home Sales Volume
Bay Area Market Dynamics, 2019 - Present, by month
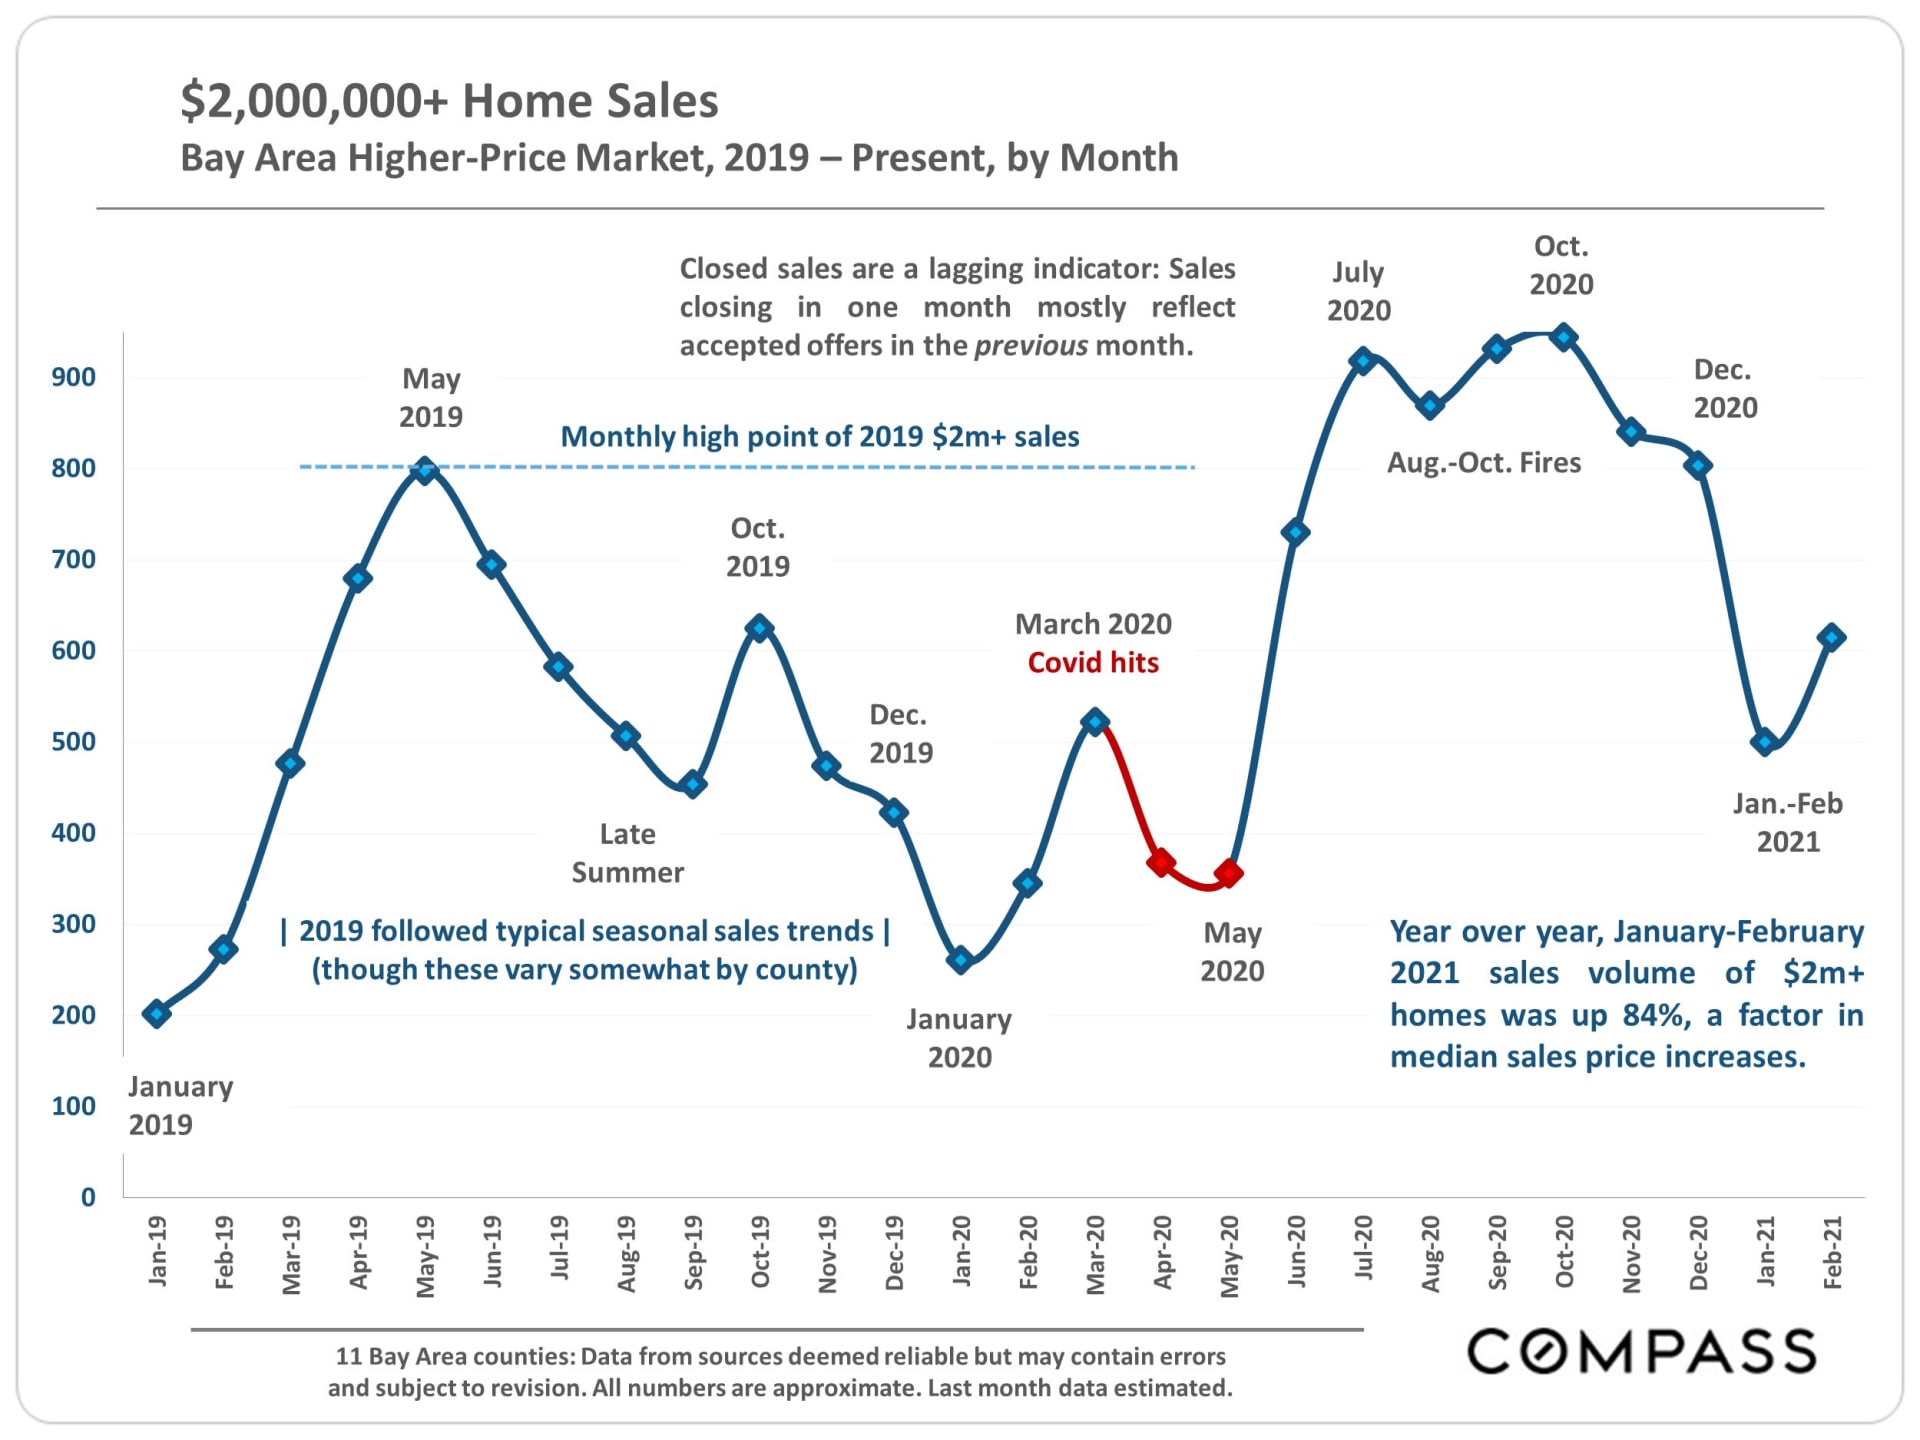
$2,000,000+ Home Sales
Bay Area Higher-Price Market, 2019 - Present, by Month
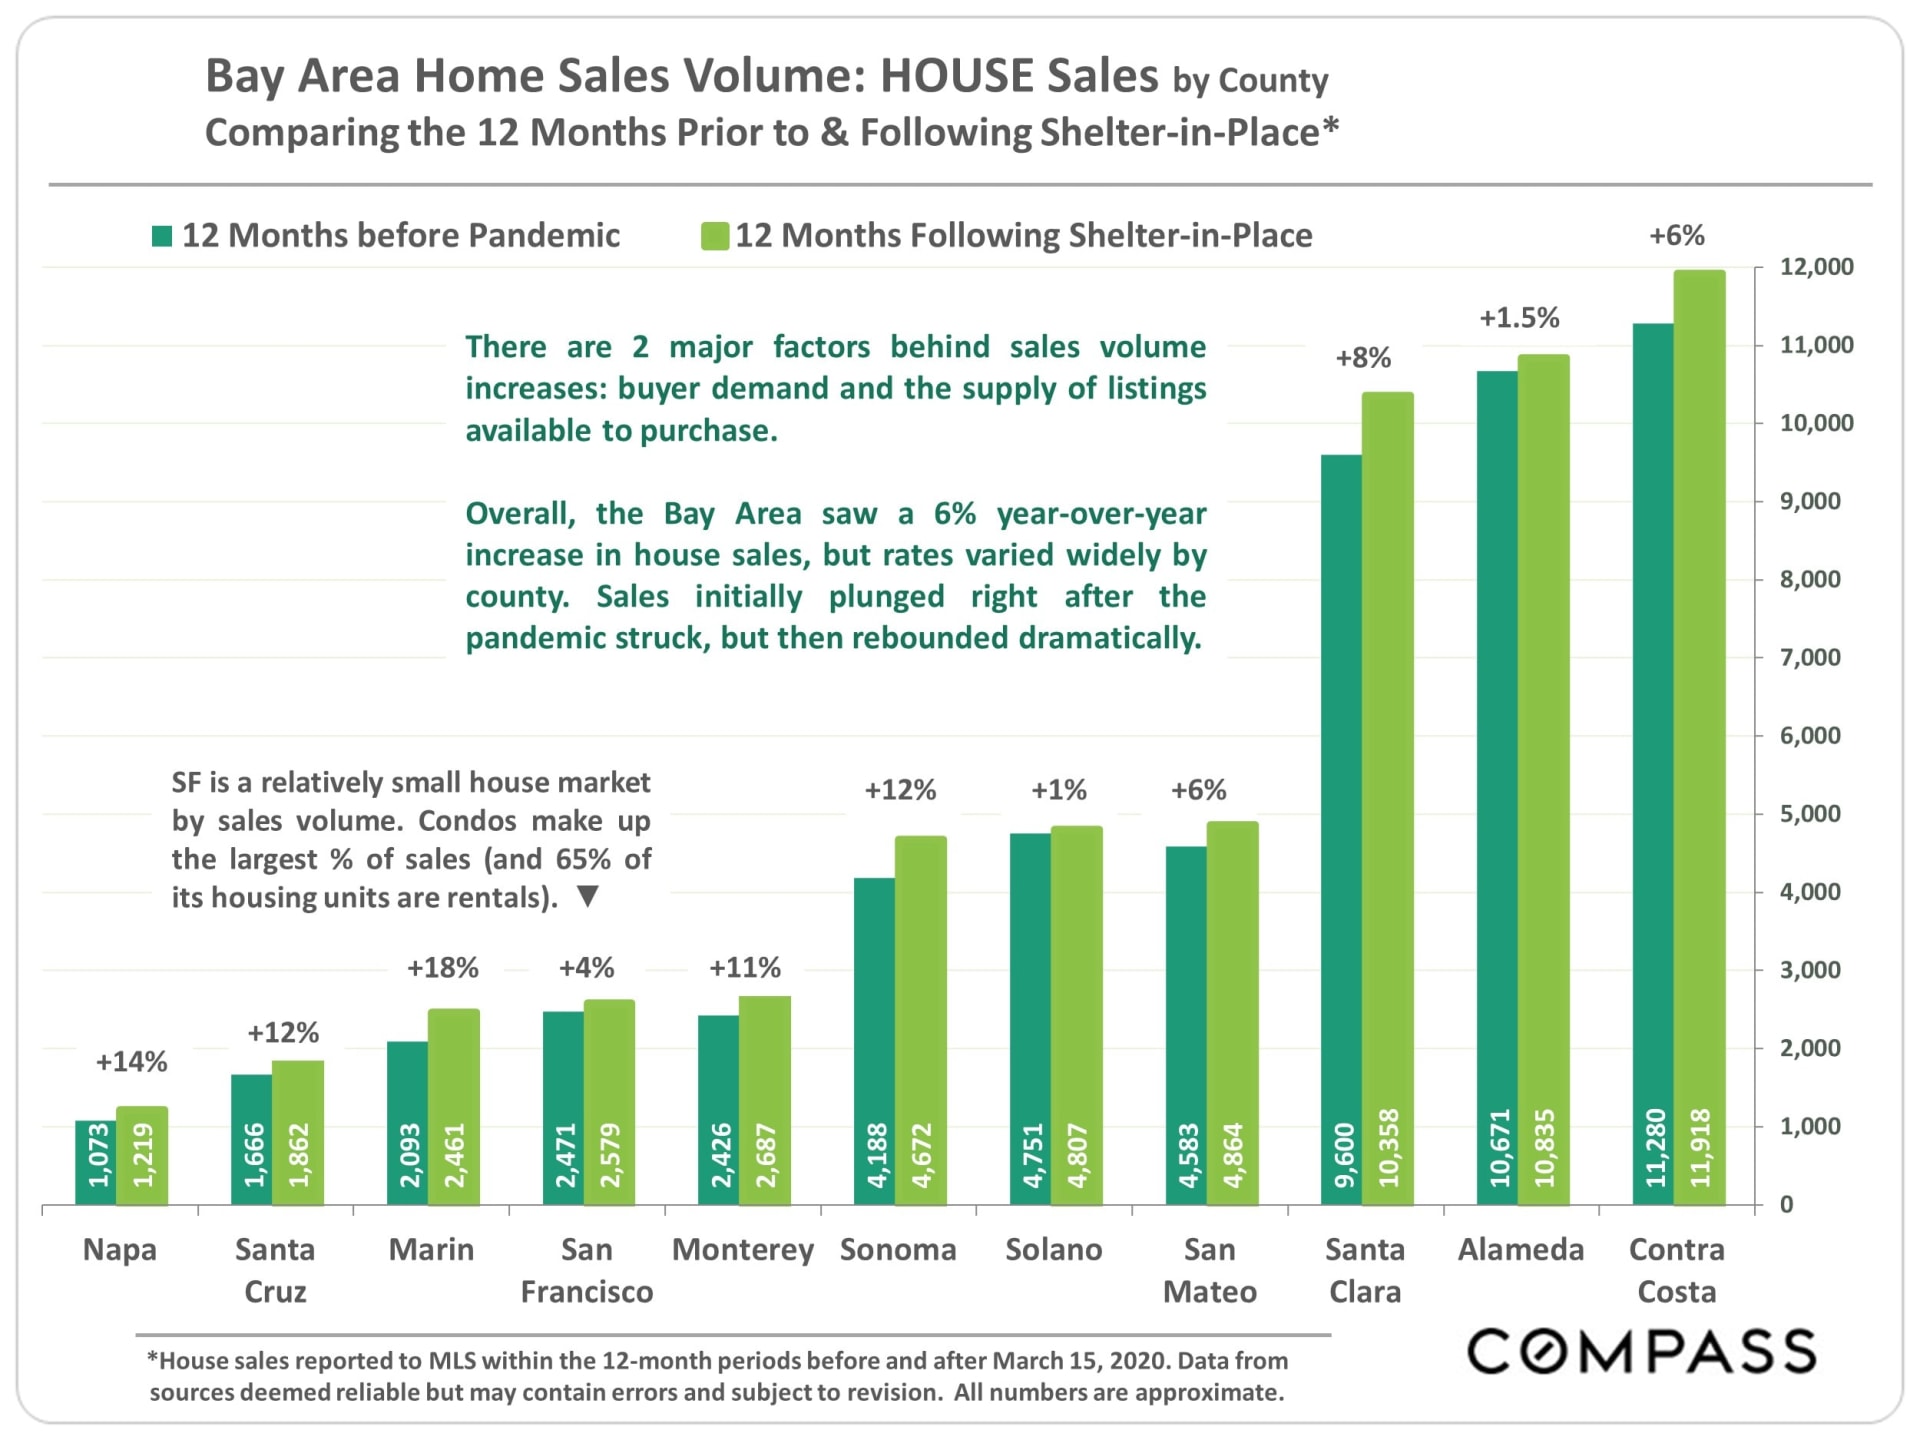
Bay Area Home Sales Volume: HOUSE Sales by County
Comparing the 12 Months prior to & Following Shelter-in-Place*
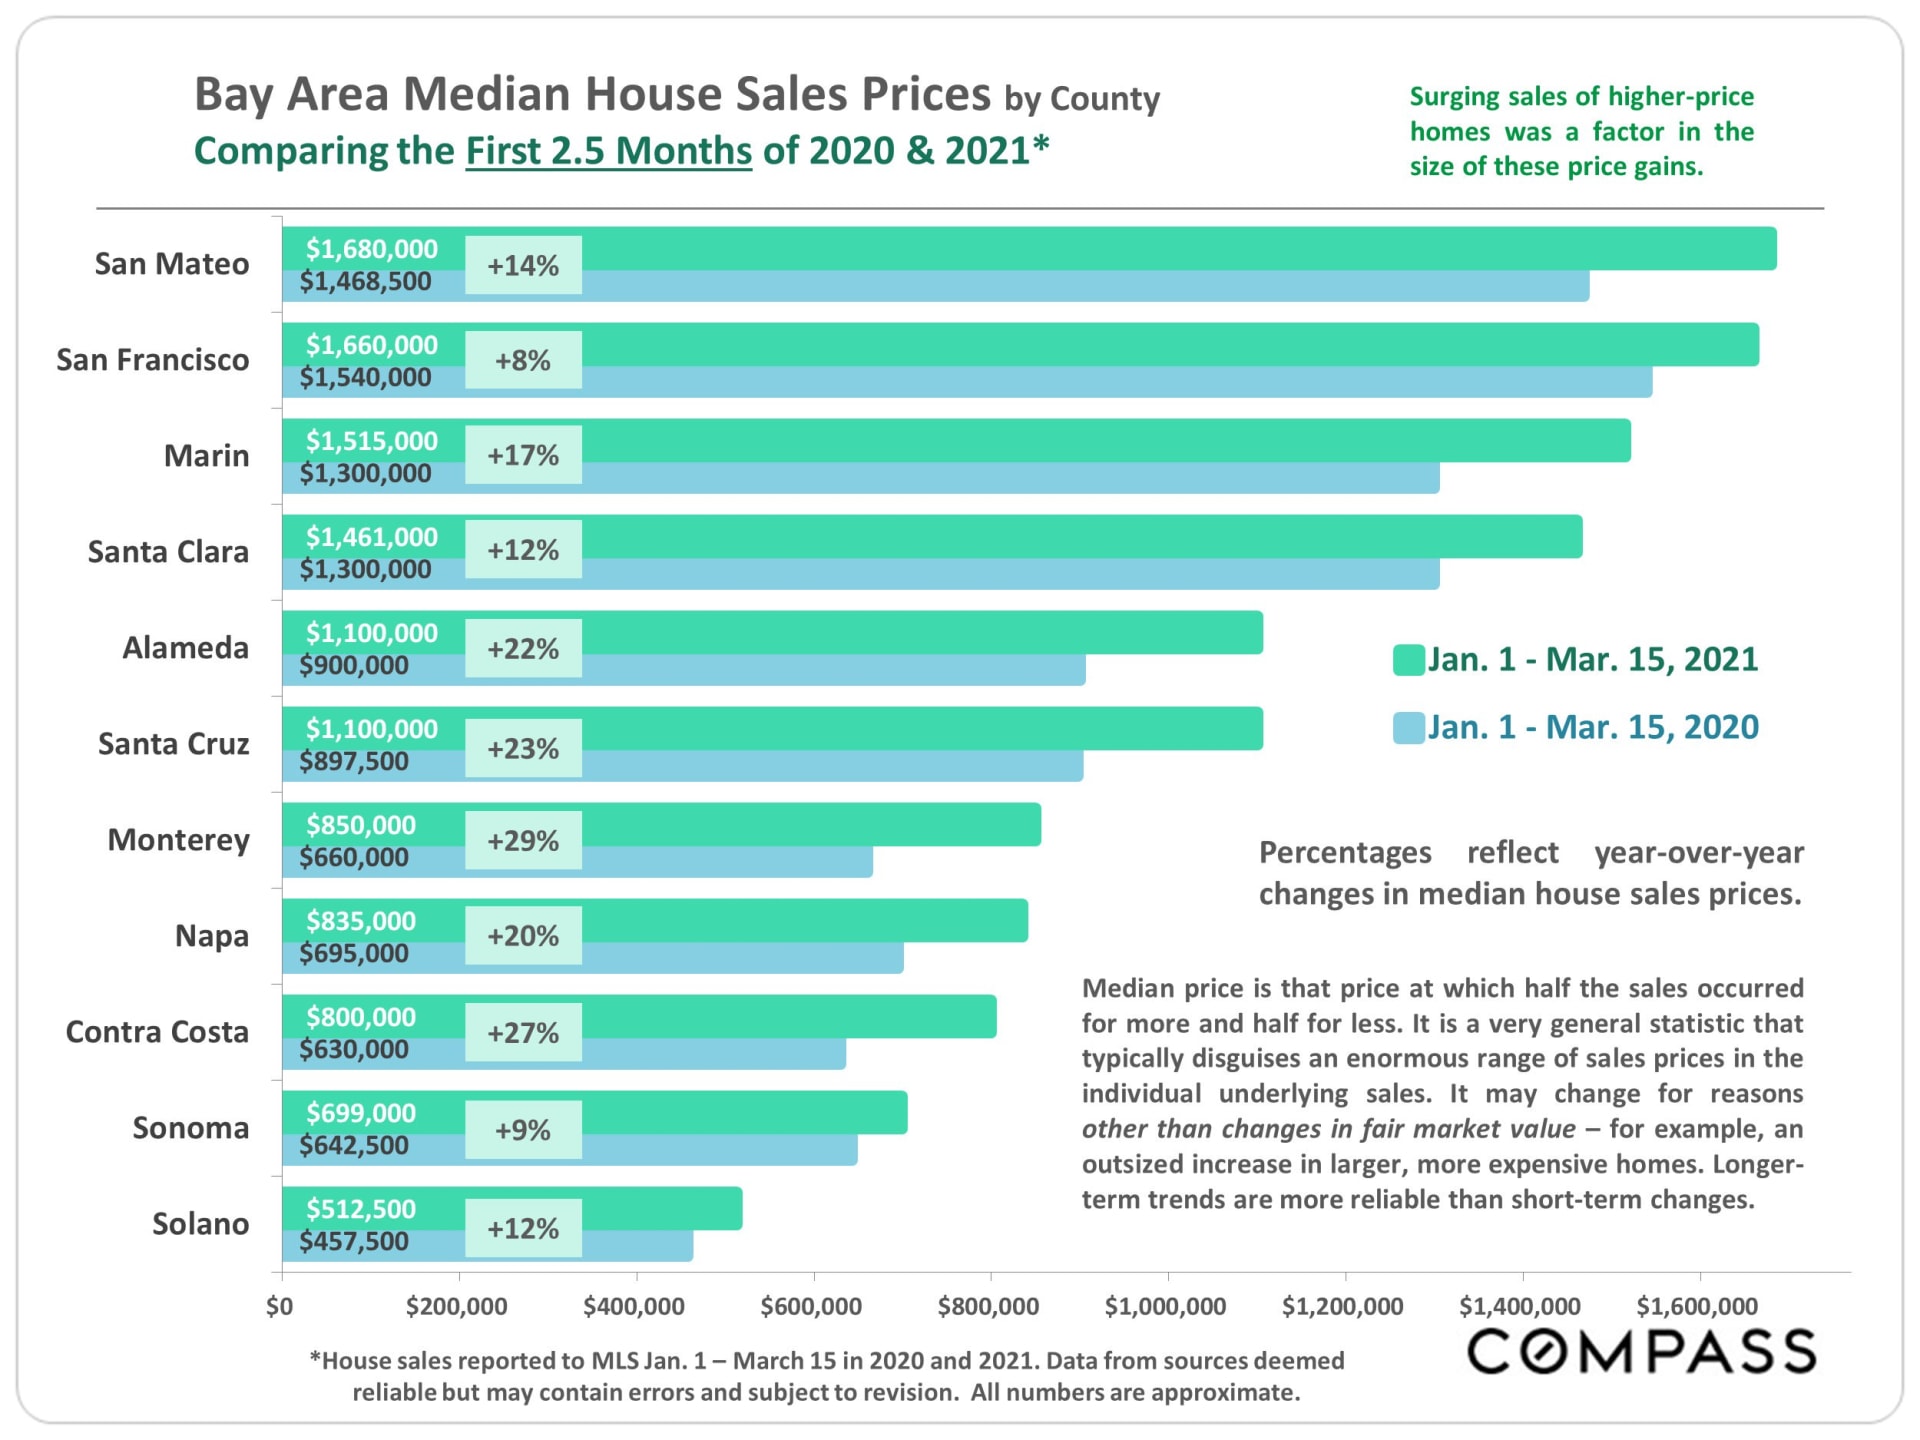
Bay Area Median House Sales Prices by County
Comparing the First 2.5 Months of 2020 & 2021
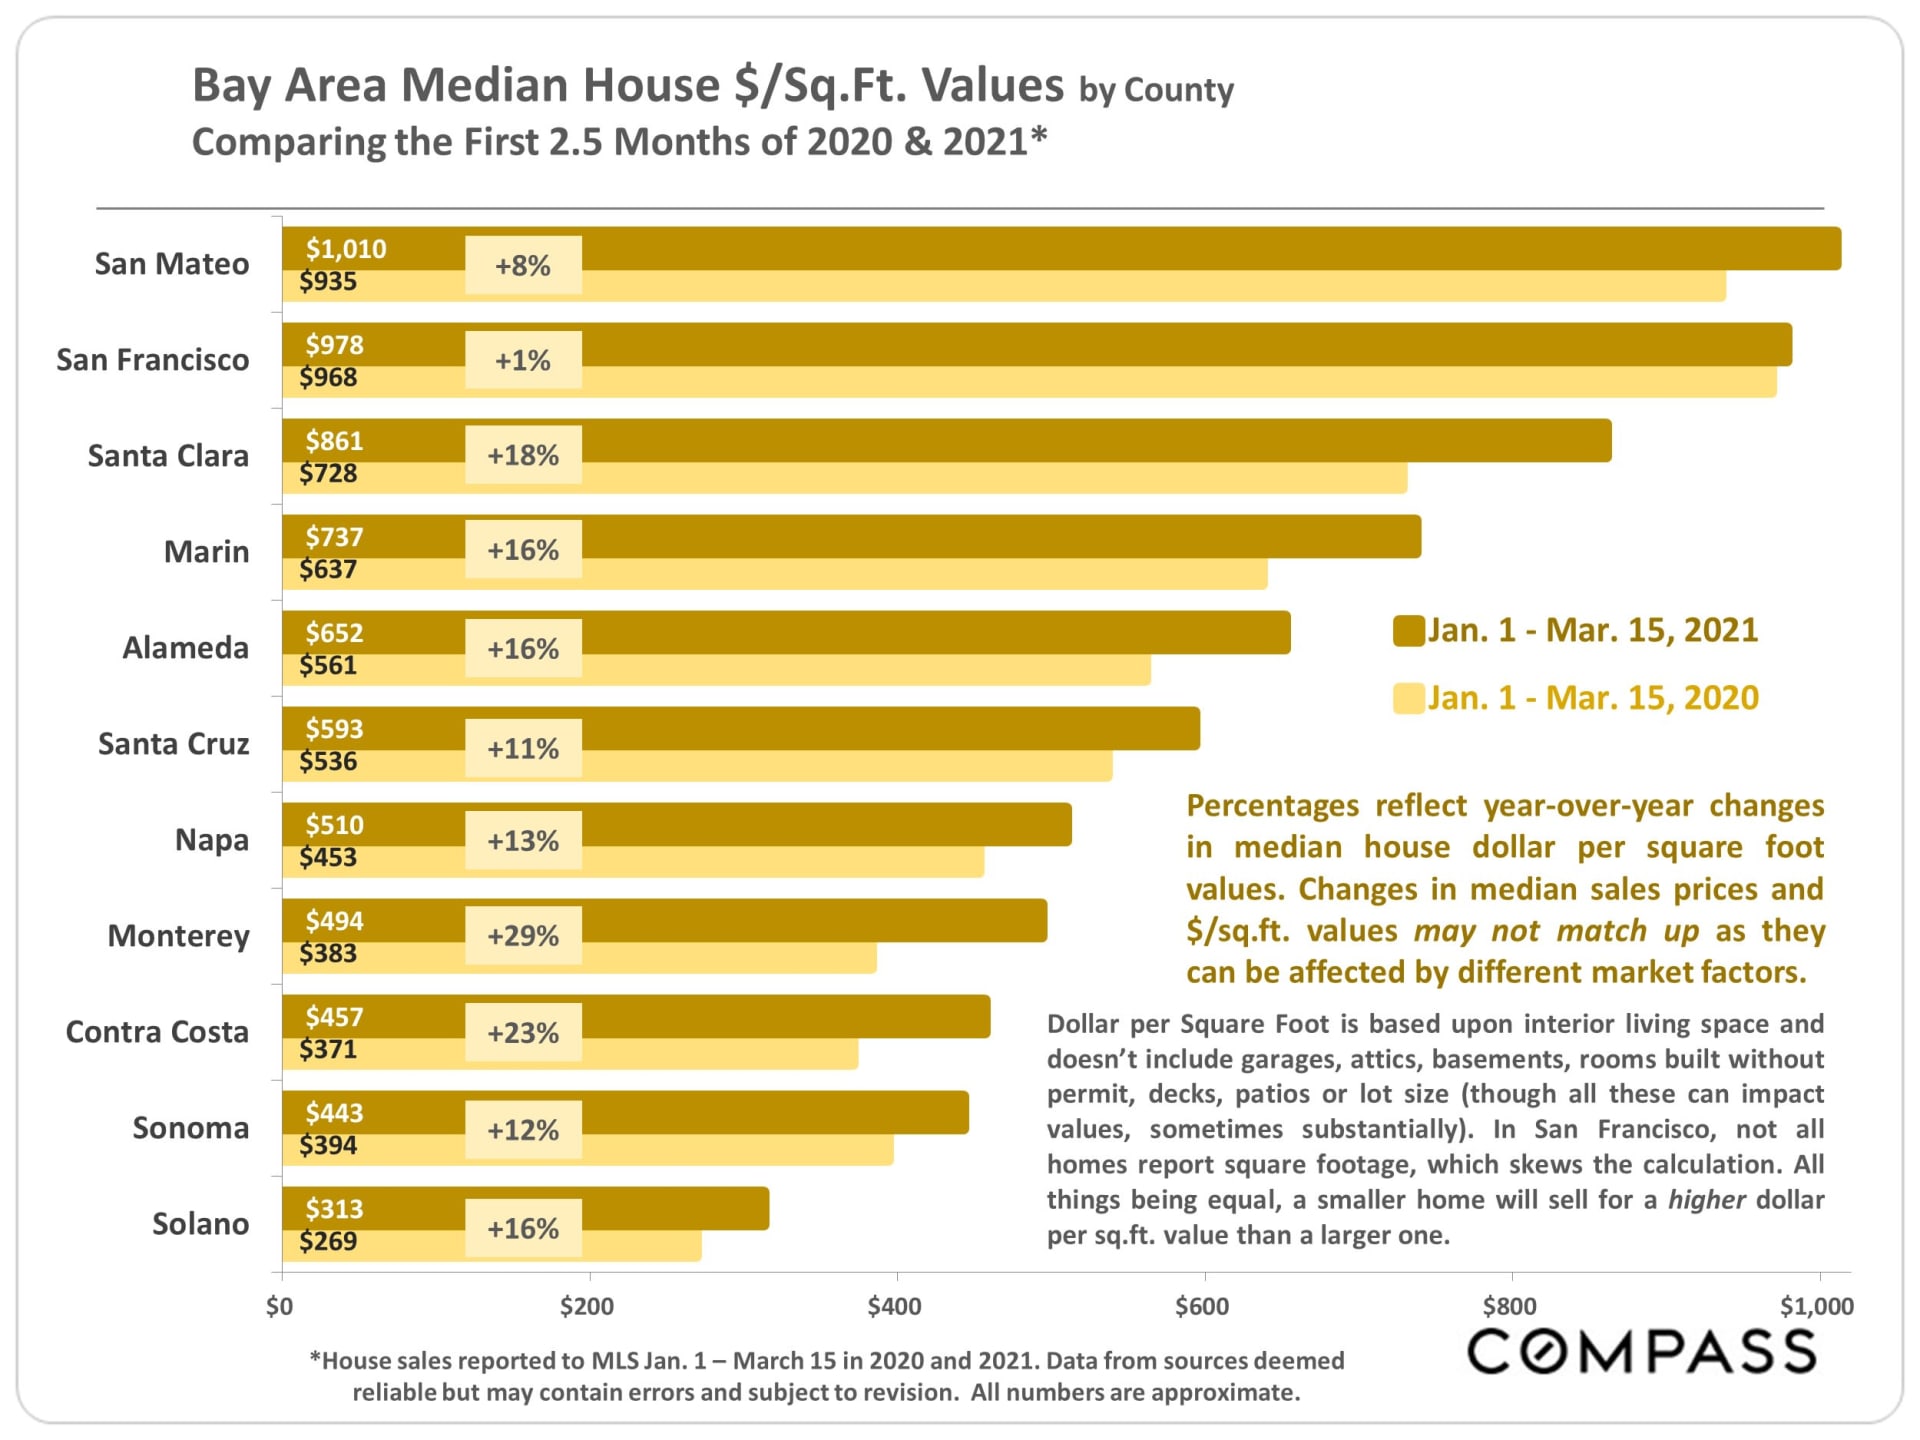
Bay Area Median House $/Sq.Ft. Values by County
Comparing the First 2.5 Months of 2020 & 2021*
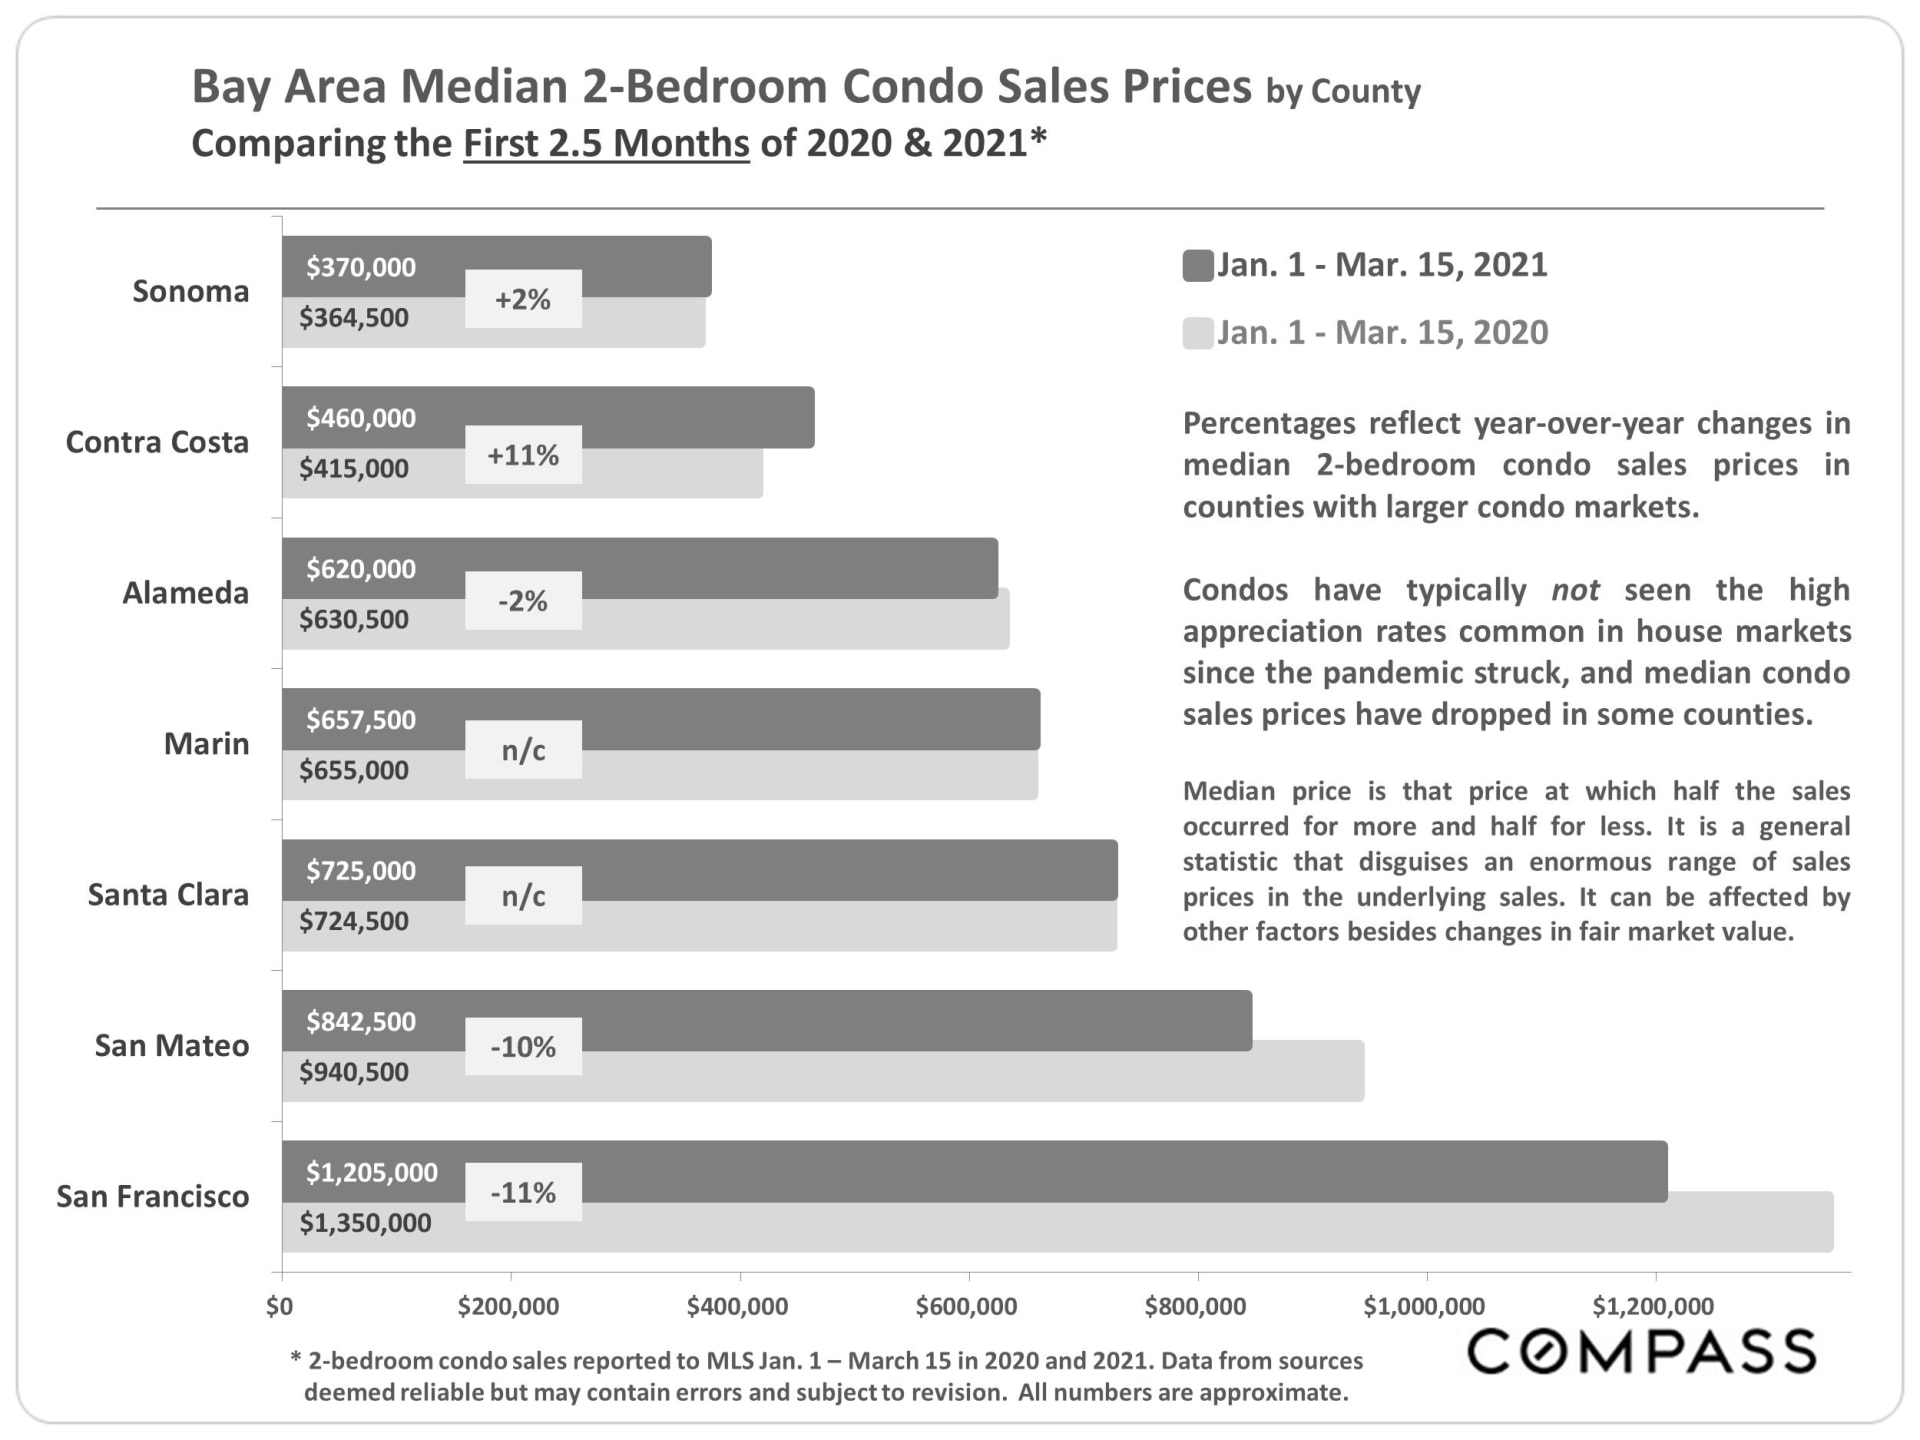
Bay Area Median 2-Bedroom Condo Sales Prices by County
Comparing the First 2.5 Months of 2020 & 2021*
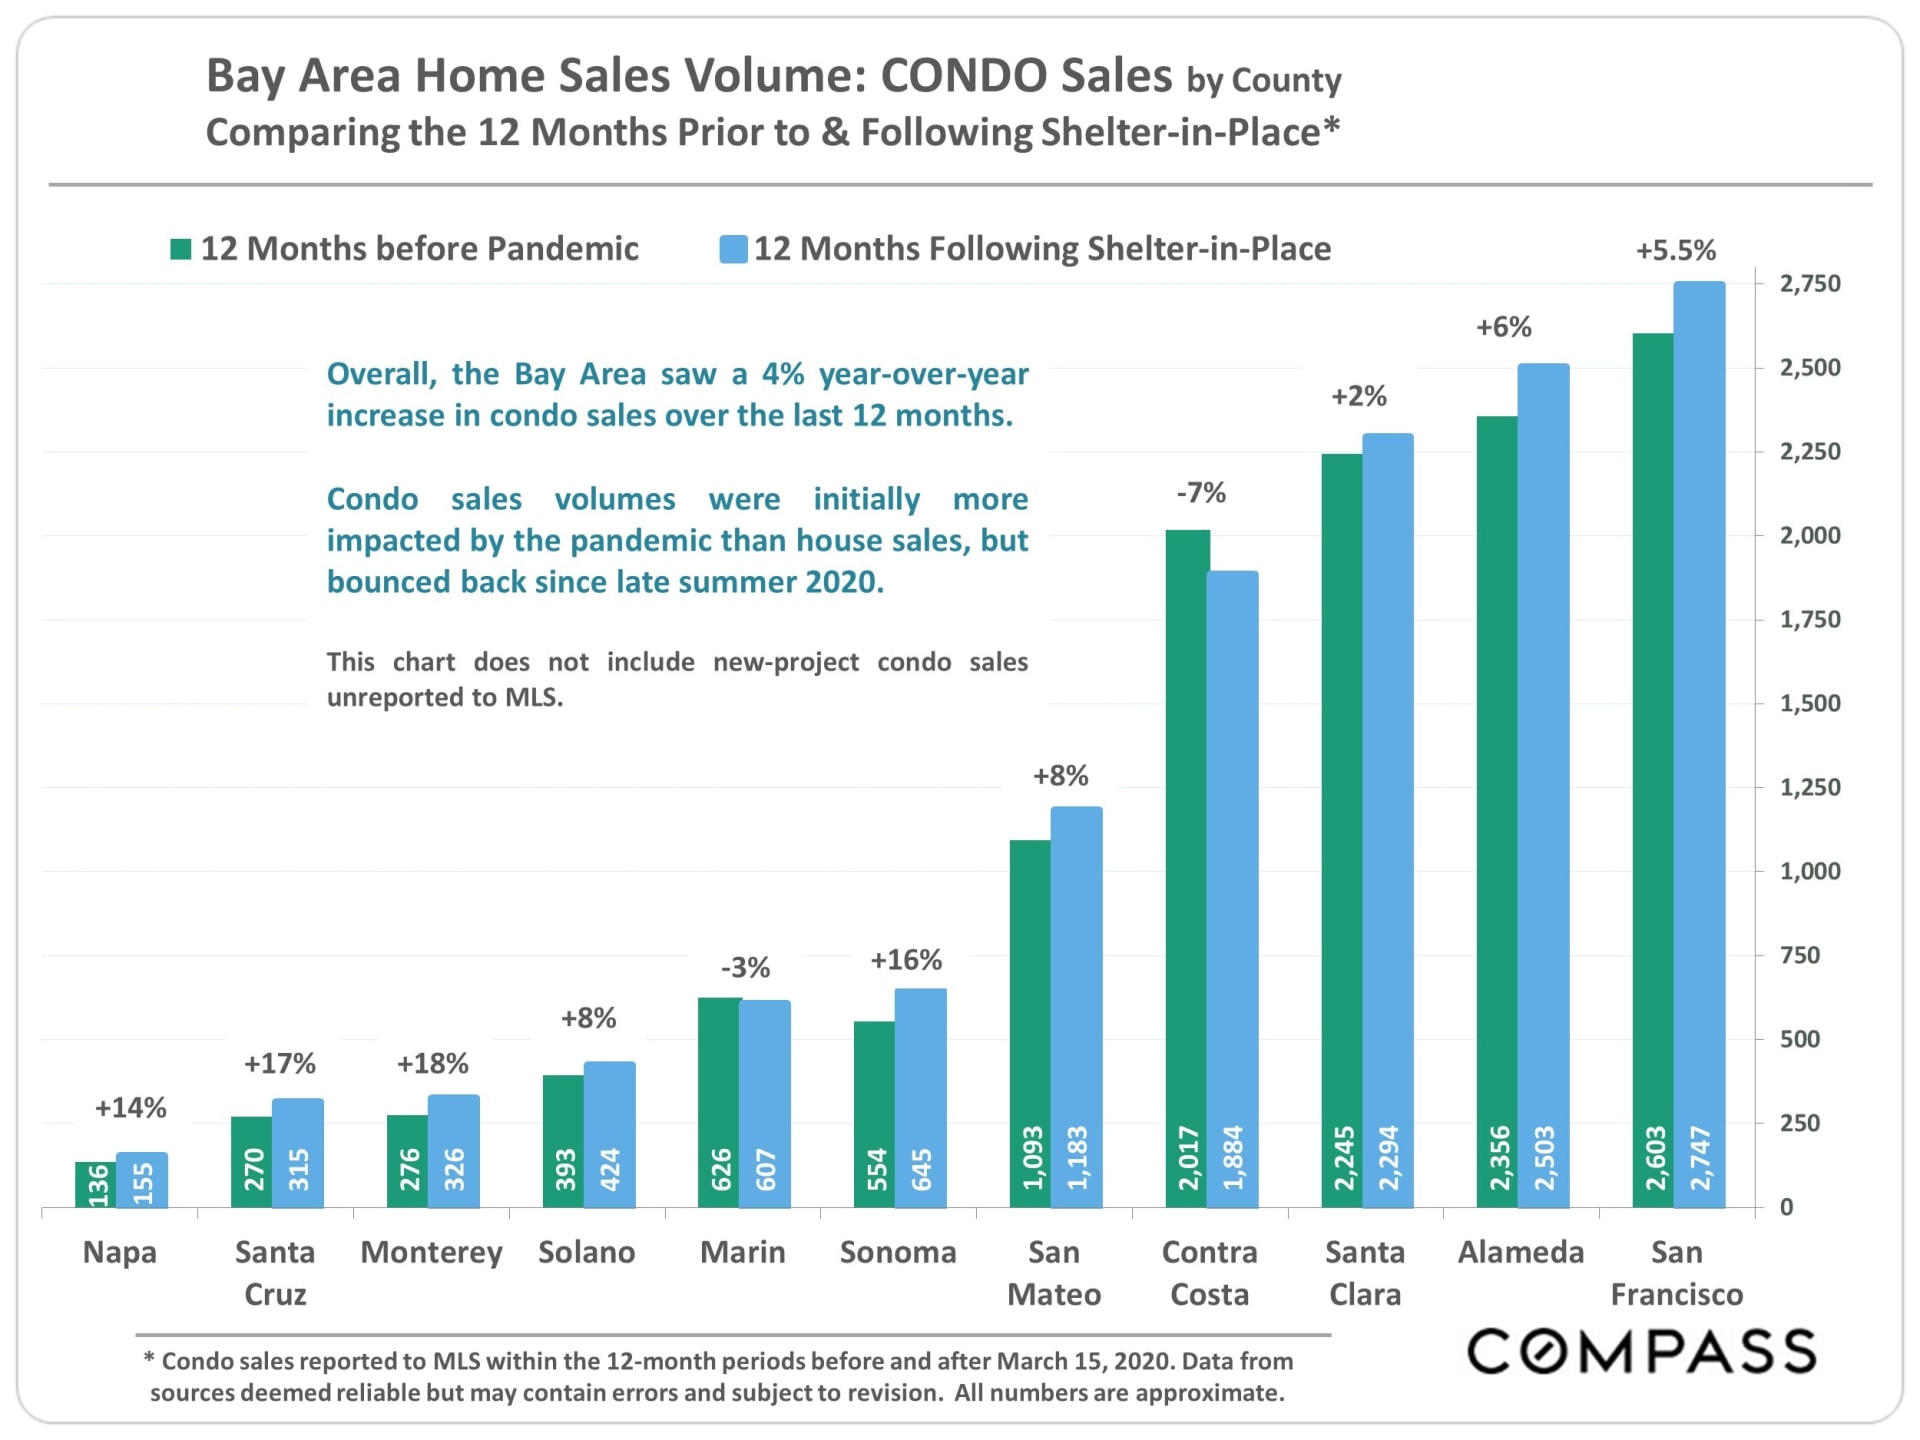
Bay Area Home Sales Volume: CONDO Sales by County
Comparing the 12 Months Prior to & Following Shelter-in-Place*
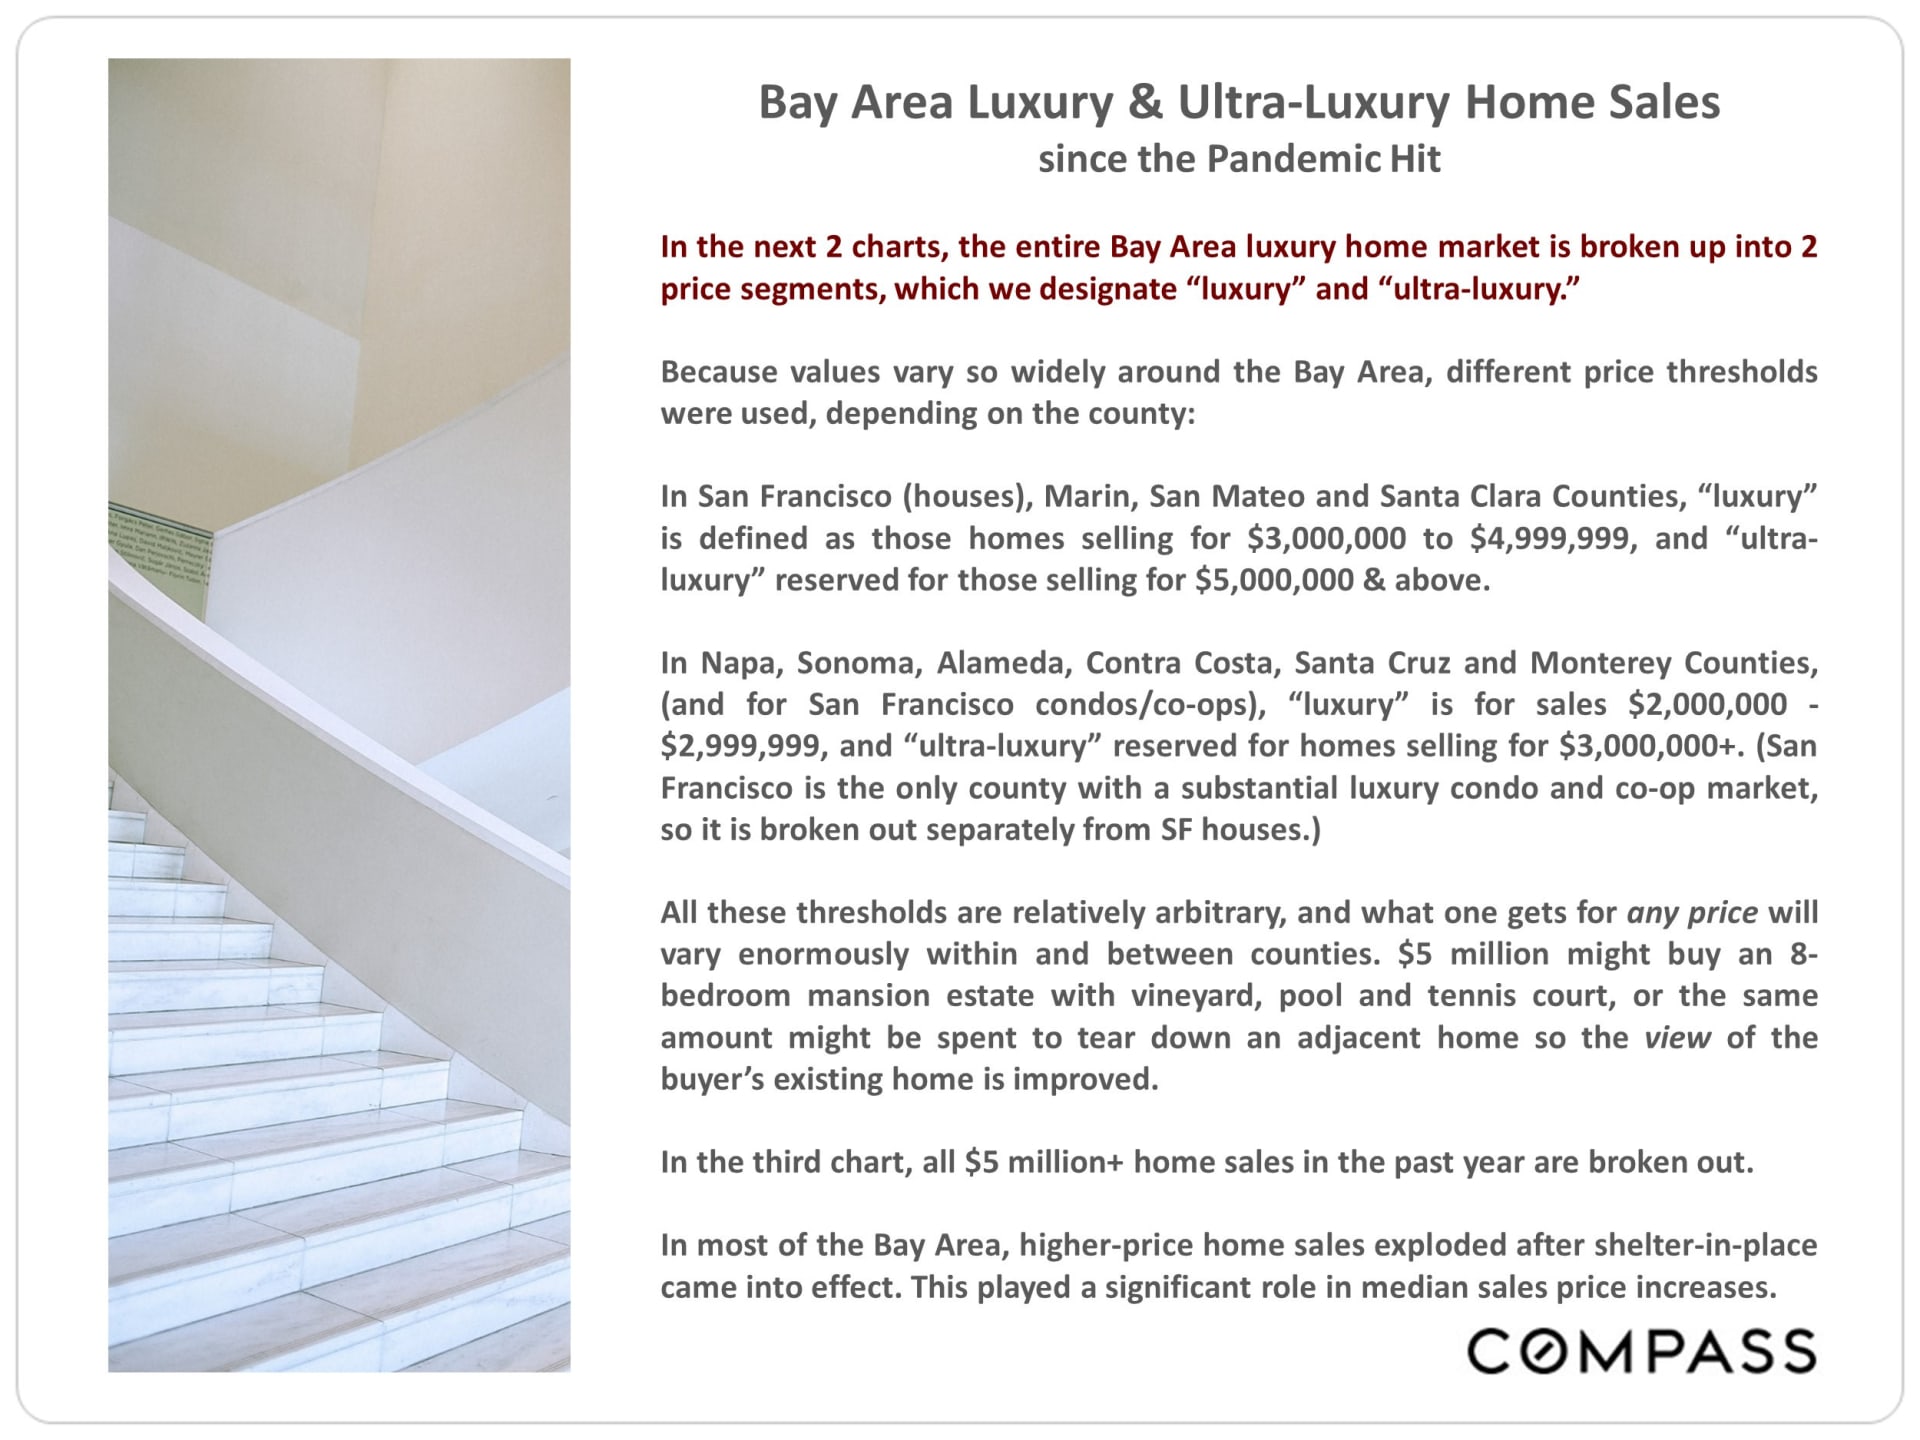
Bay Area Luxury & Ultra-Luxury Home Sales since the Pandemic Hit
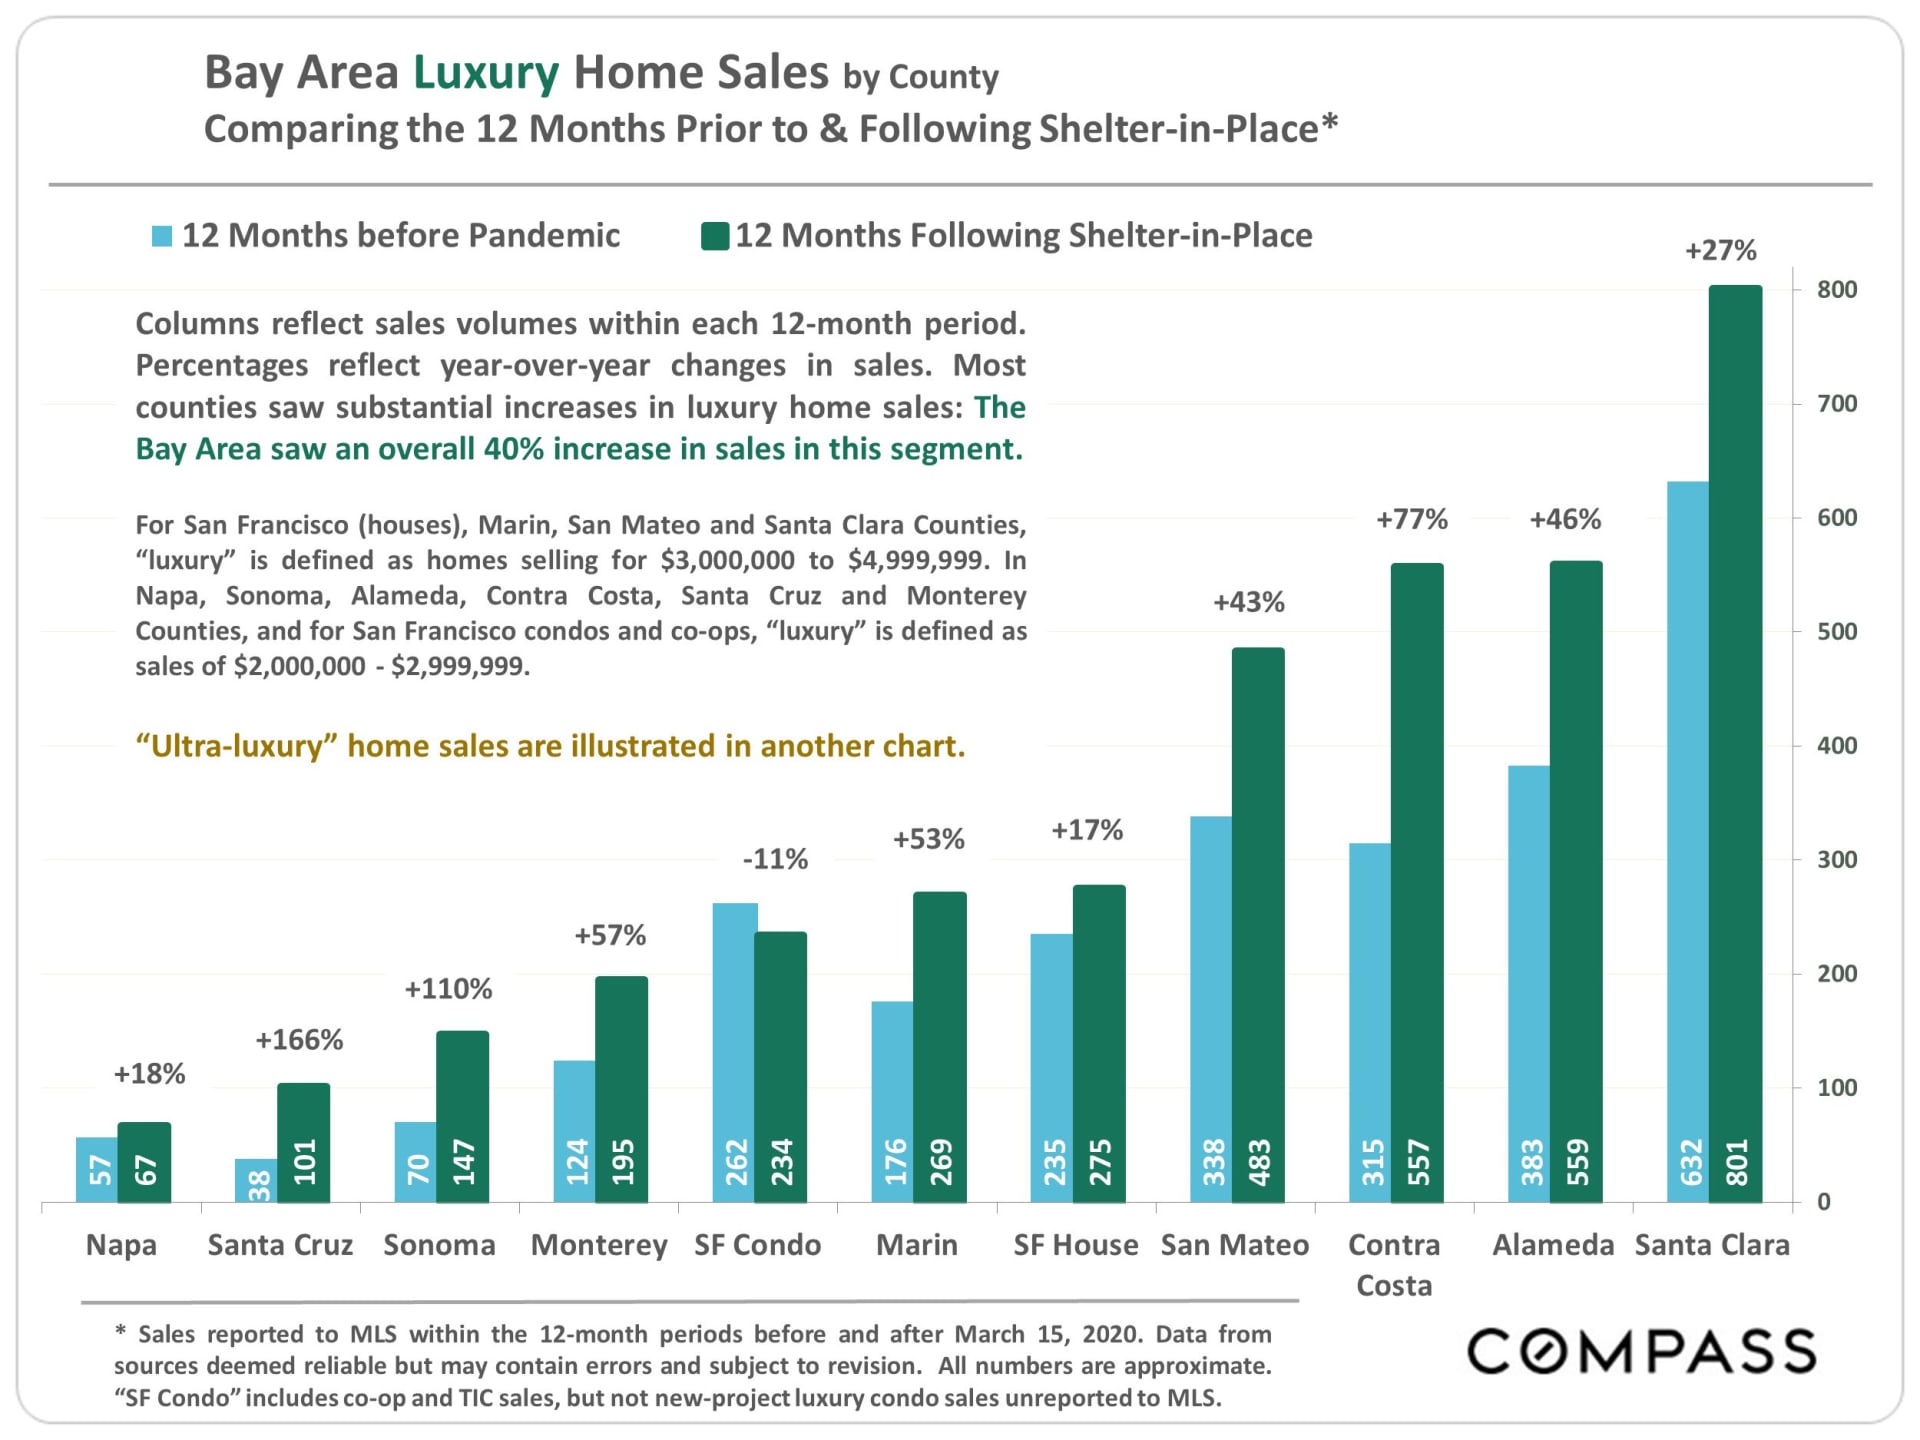
Bay Area Luxury Home Sales by County
Comparing the 12 Months Prior to & Following Shelter-in-Place*
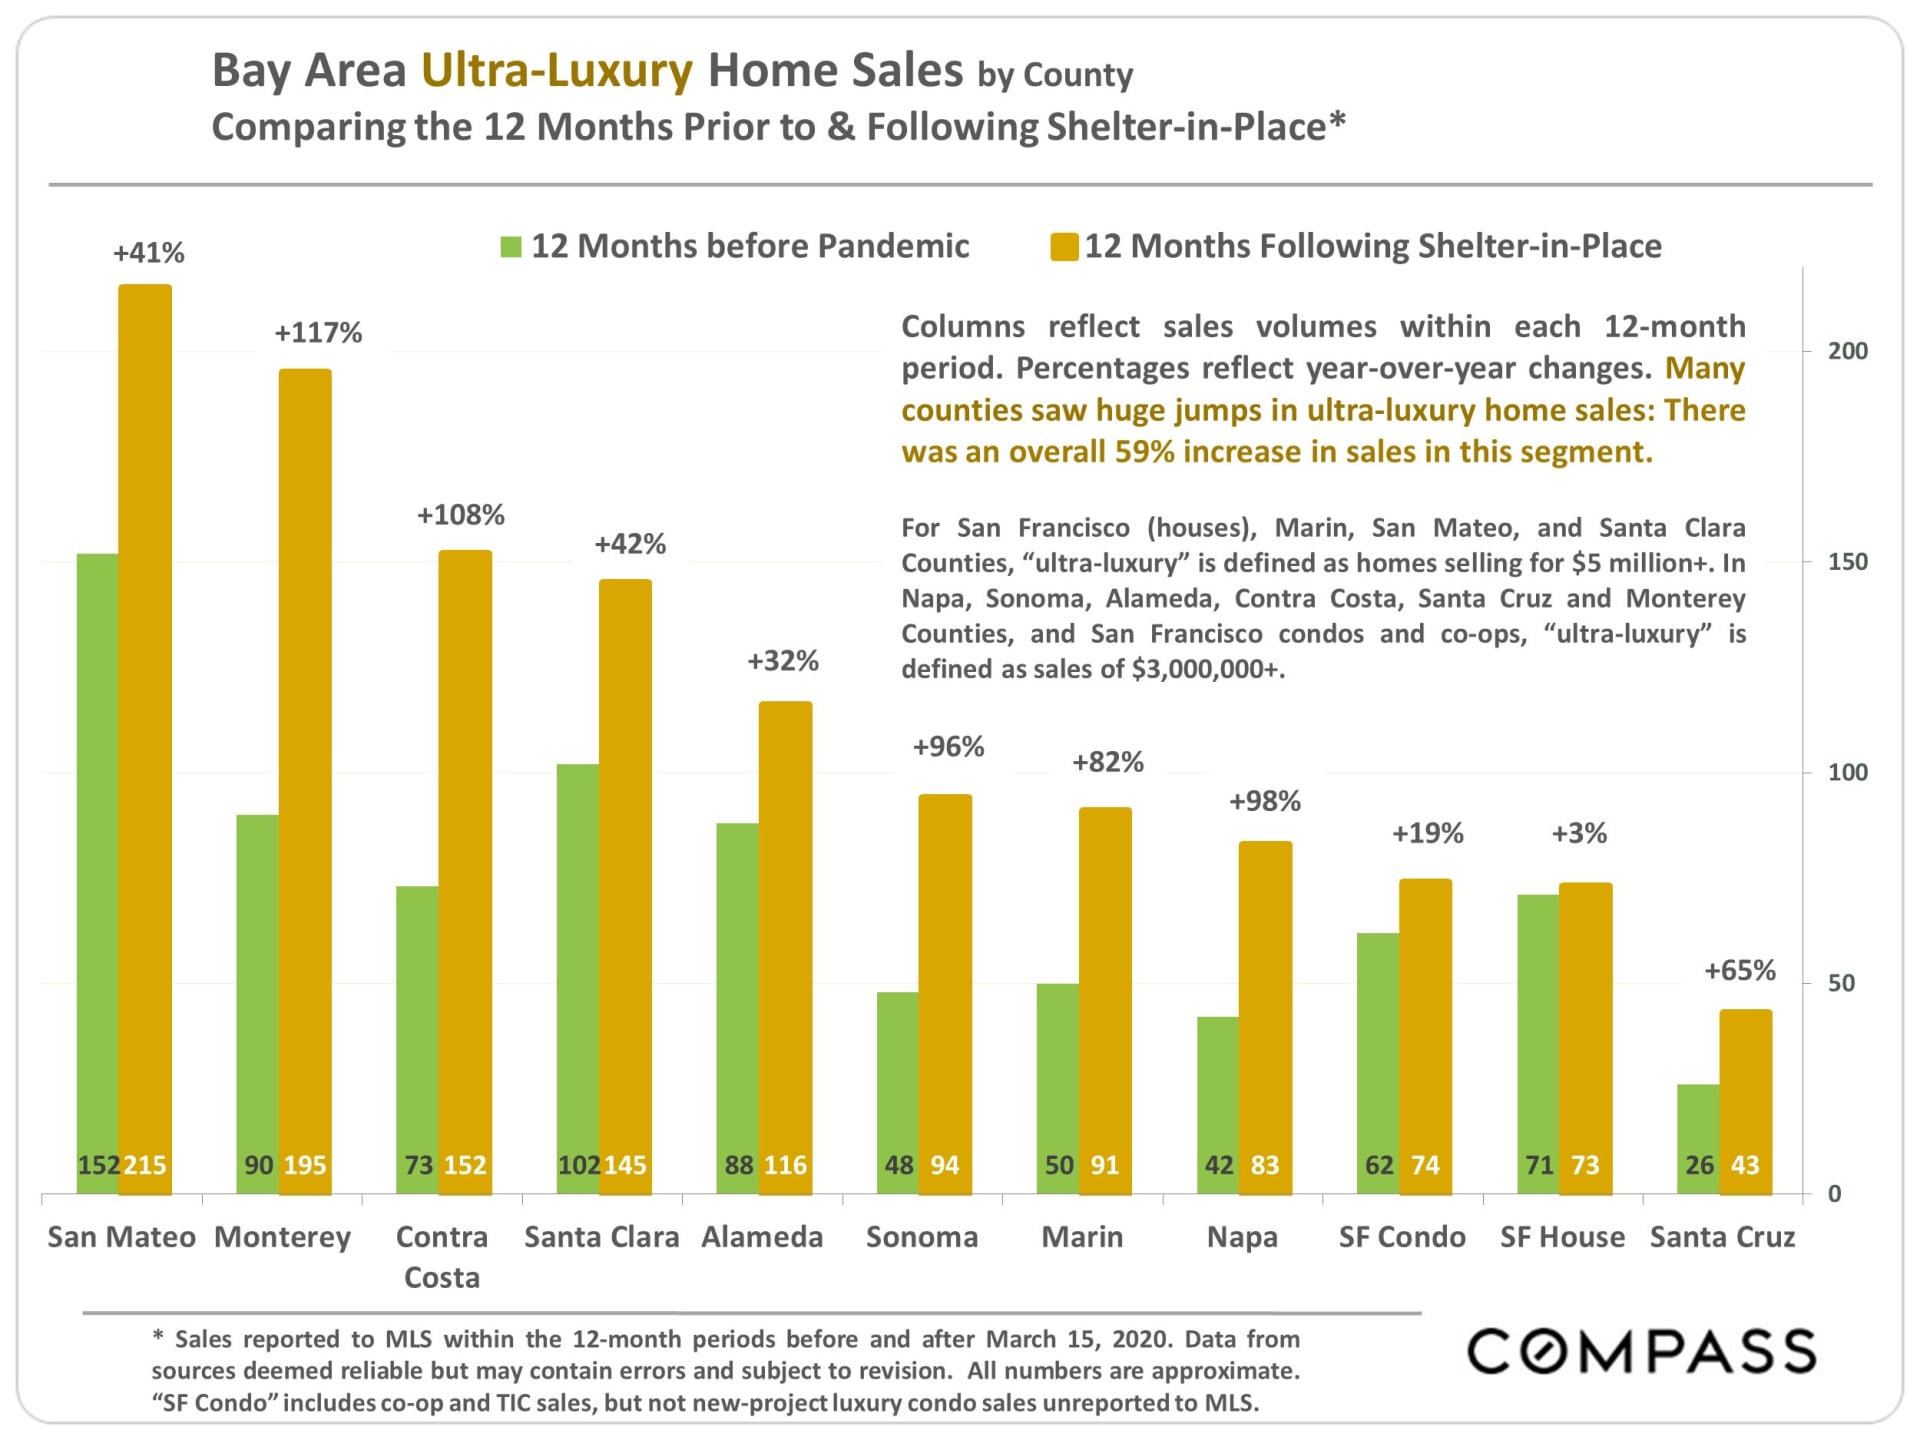
Bay Area Ultra-Luxury Home Sales by County
Comparing the 12 Months Prior to & Following Shelter-in-Place*
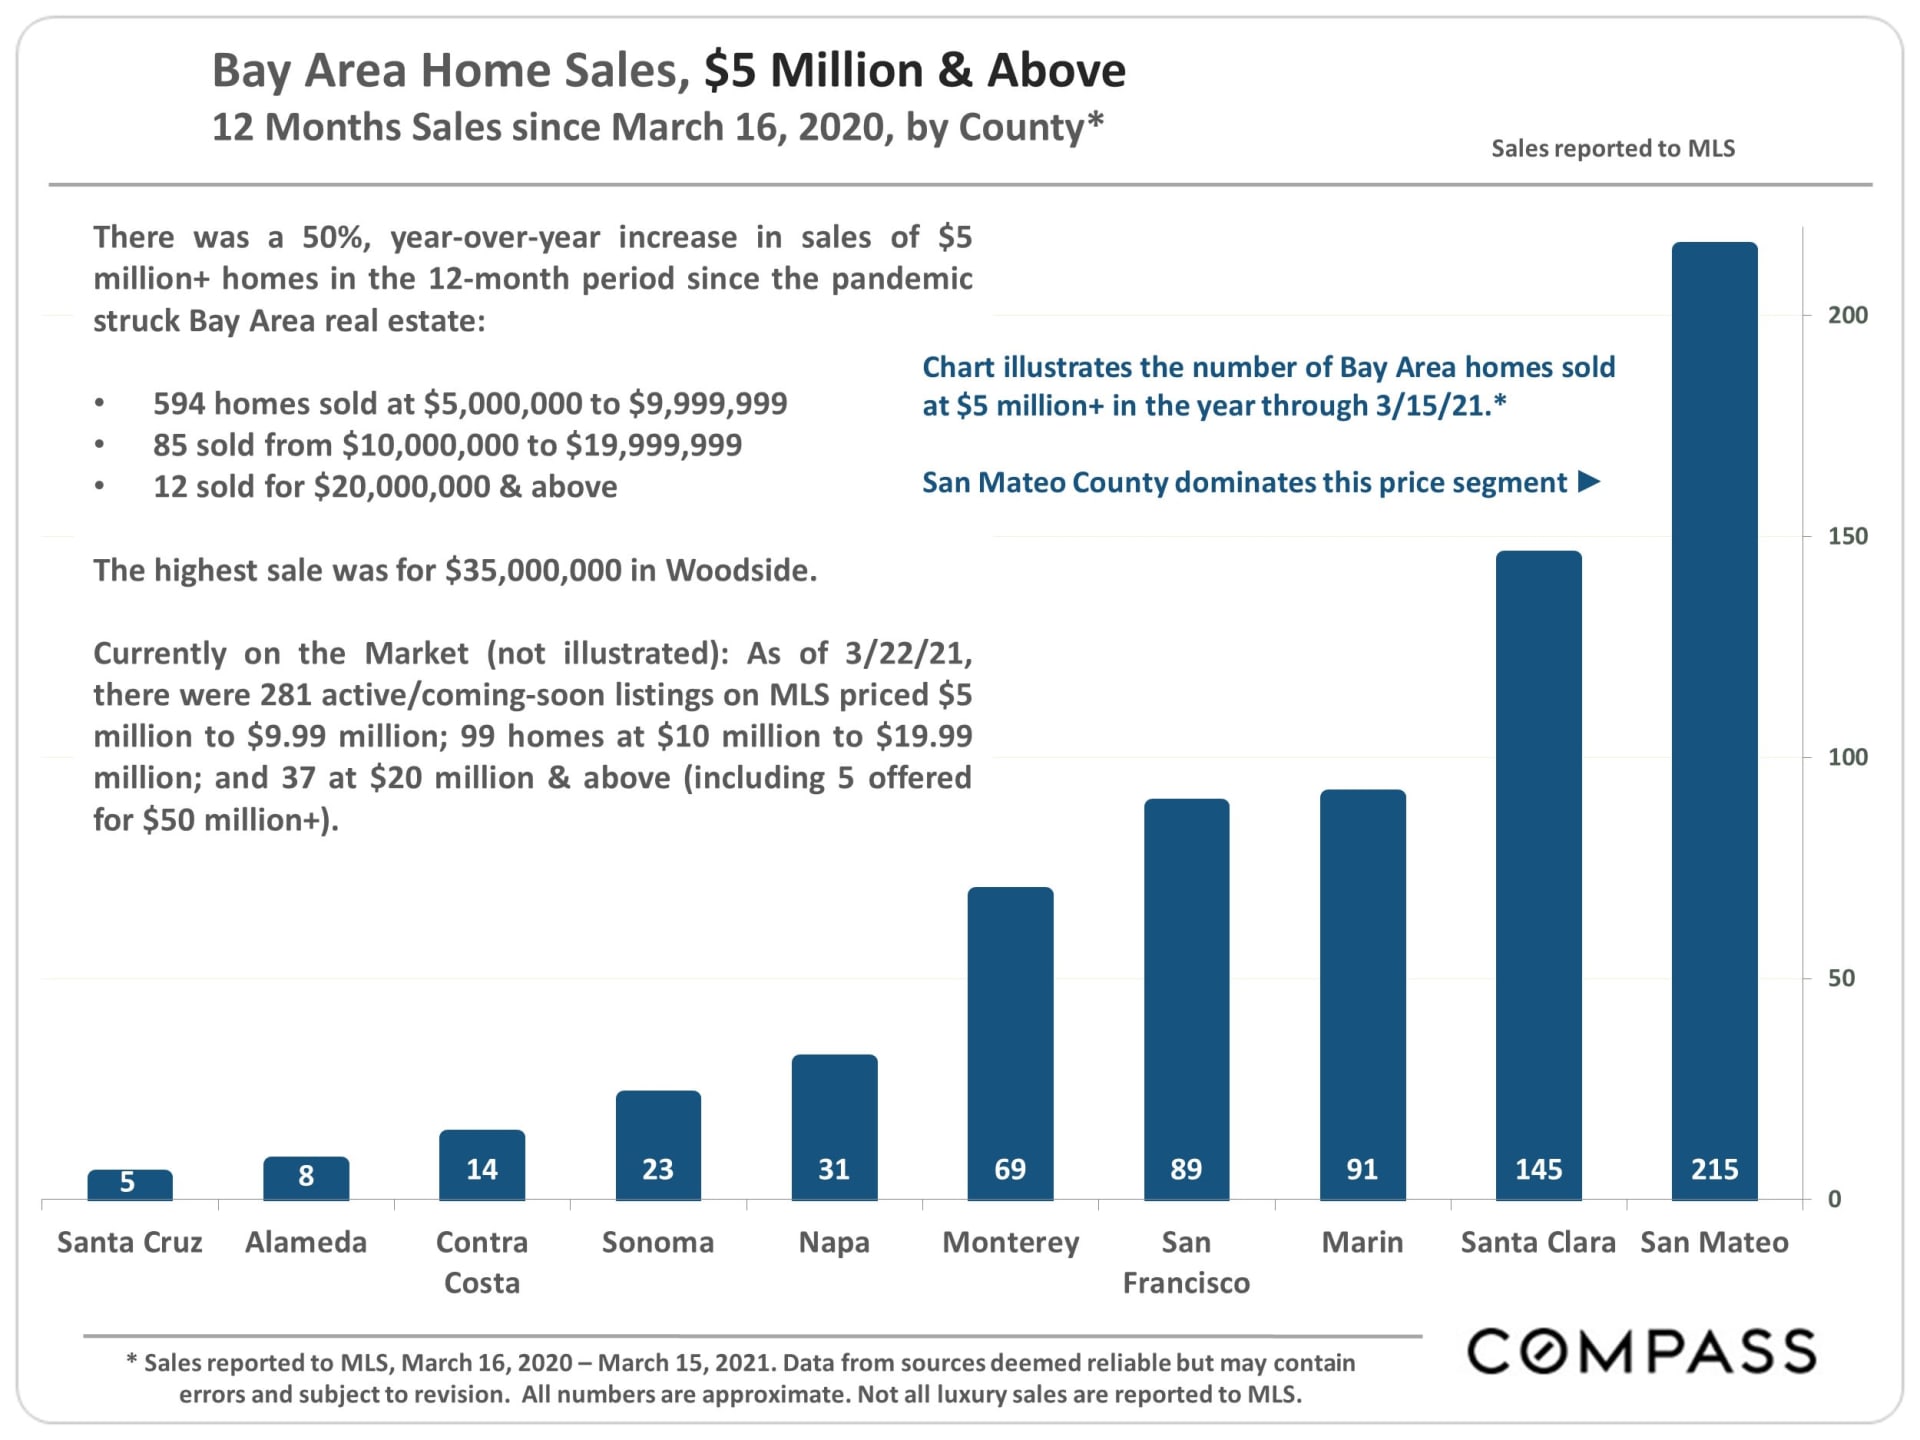
Bay Area Home Sales, $5 Million & Above
12 Months Sales since March 16, 2020, by County*
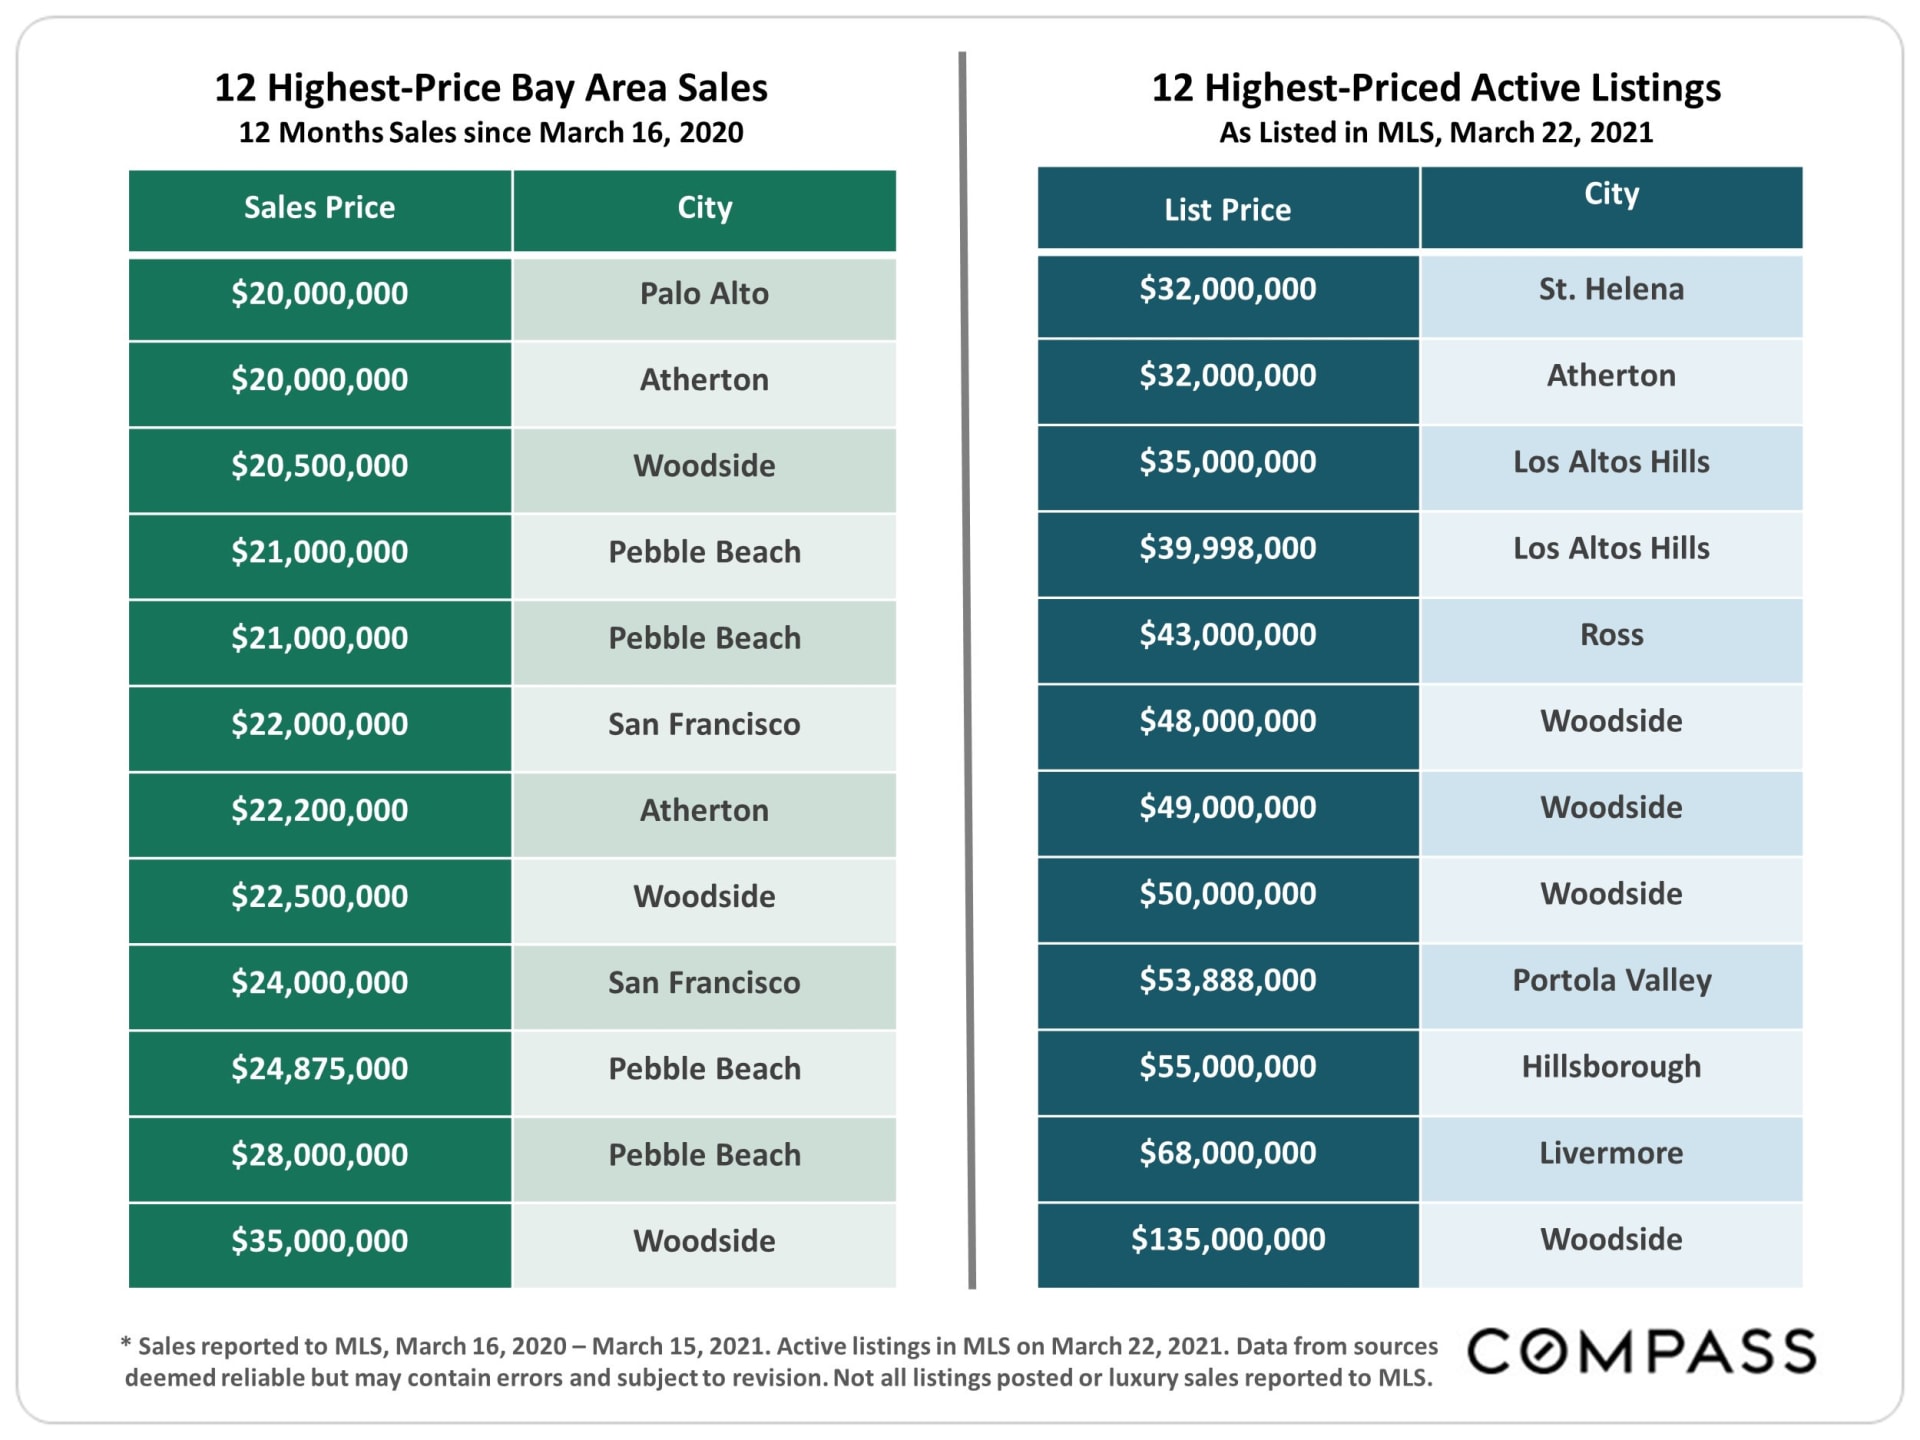
12 Highest-Price Bay Area Sales & 12 Highest-Priced Active Listings
12 Months Sales since March 16, 2020 & As Listed in MLS, March 22, 2021
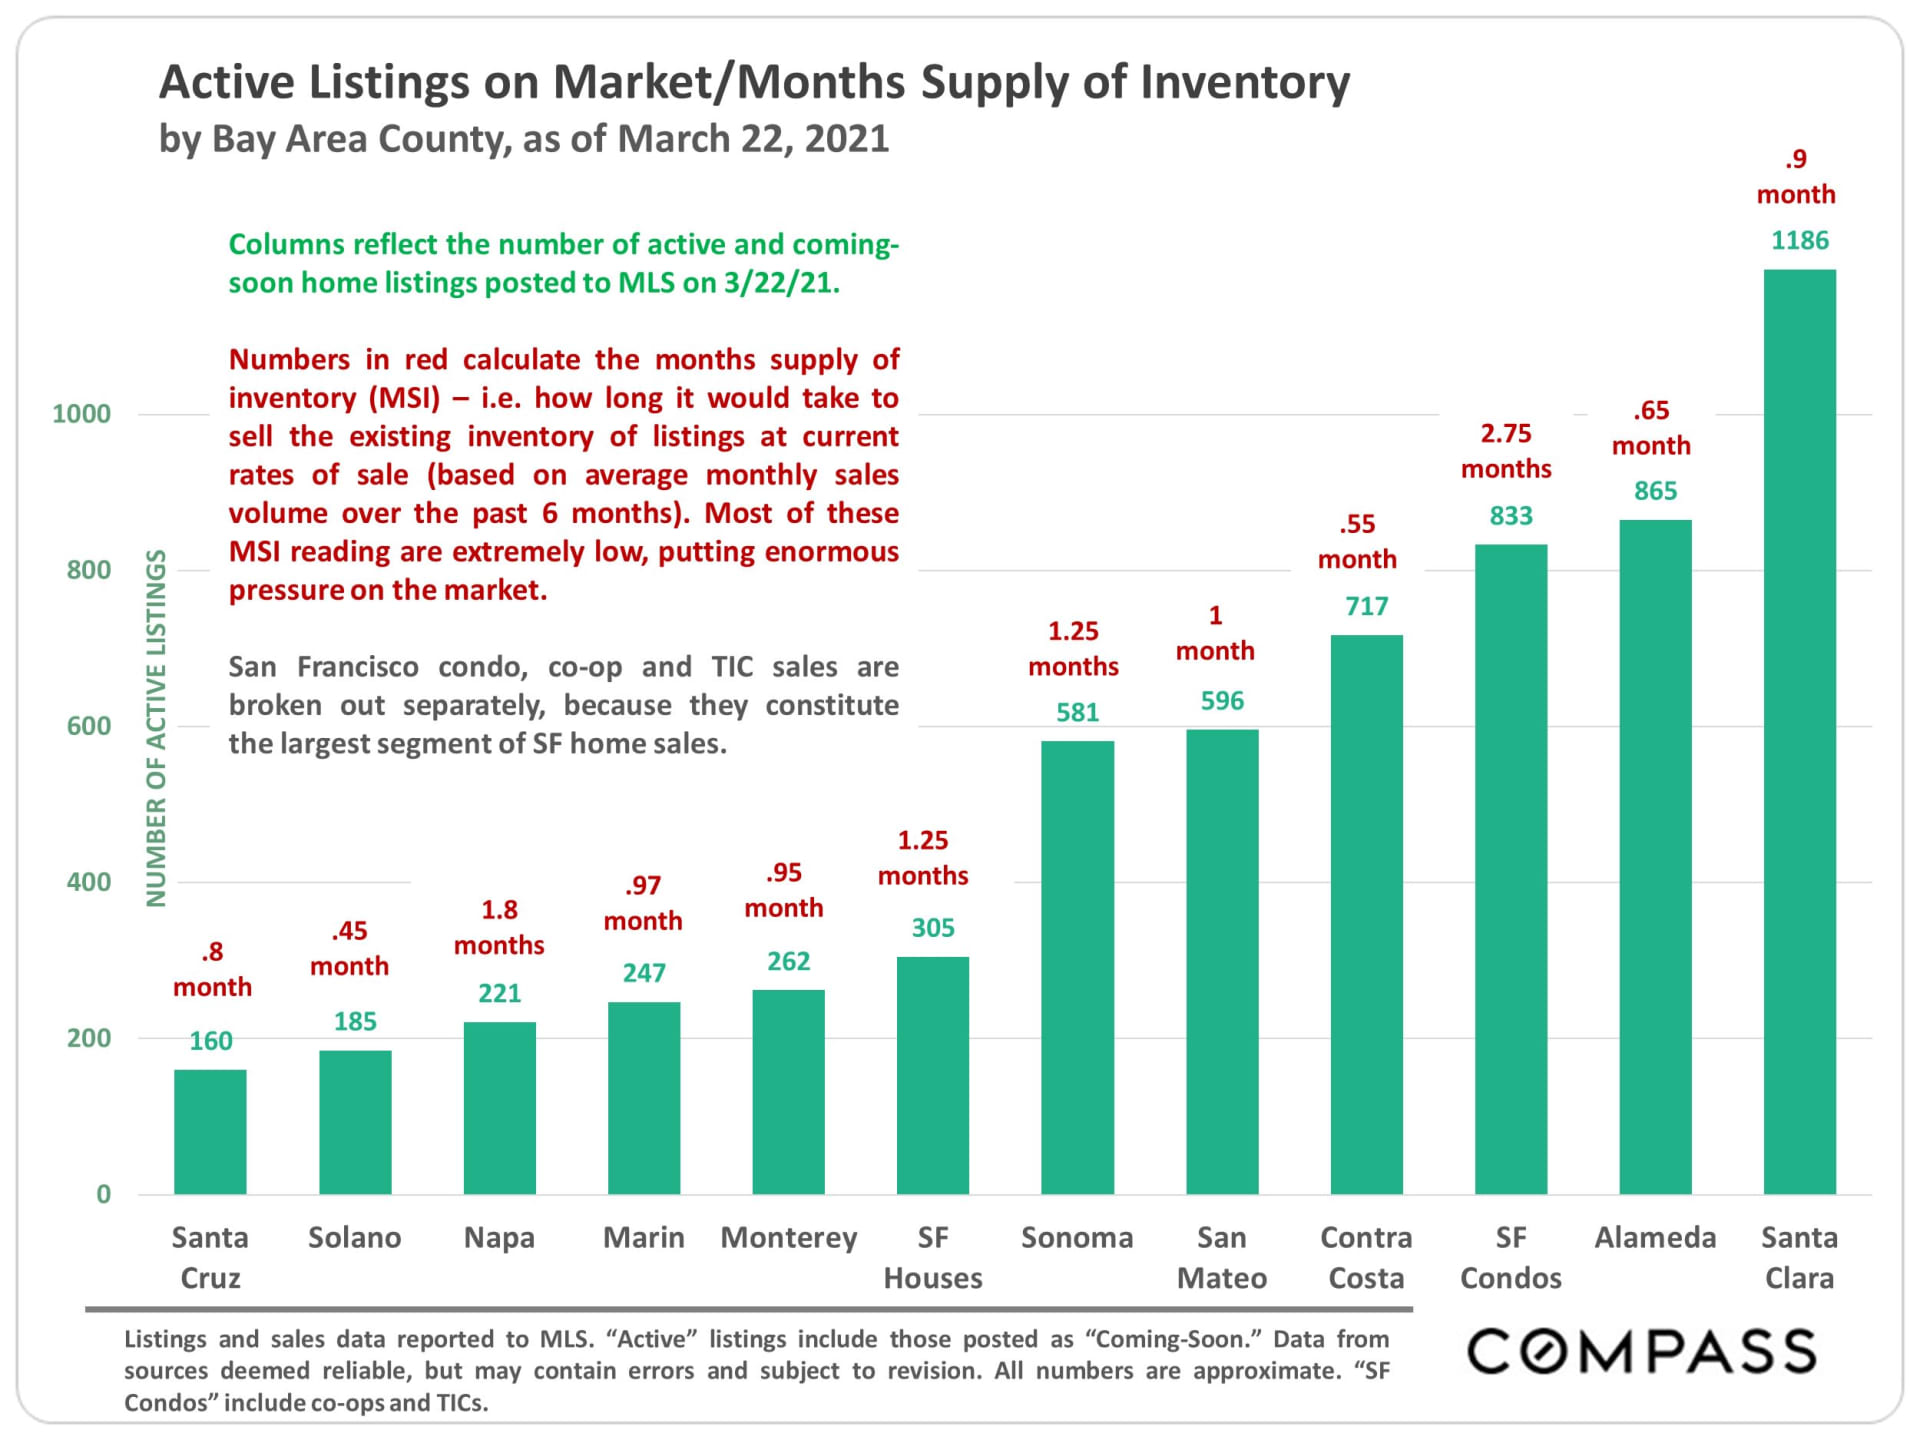
Active Listings on Market/Months Supply of Inventory
by Bay Area County, as of March 22, 2021
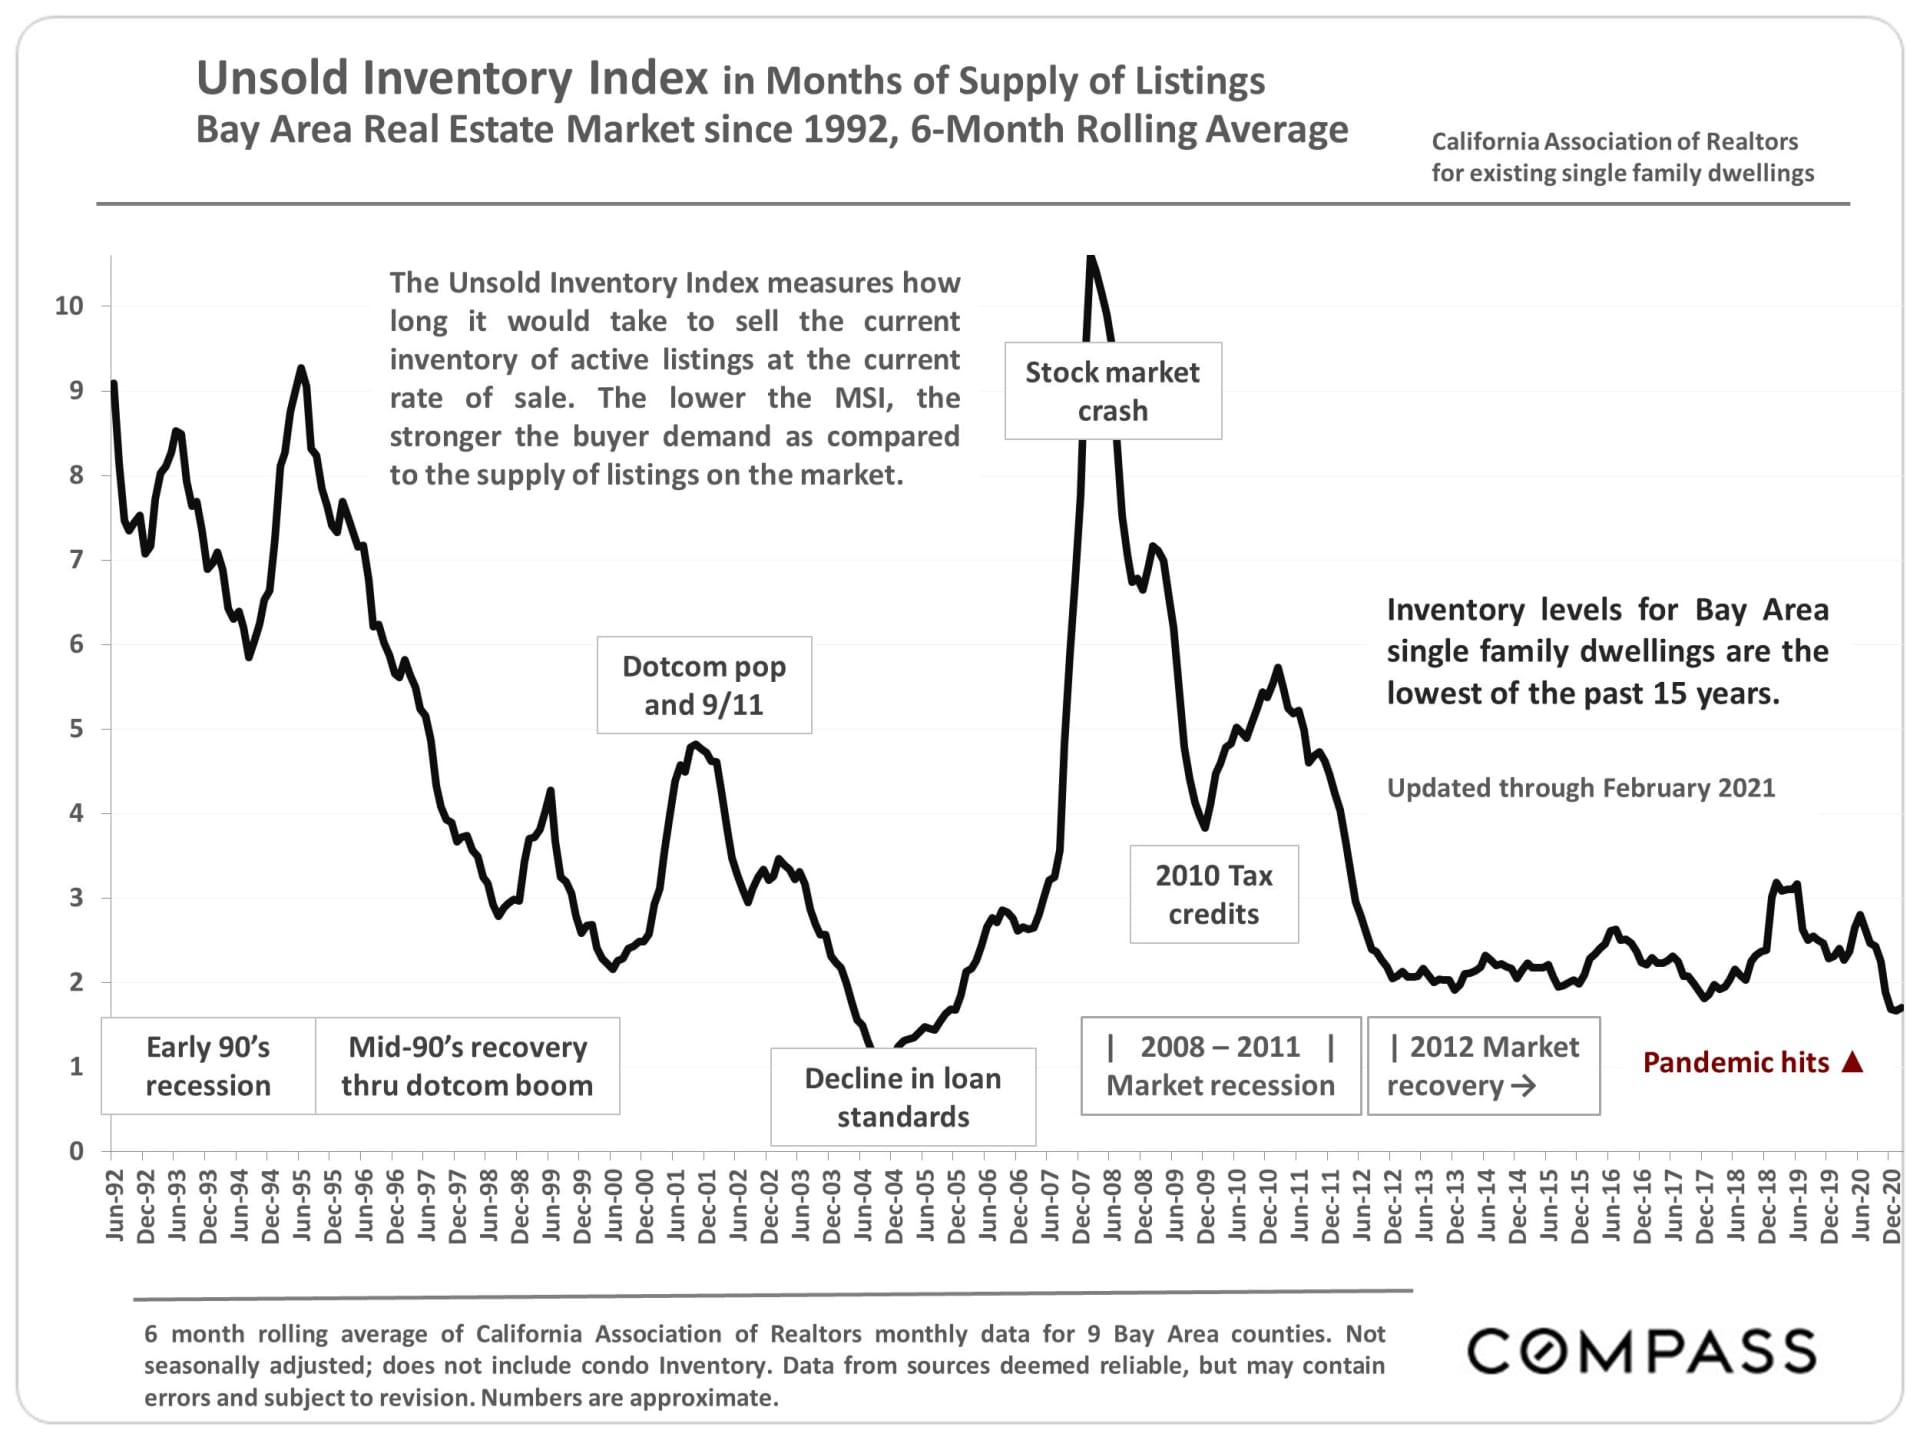
Unsold Inventory Index in Months of Supply of Listings
Bay Area Real Estate Market since 1992, 6-Month Rolling Average
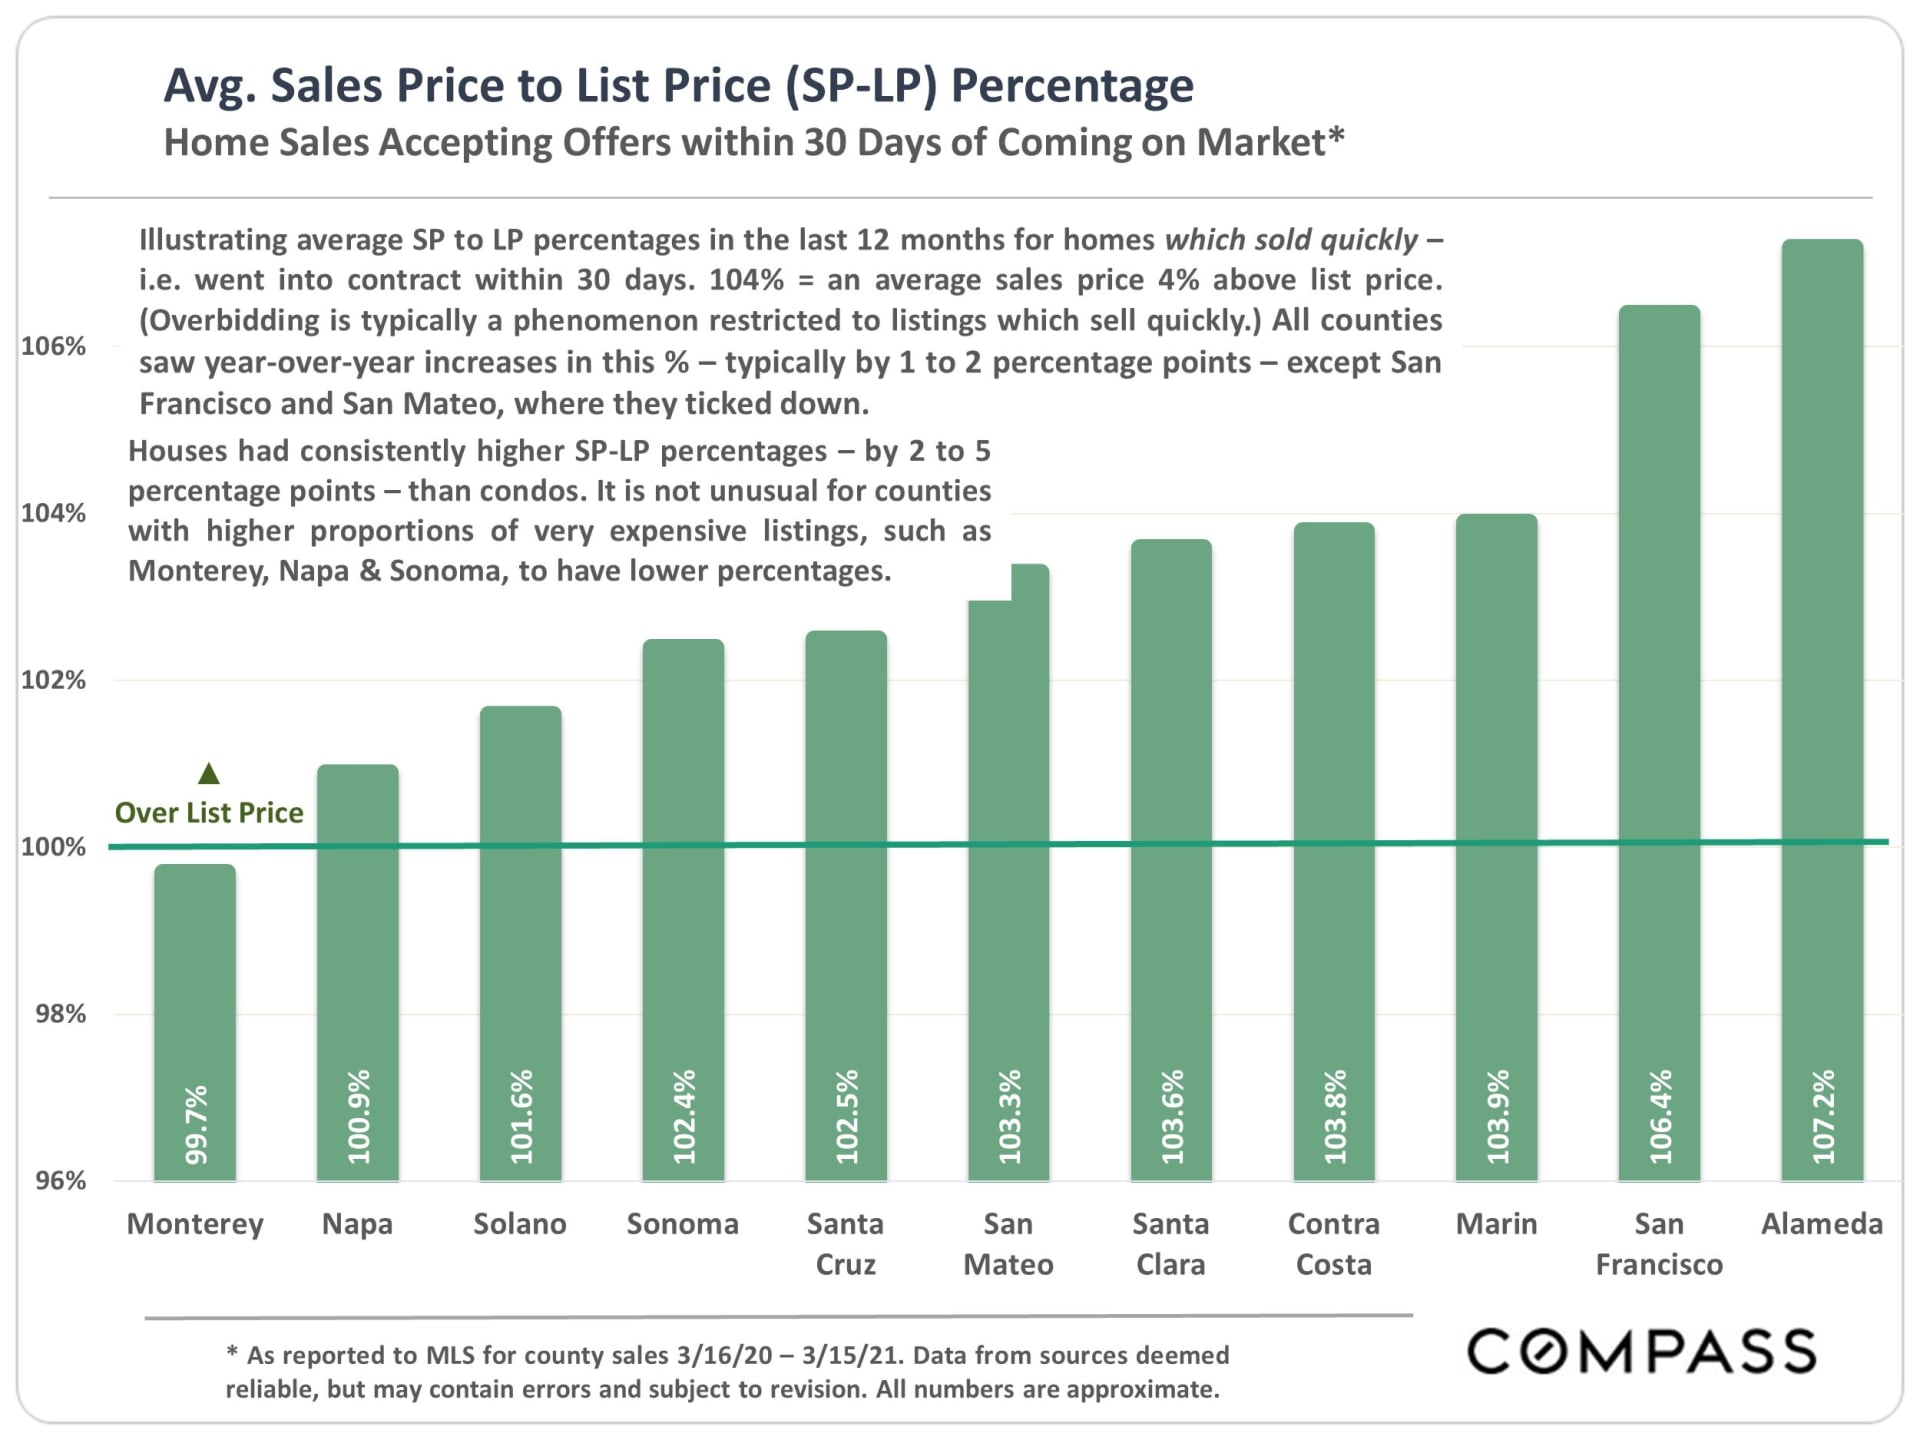
Average Sales Price to List Price (SP-LP) Percentage
Home Sales Accepting Offers within 30 Days of Coming on Market*
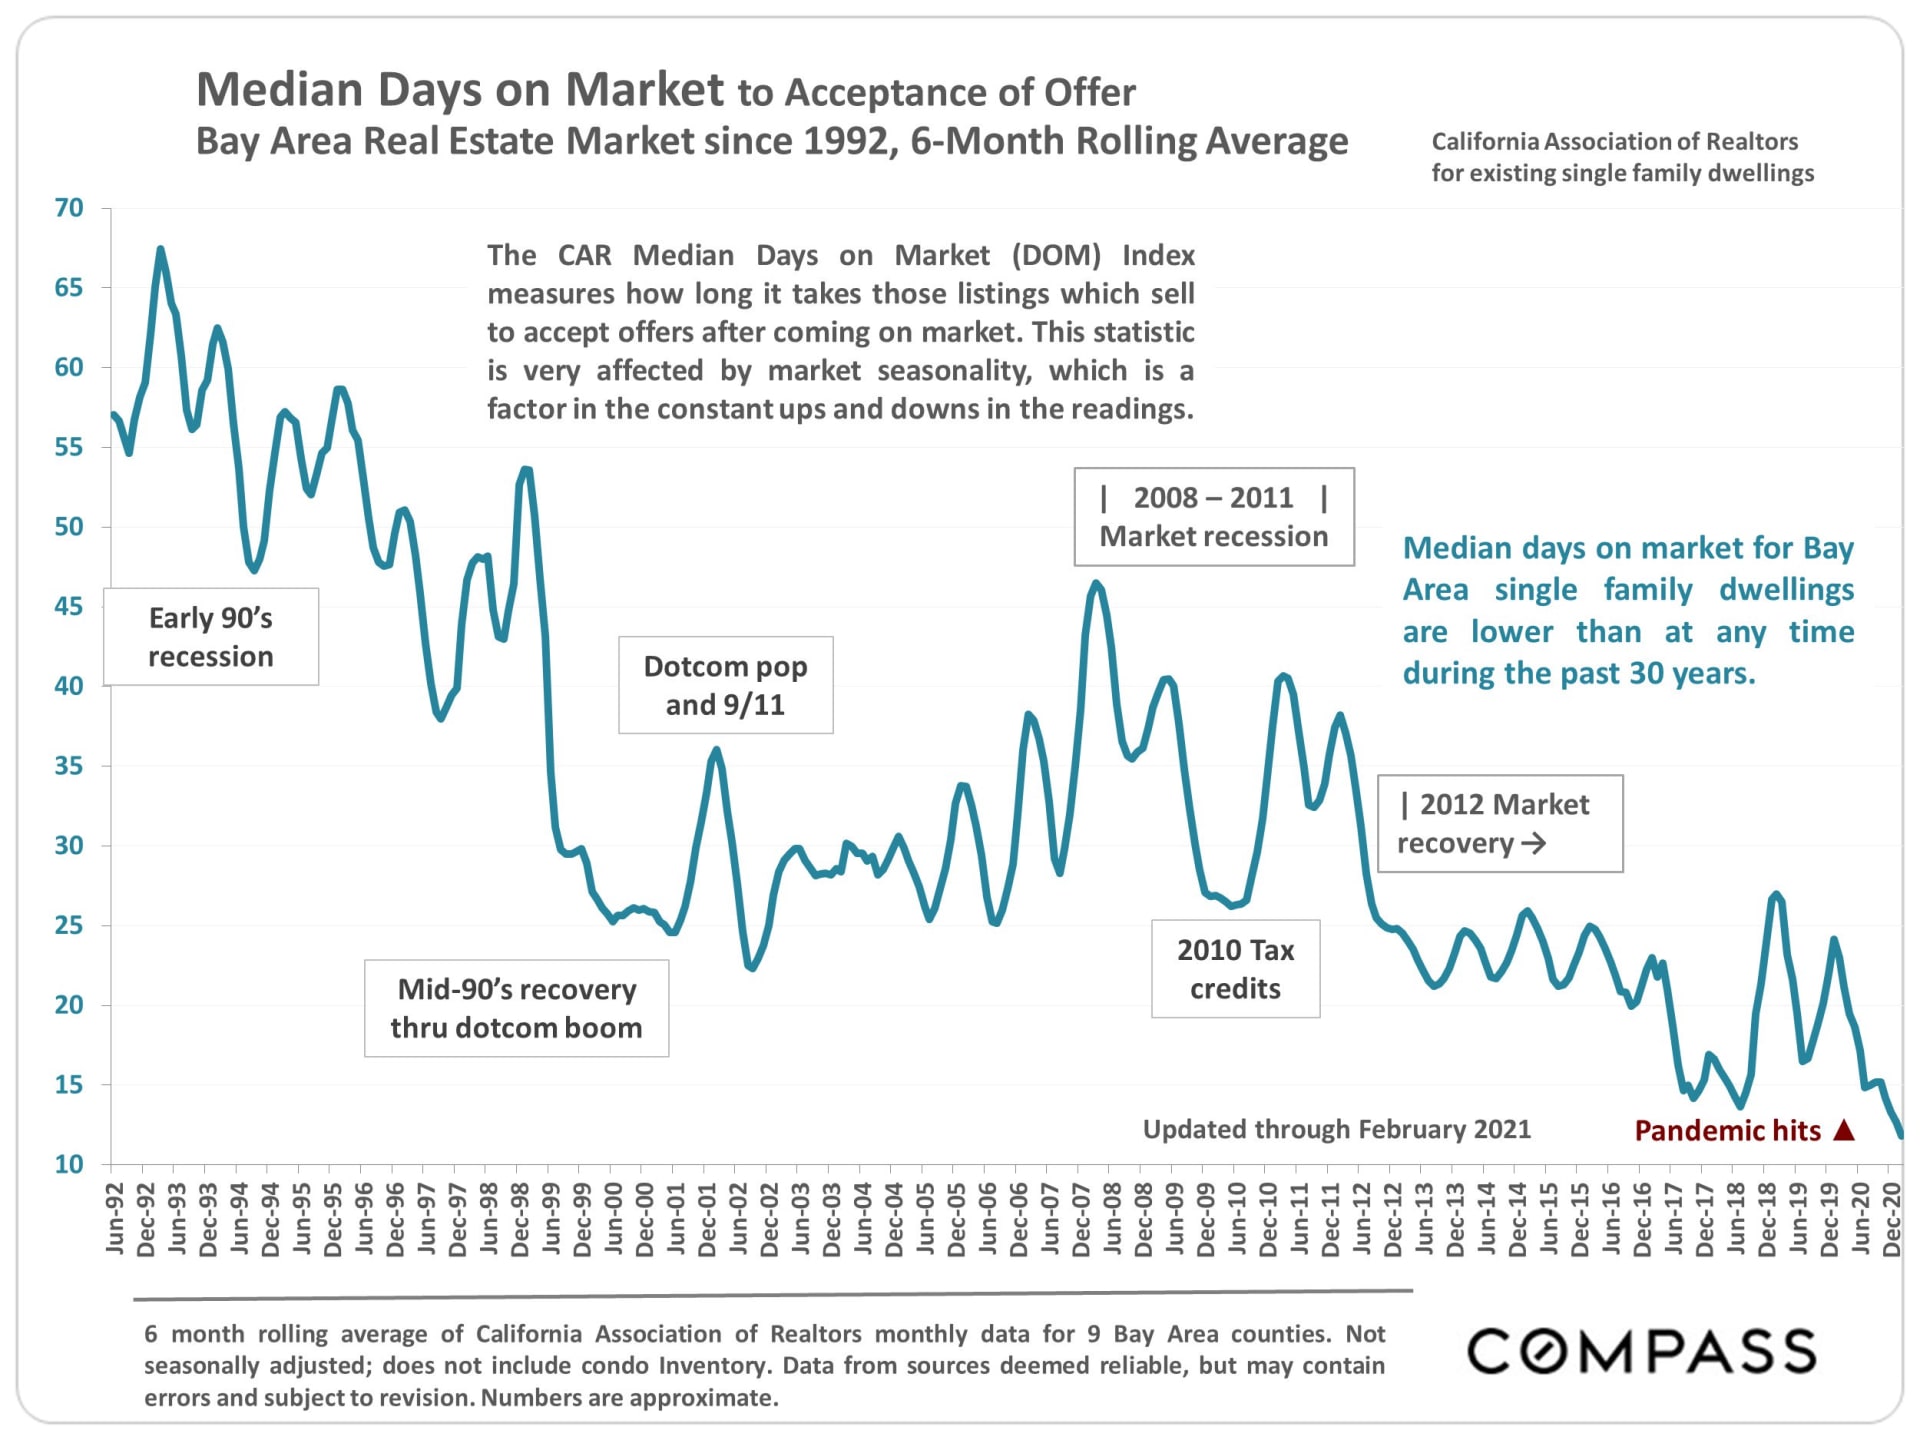
Median Days on Market to Acceptance of Offer
Bay Area Real Estate Market since 1992, 6-Month Rolling Average
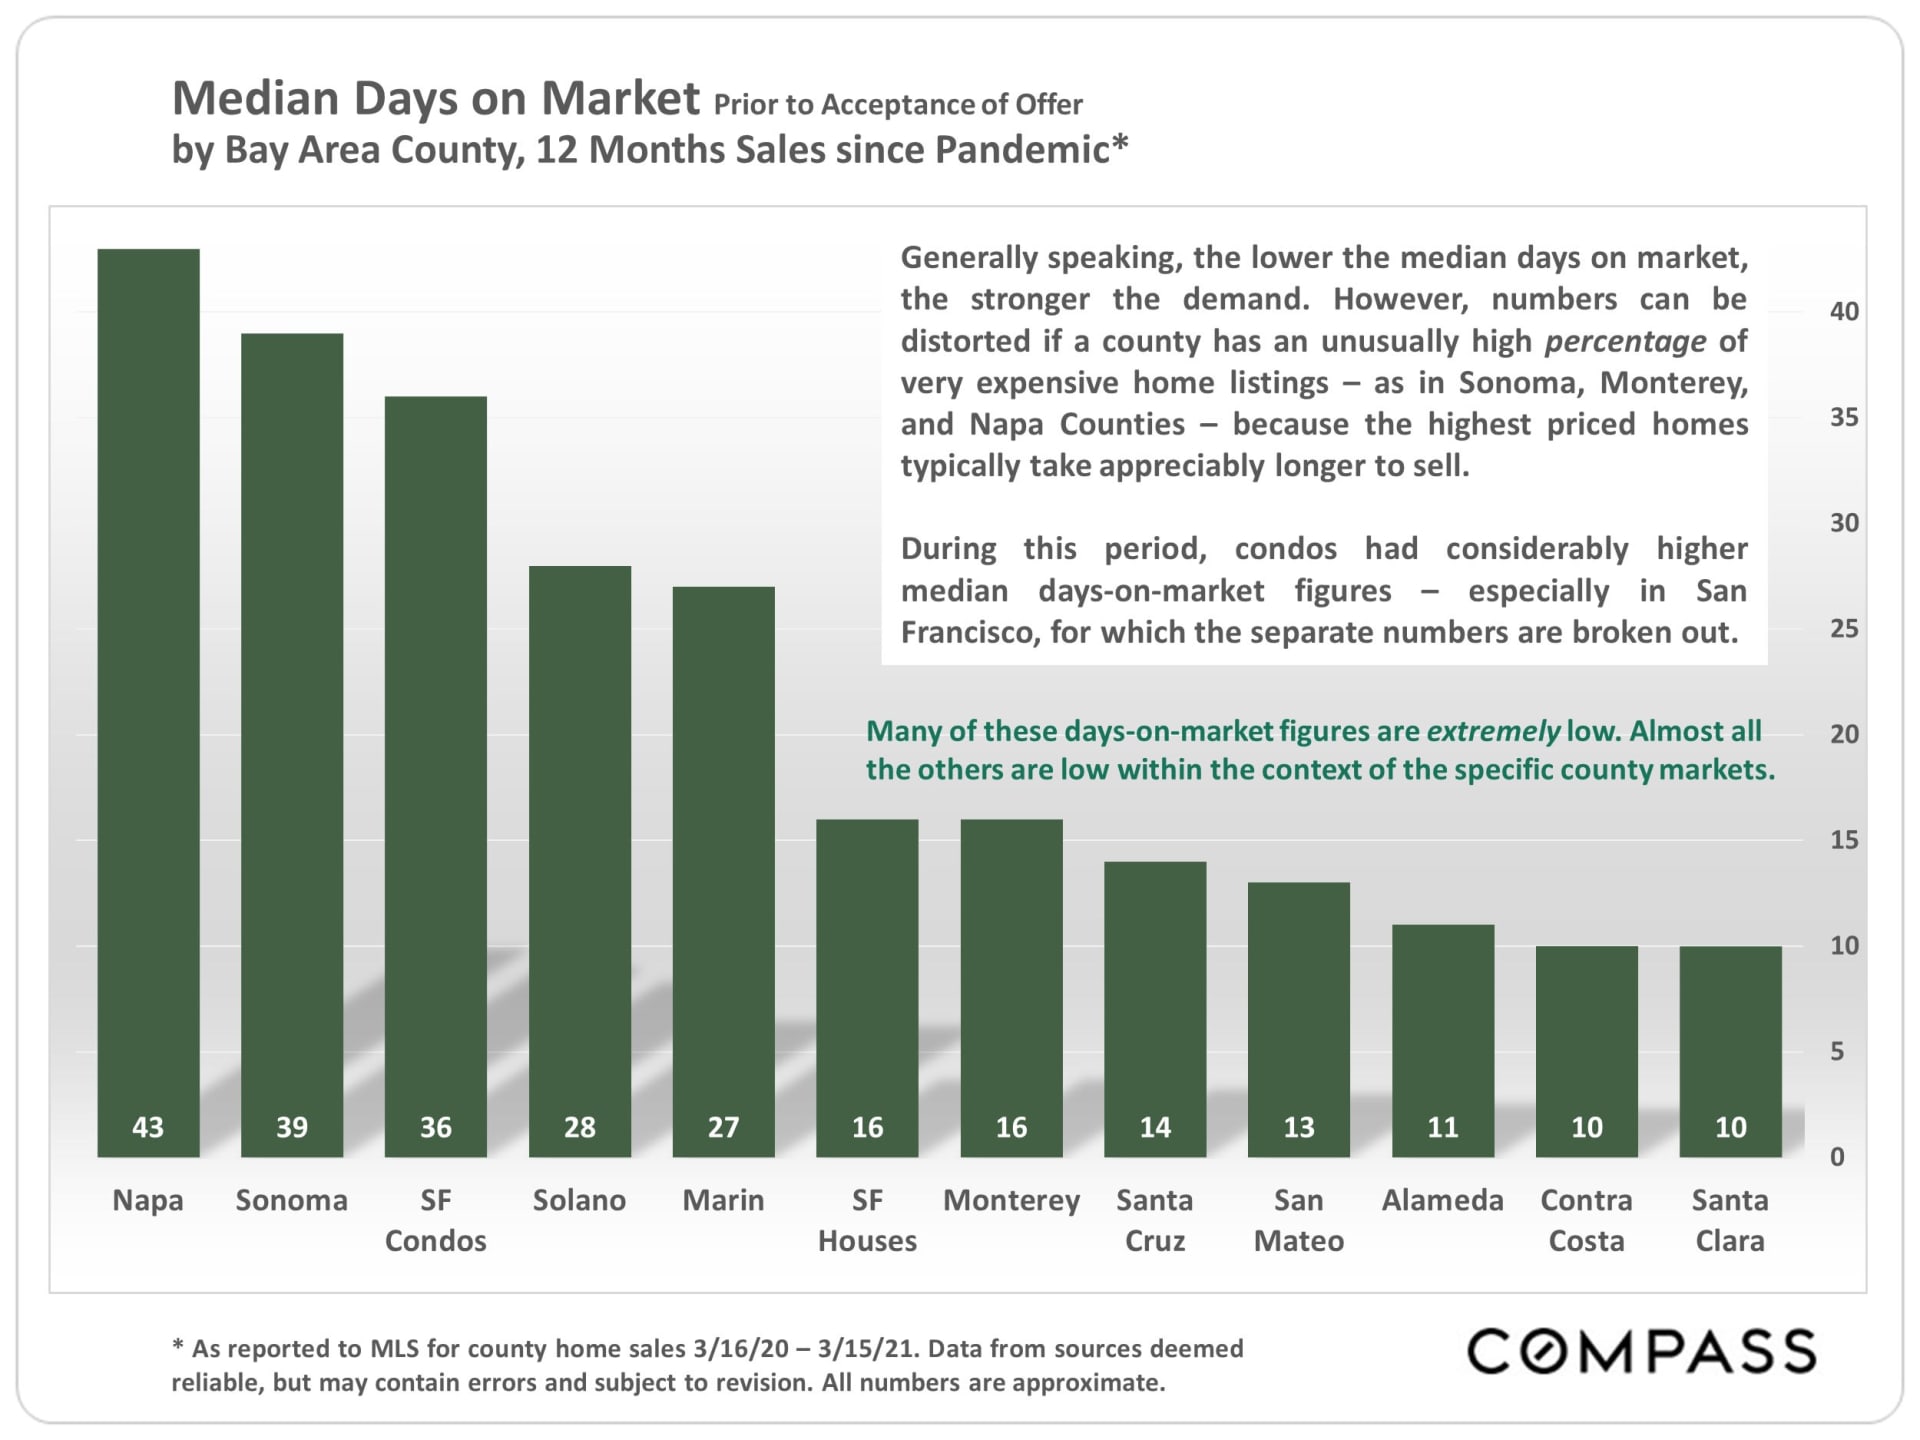
Median Days on Market Prior to Acceptance of Offer
by Bay Area County, 12 Months Sales since Pandemic*
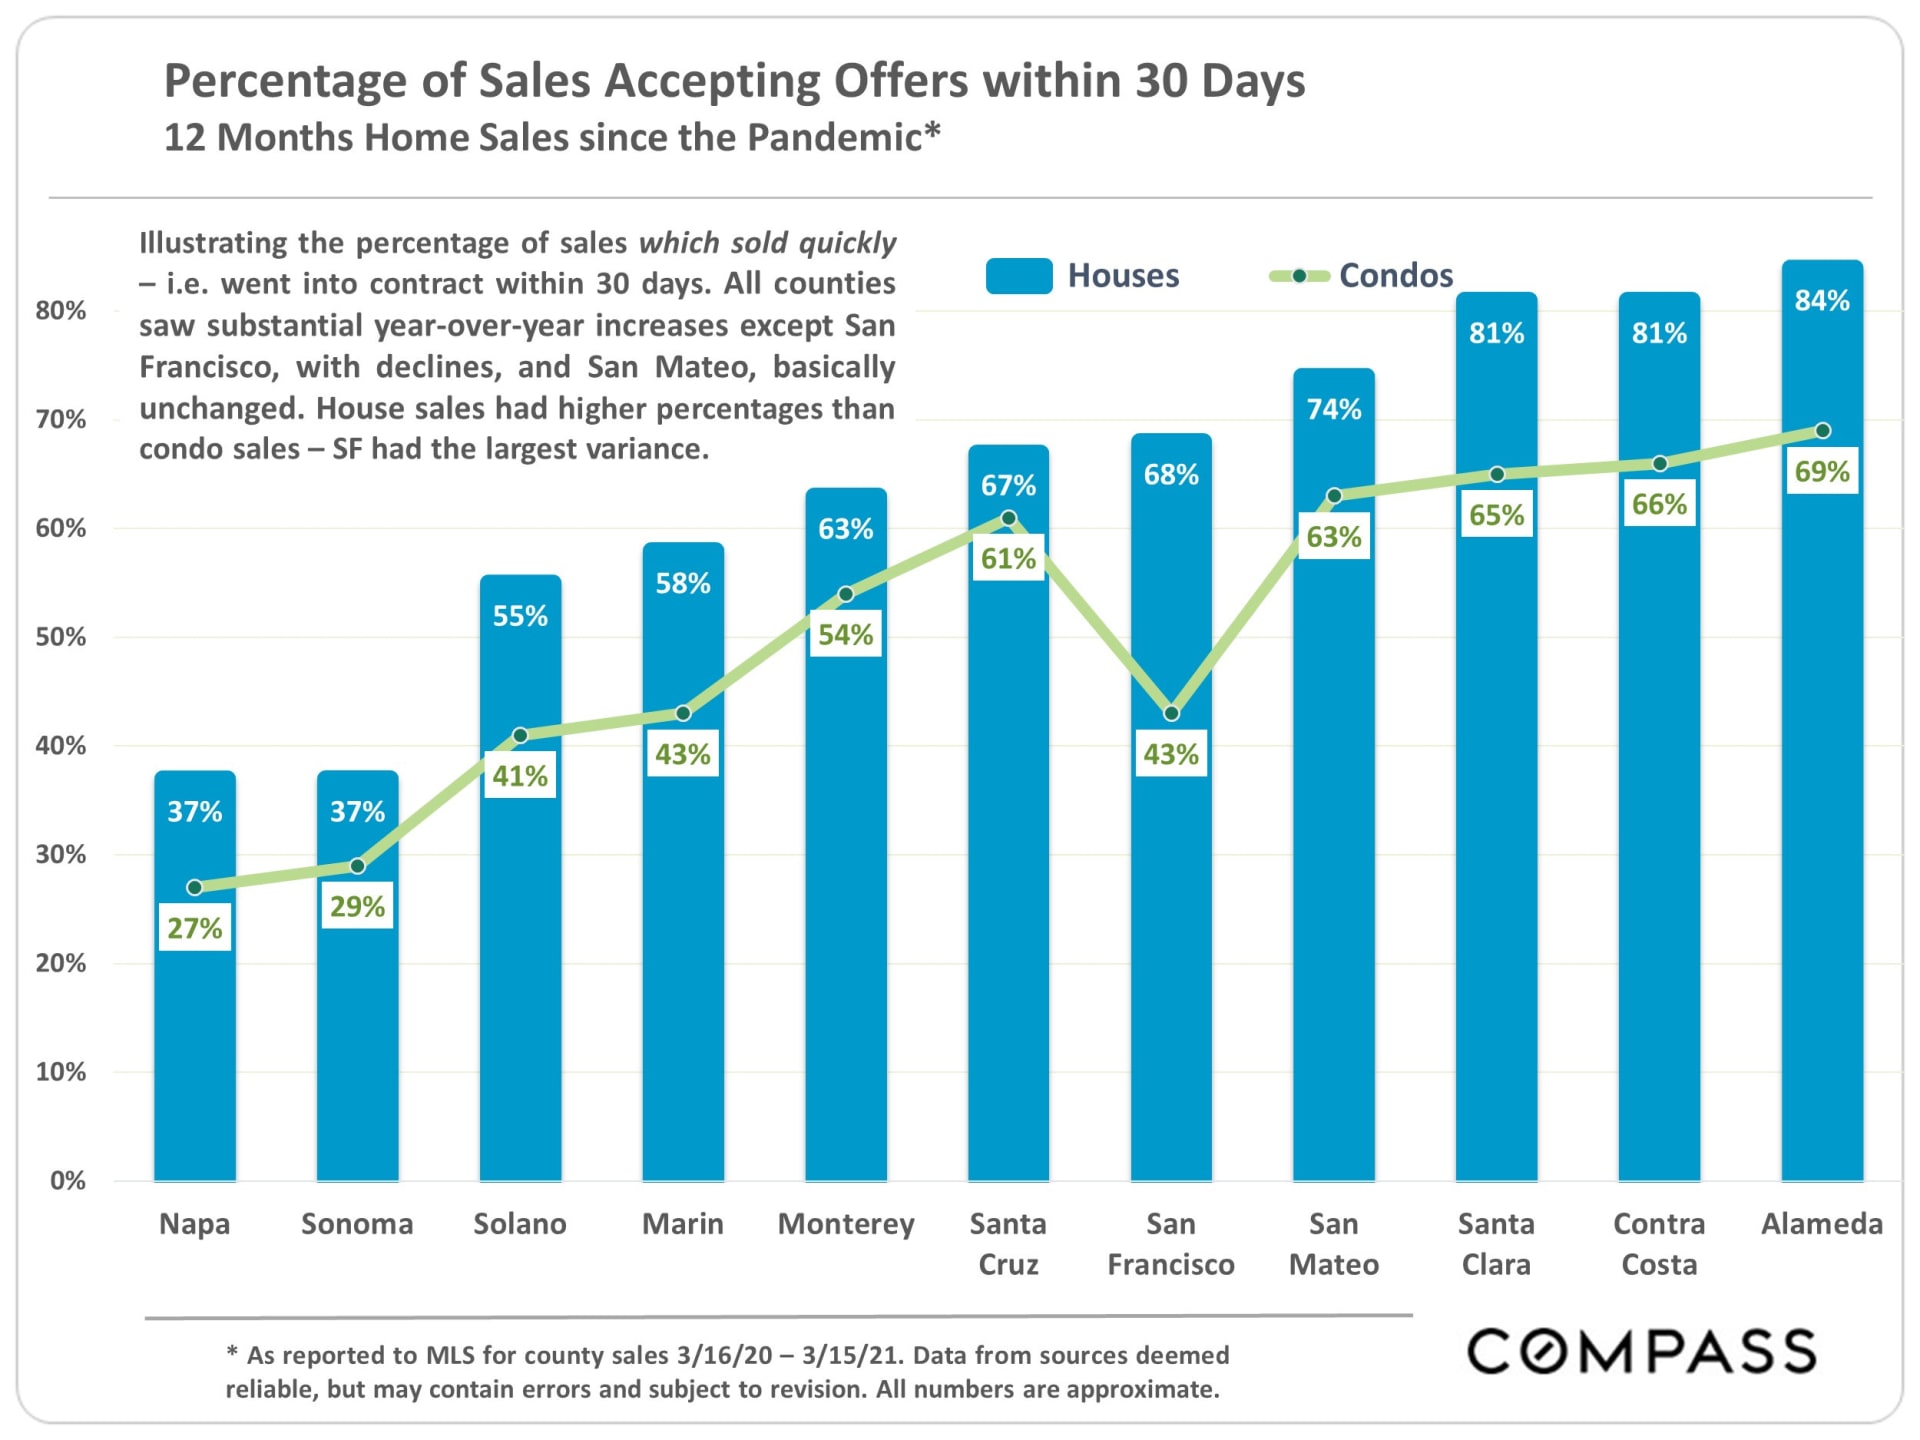
Percentage of Sales Accepting Offers within 30 Days
12 Months Home Sales since the Pandemic*
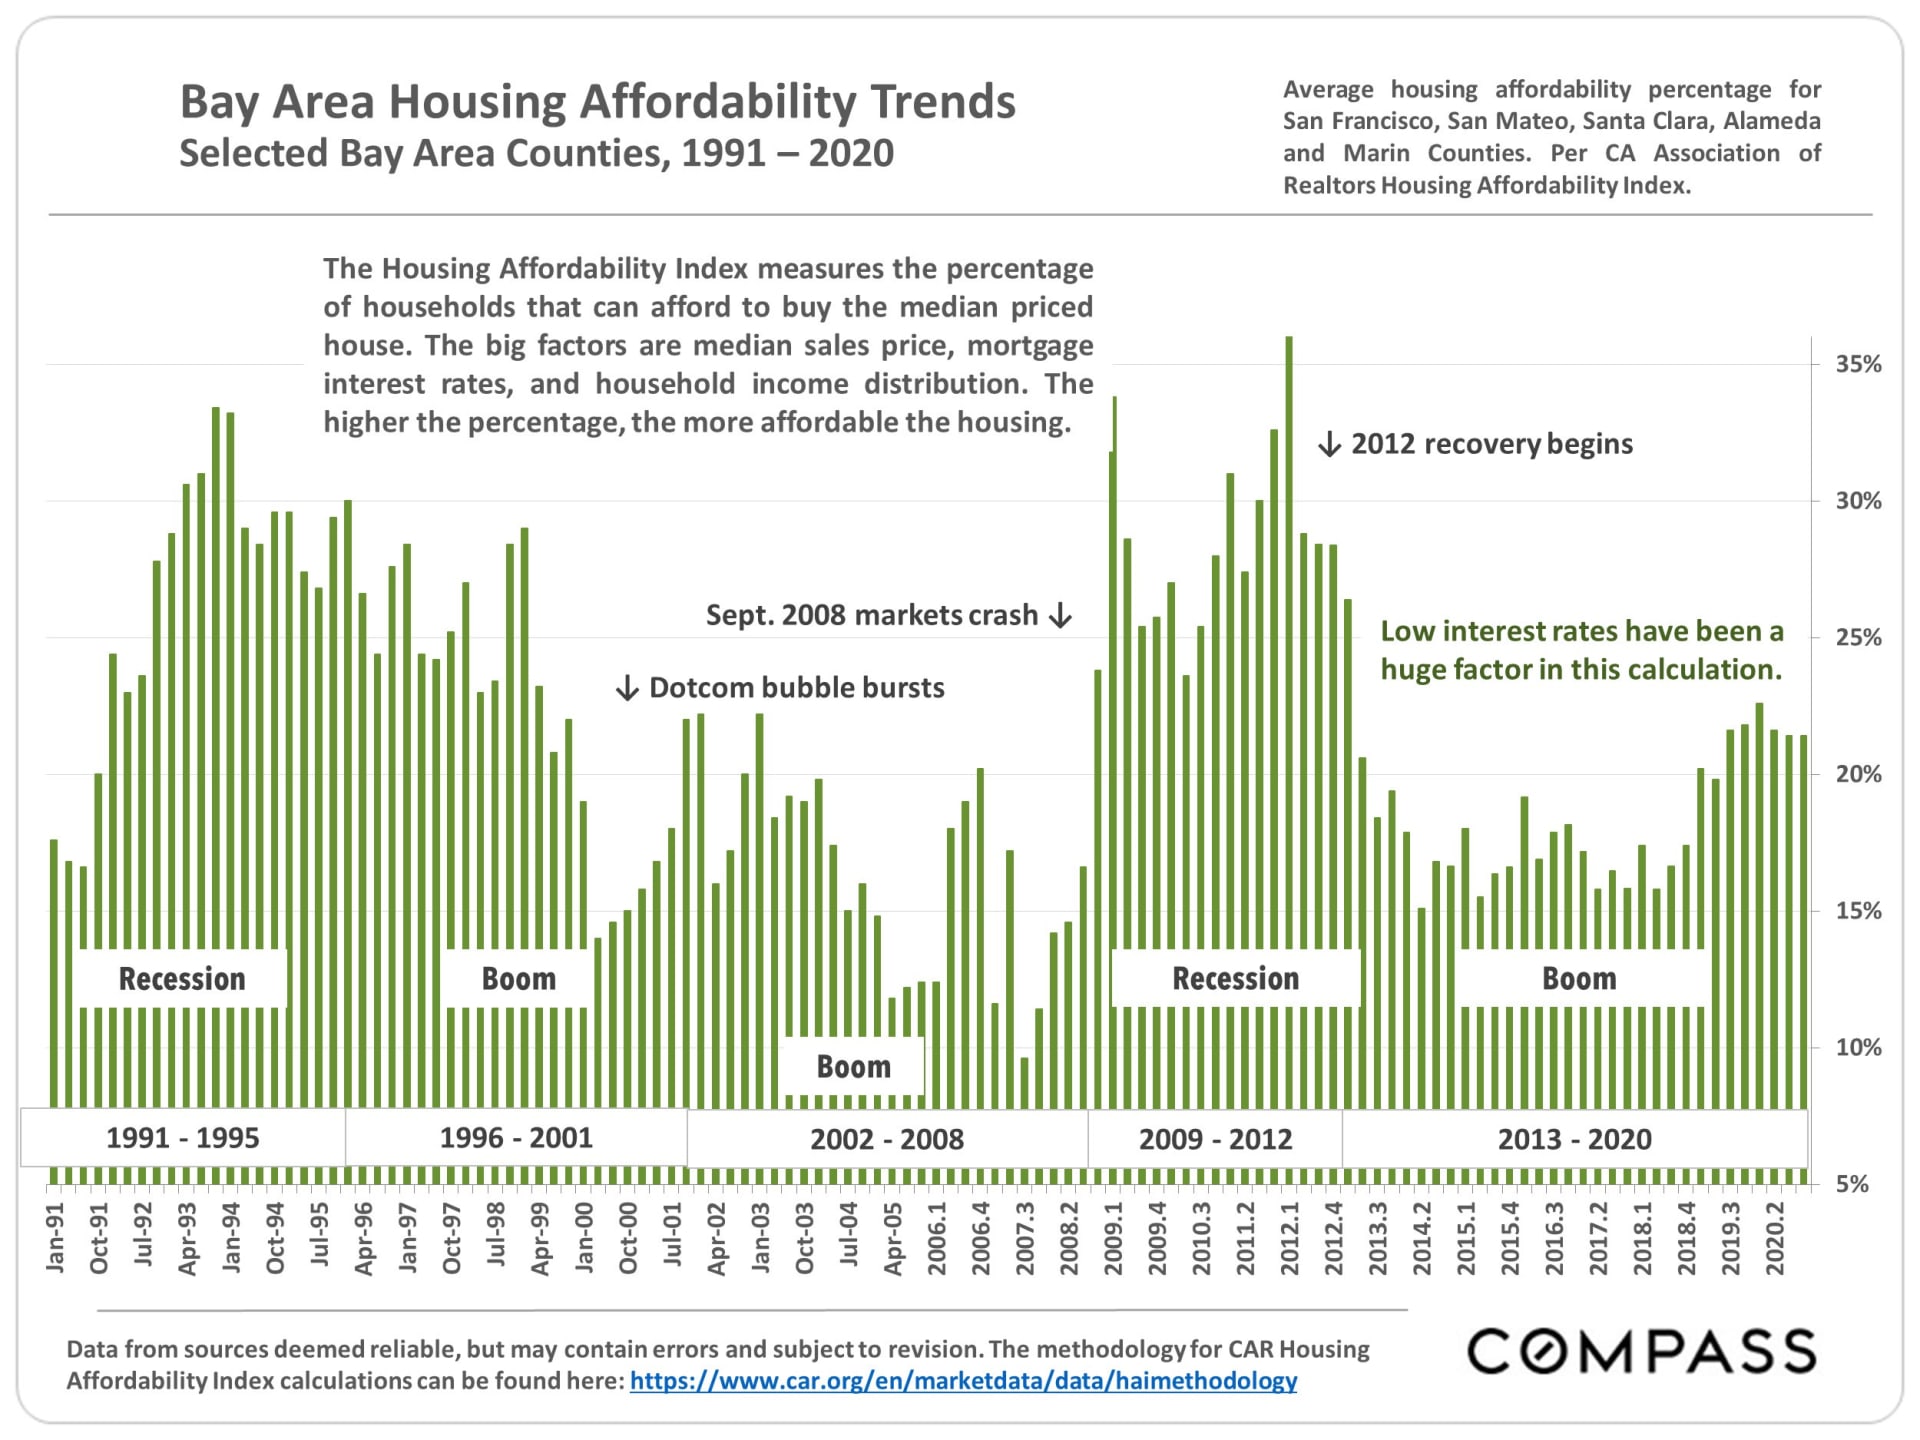
Bay Area Housing Affordability Trends
Selected Bay Area Counties, 1991-2020
The Graphs and Tables Following Review:
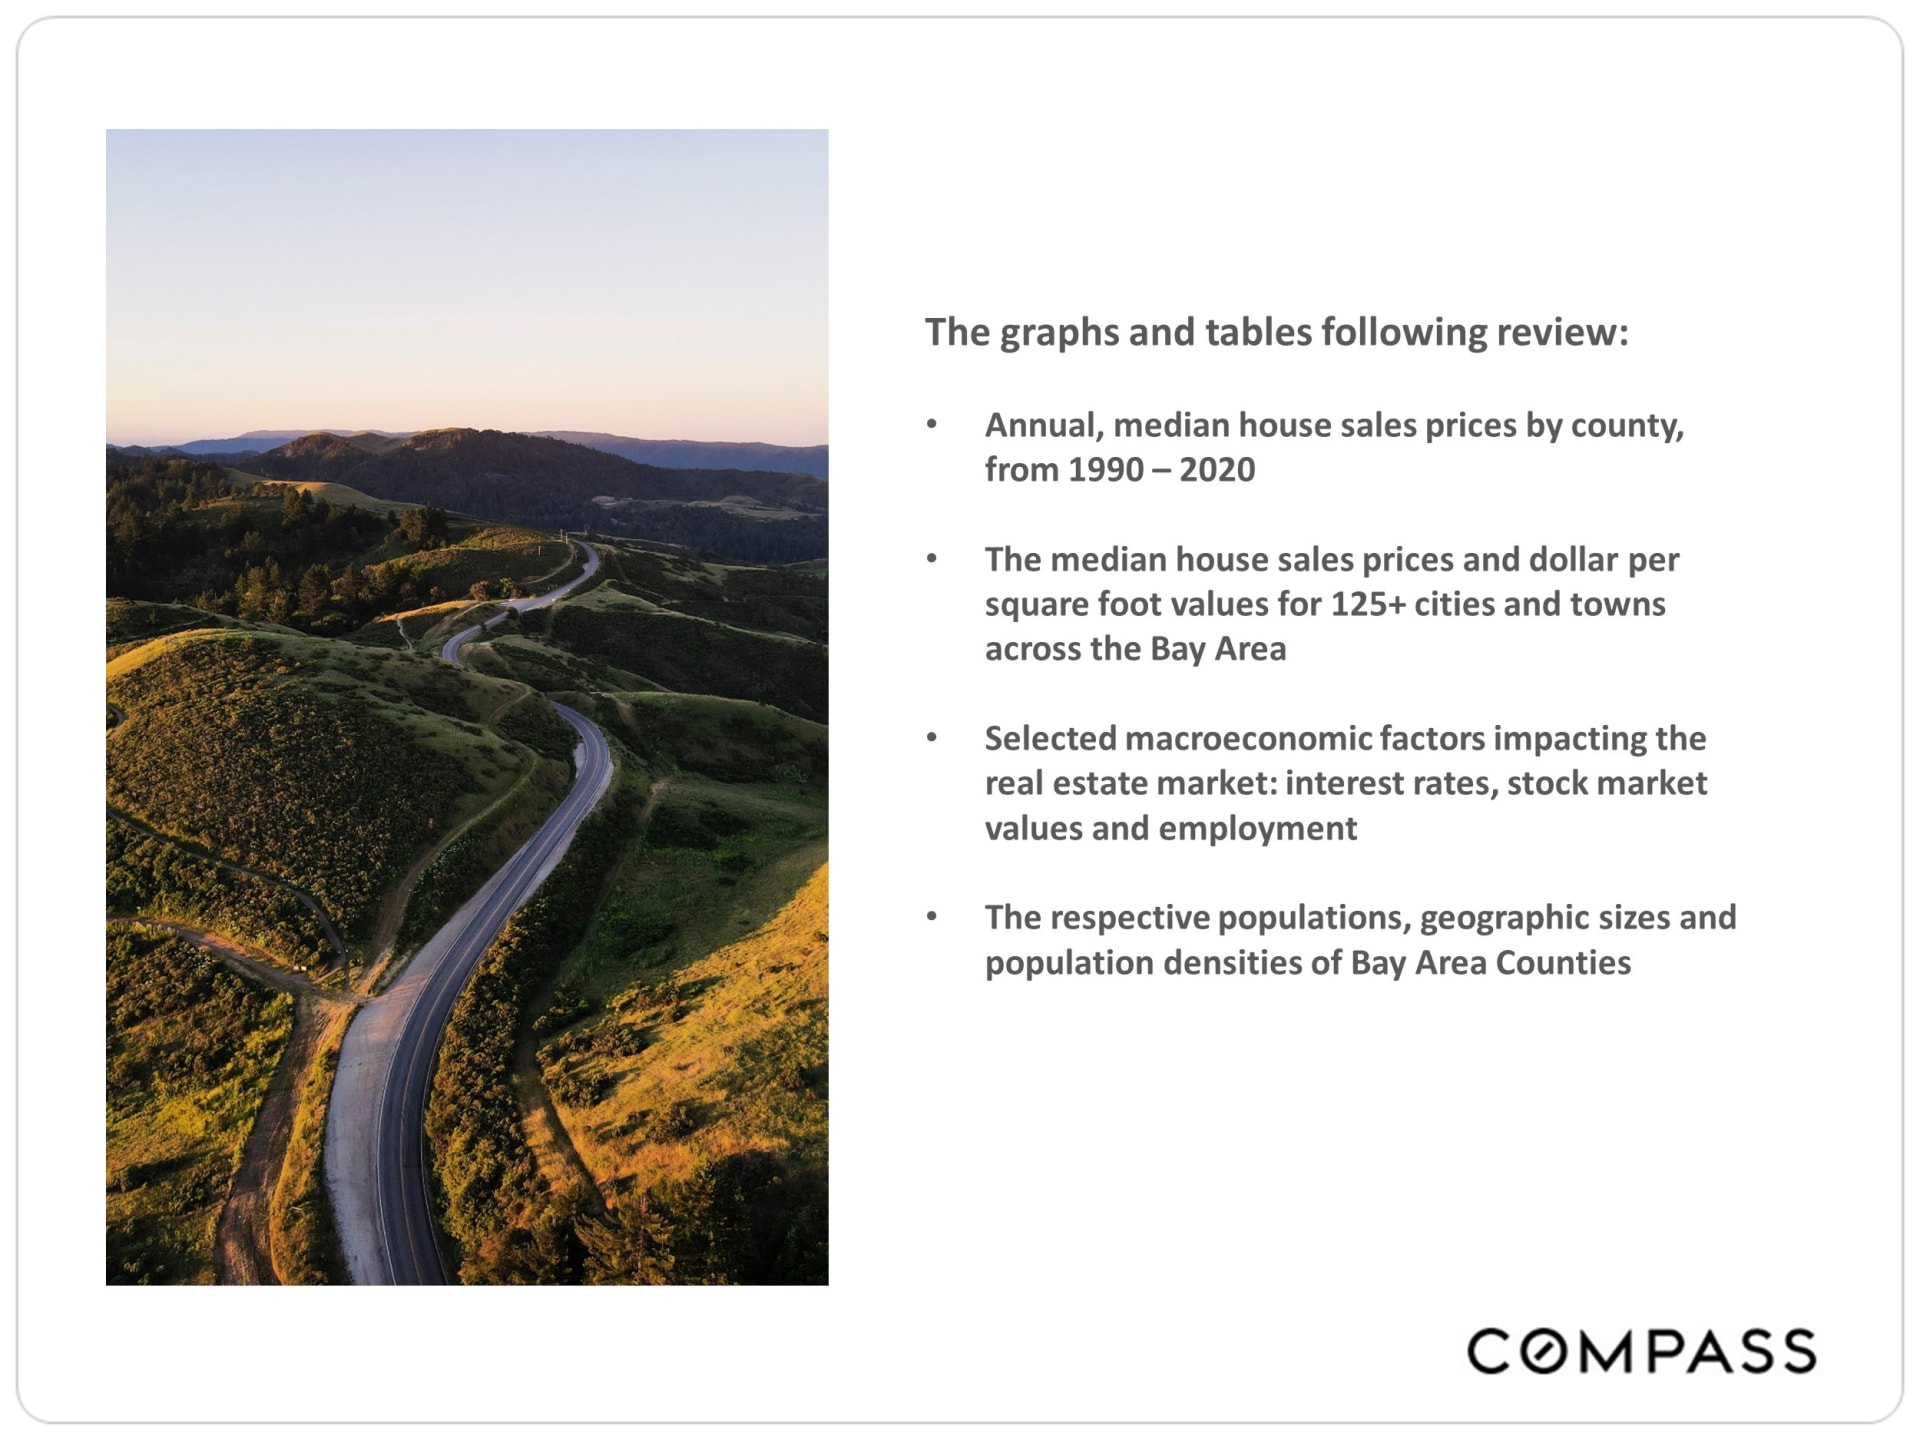
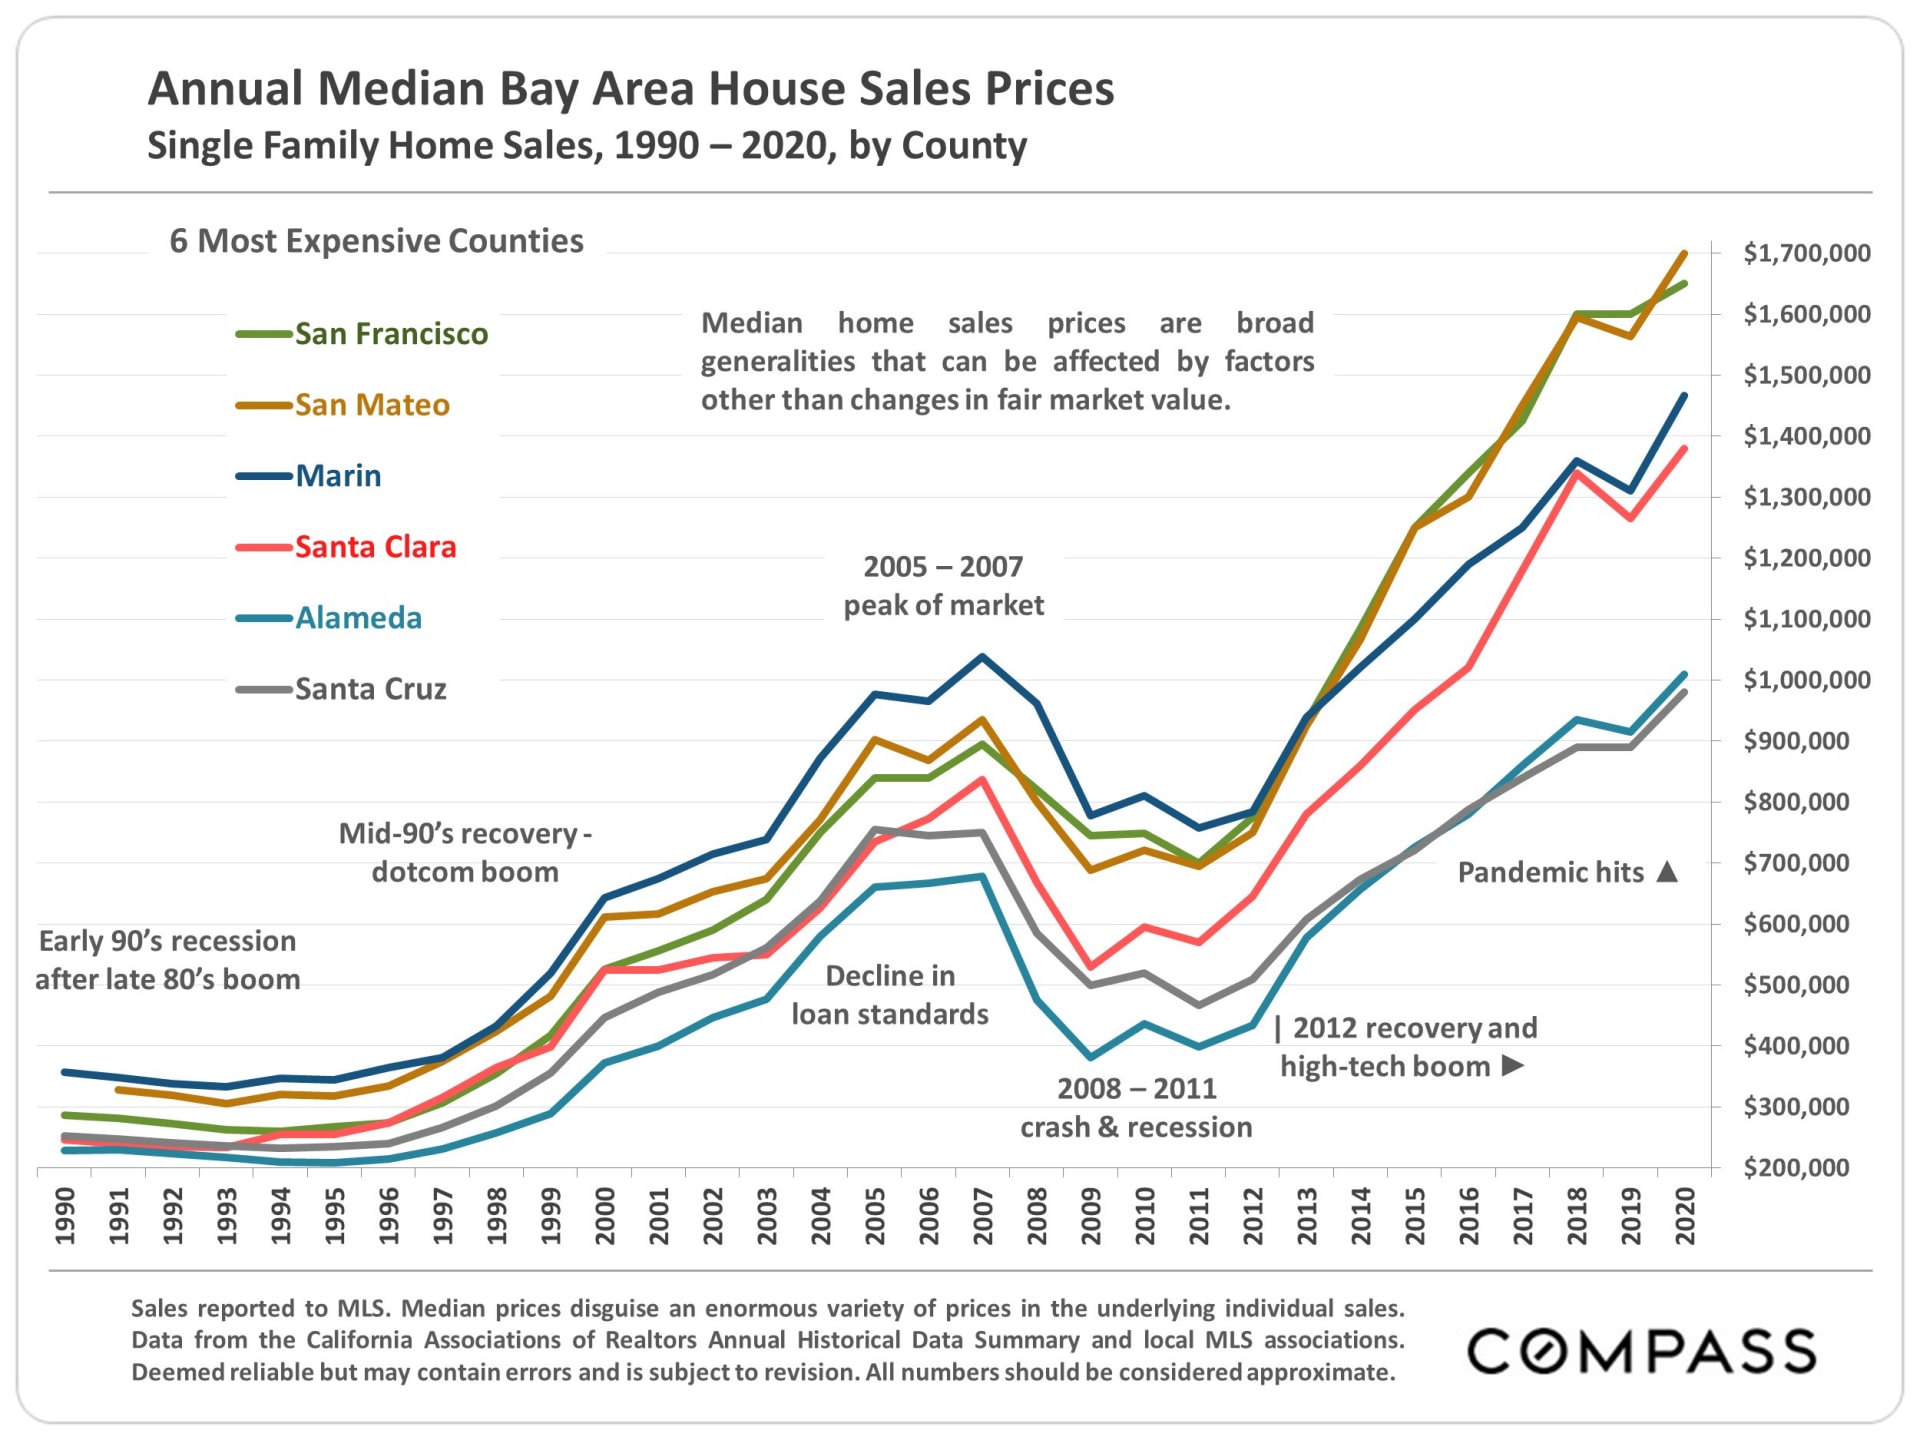
Annual Median Bay Area House Sales Prices
Single Family Home Sales, 1990-2020, by County
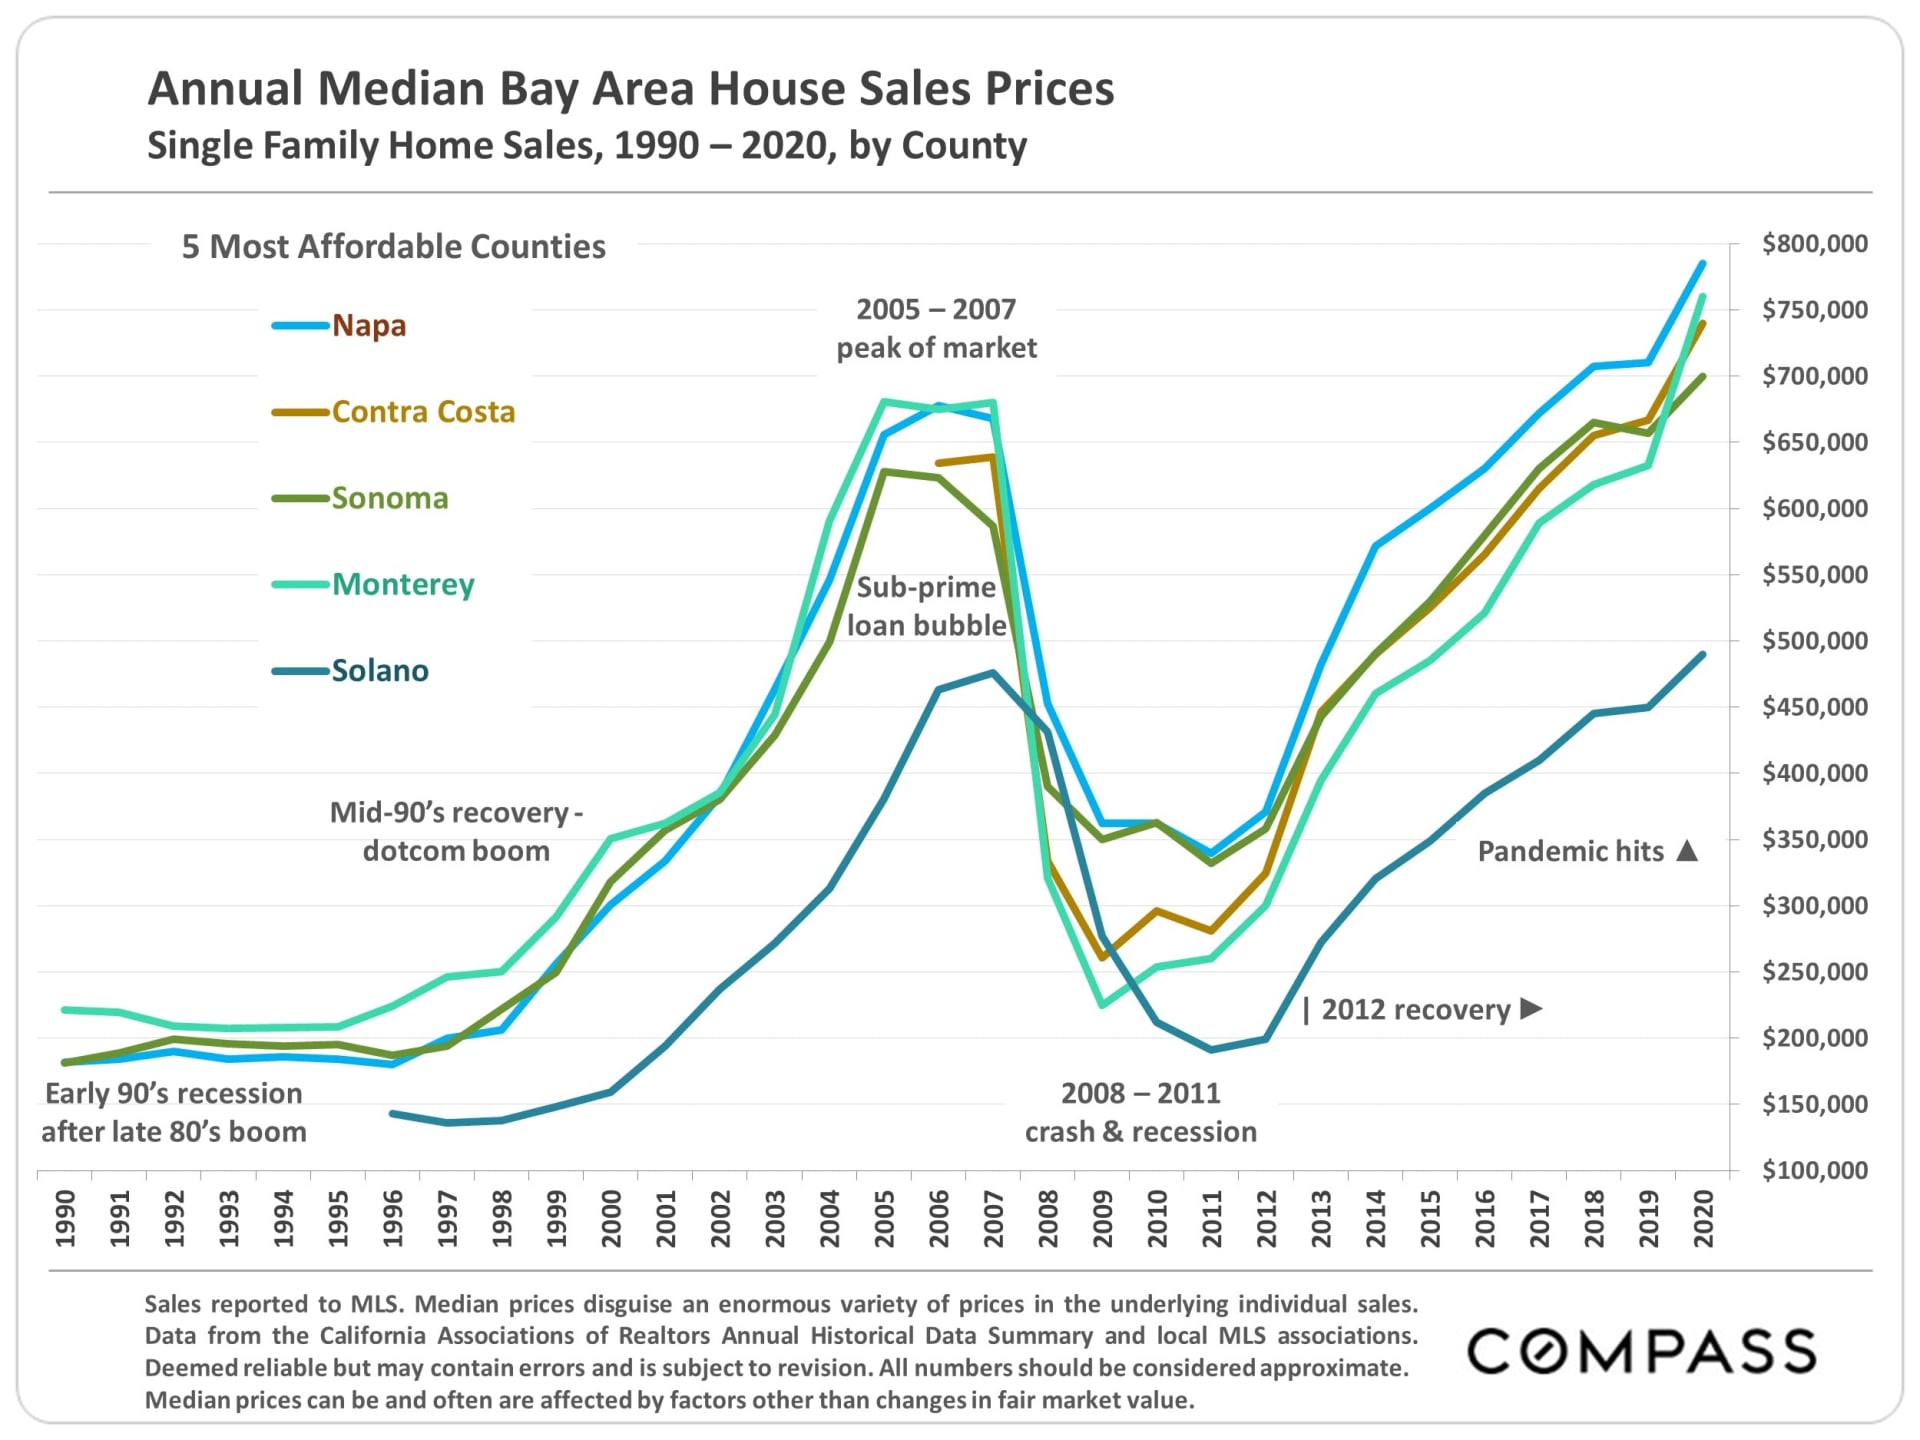
Annual Median Bay Area House Sales Prices
Single Family Home Sales, 1990-2020, by County
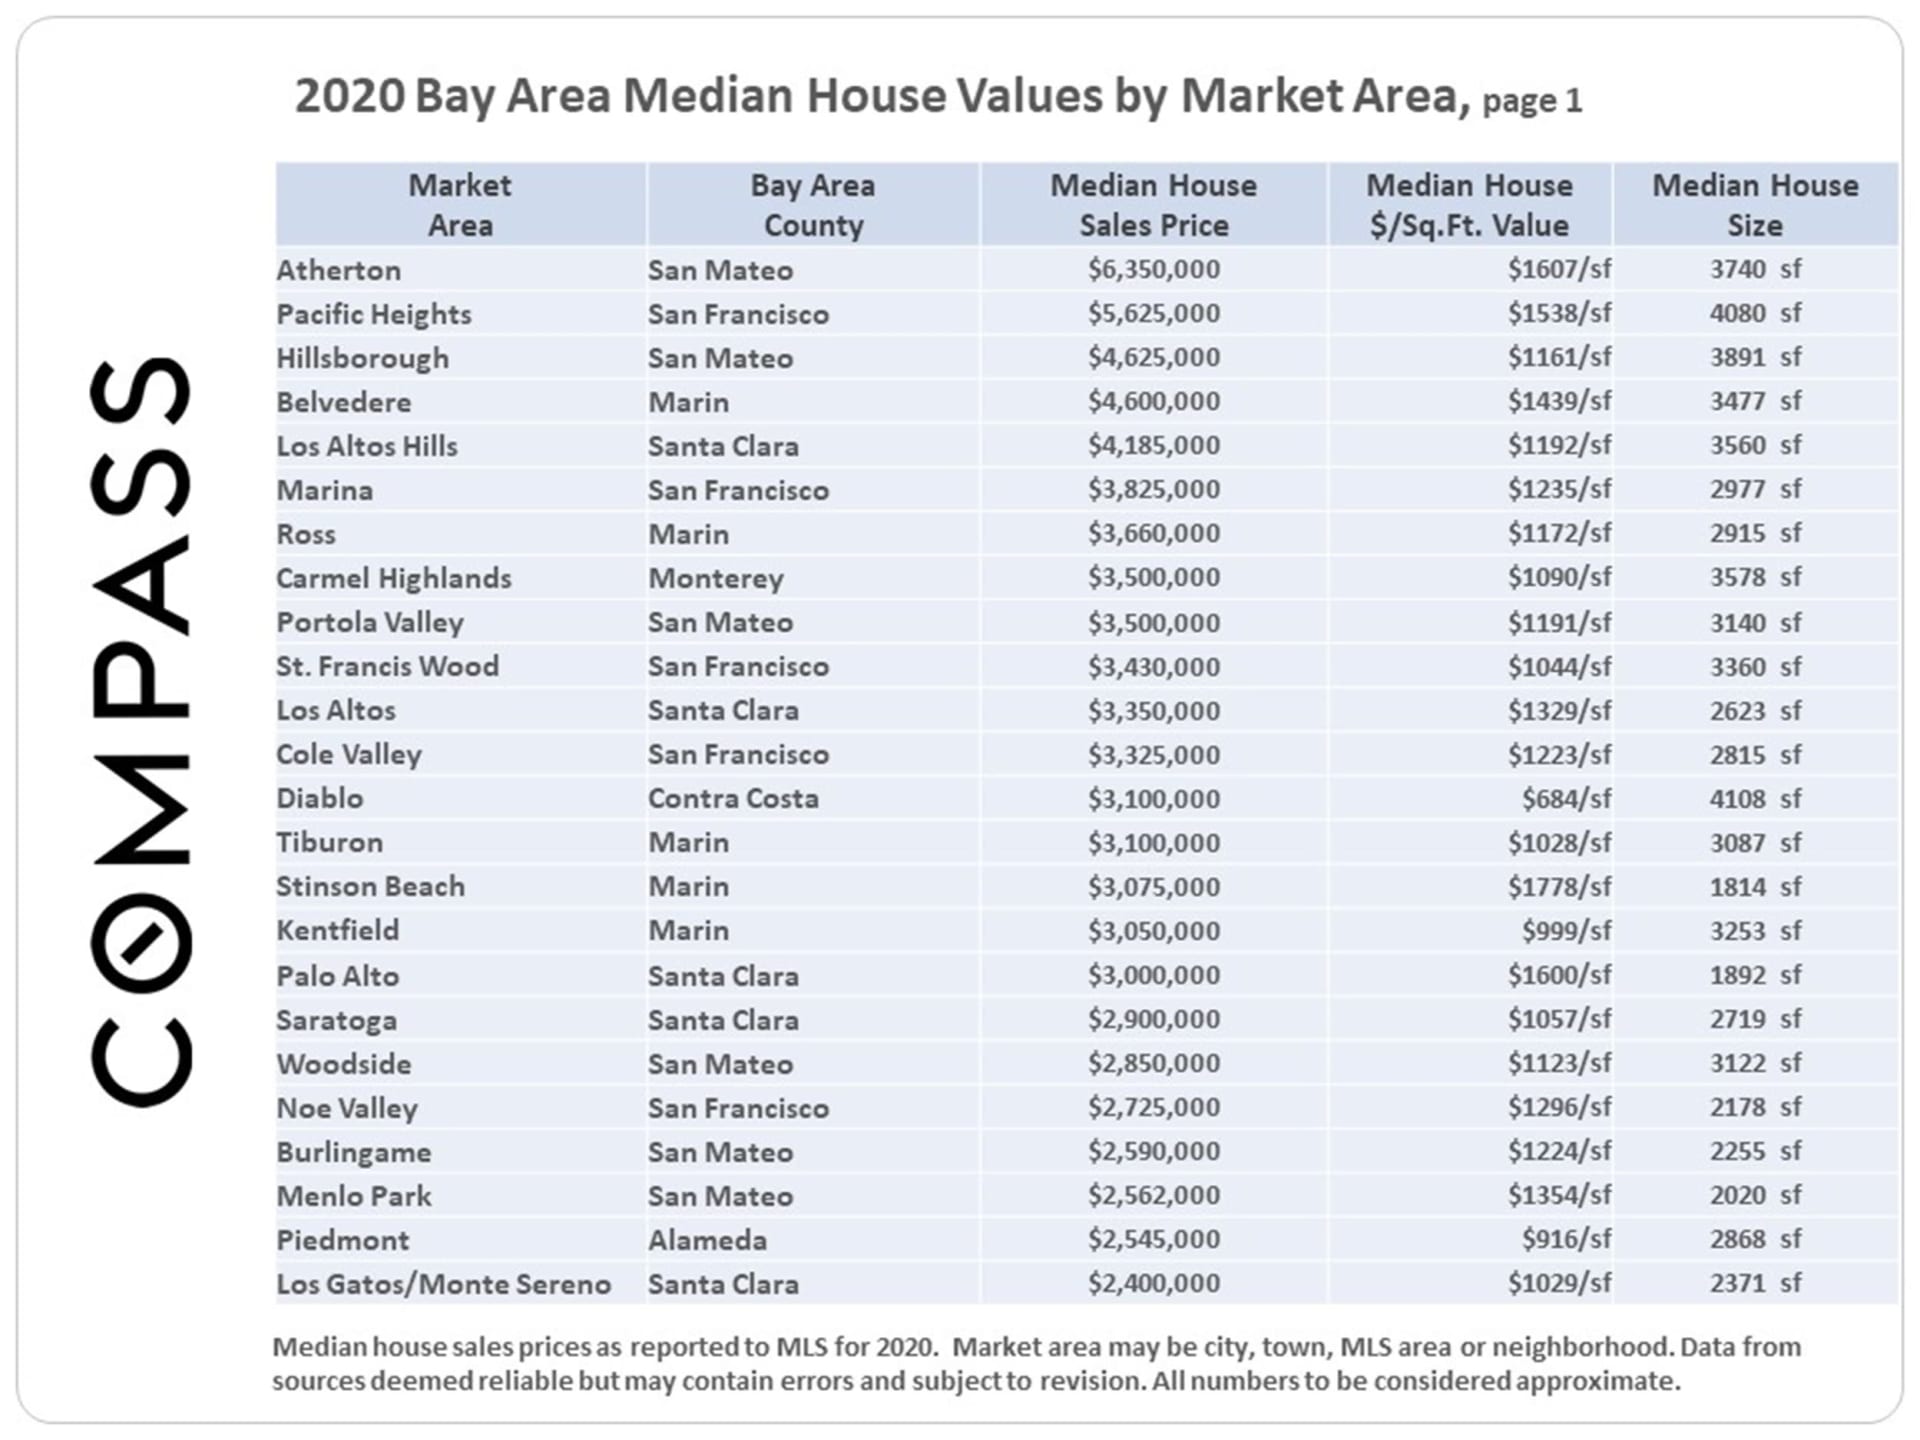
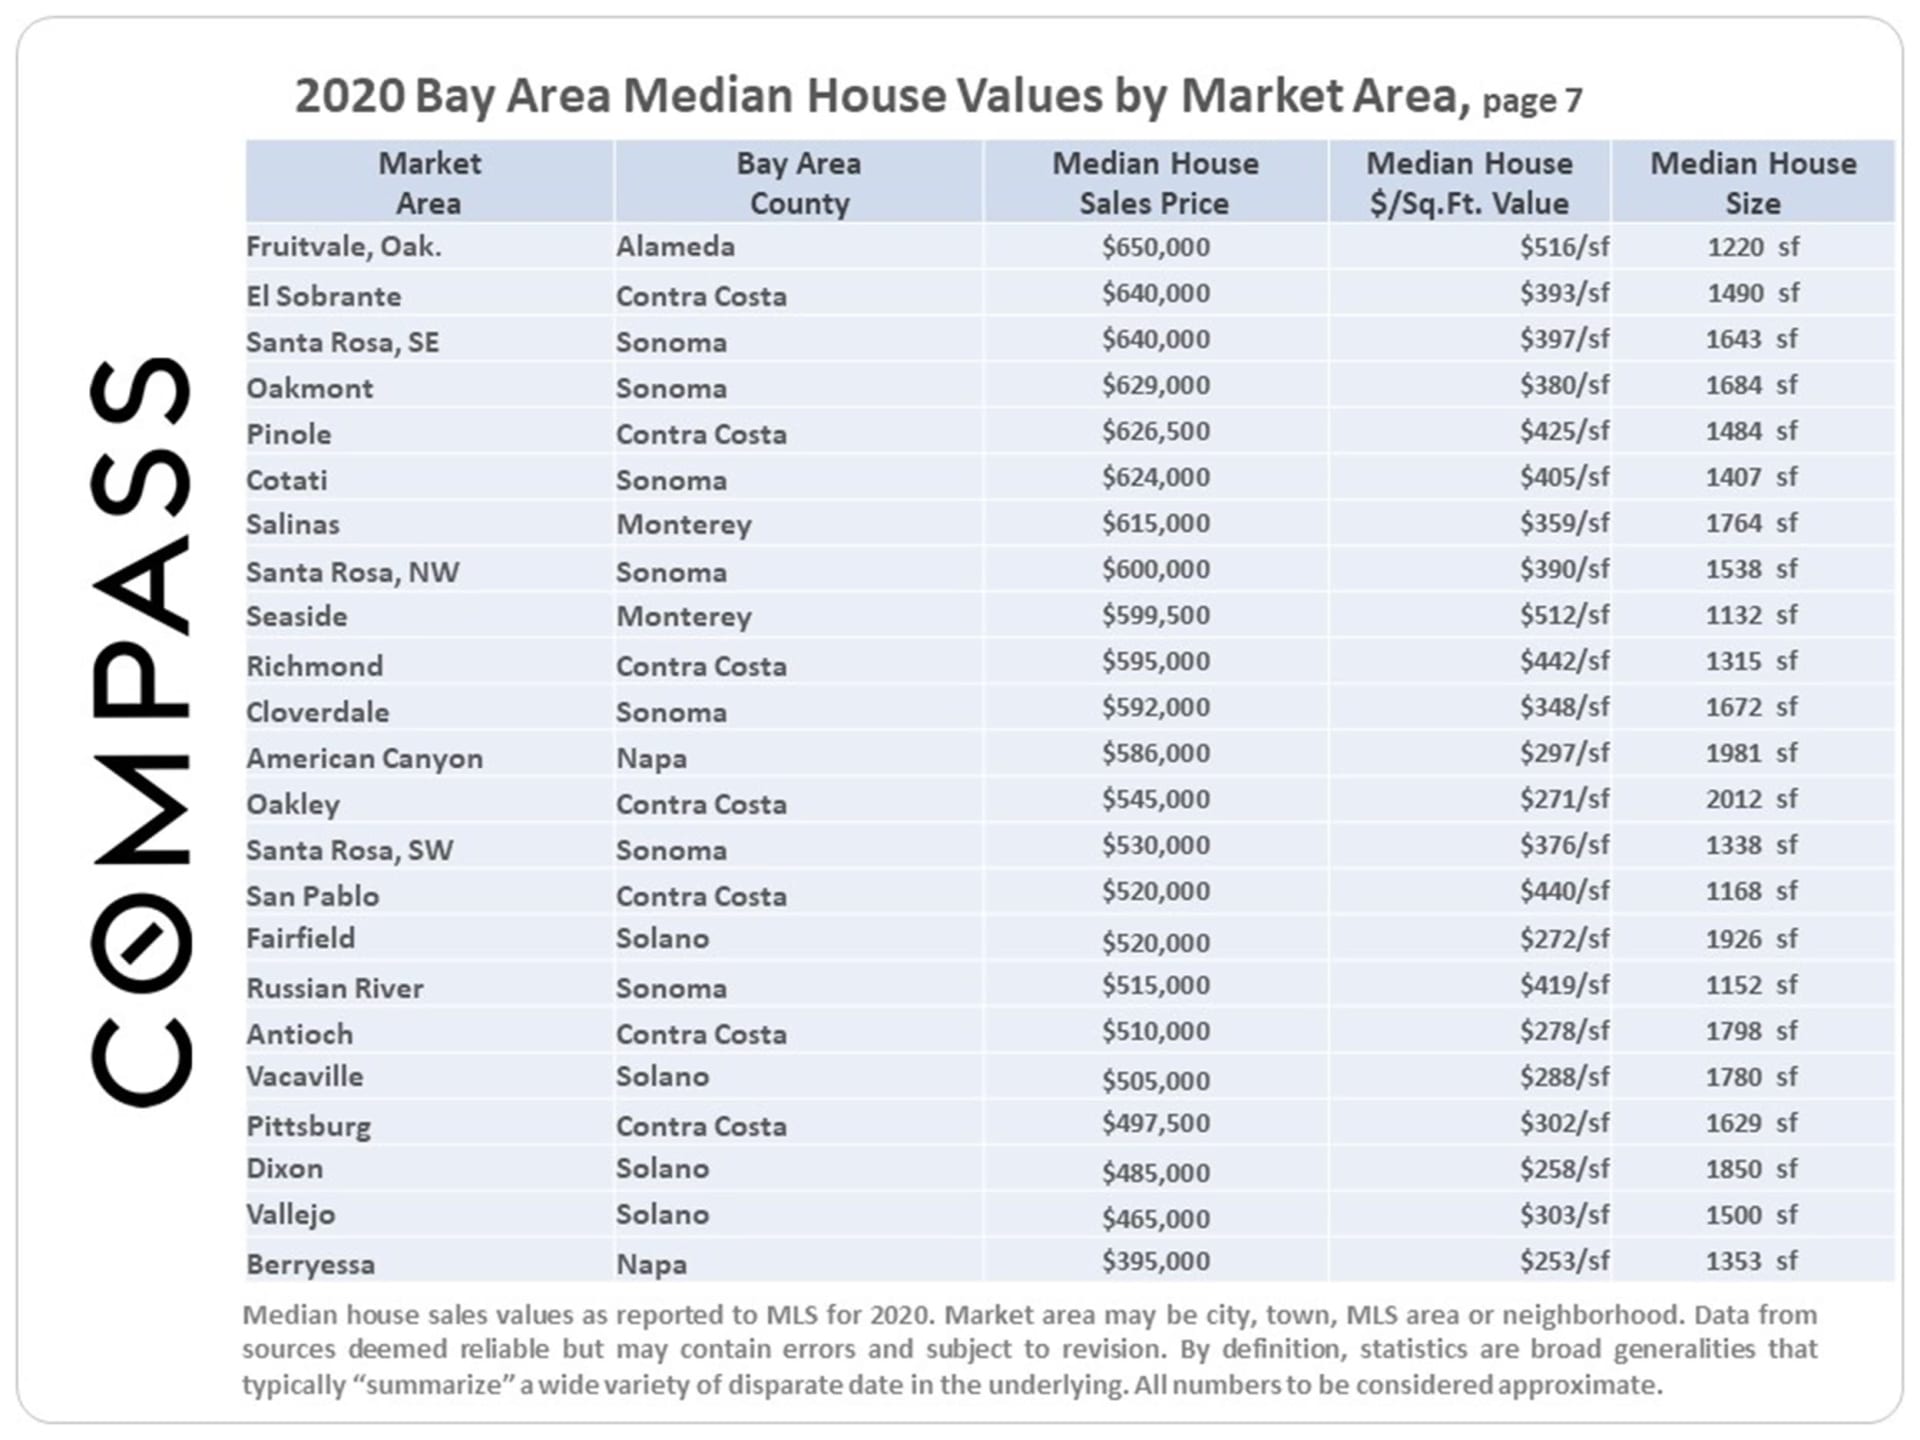
2020 Bay Area Median House Values by Market Area, page 1
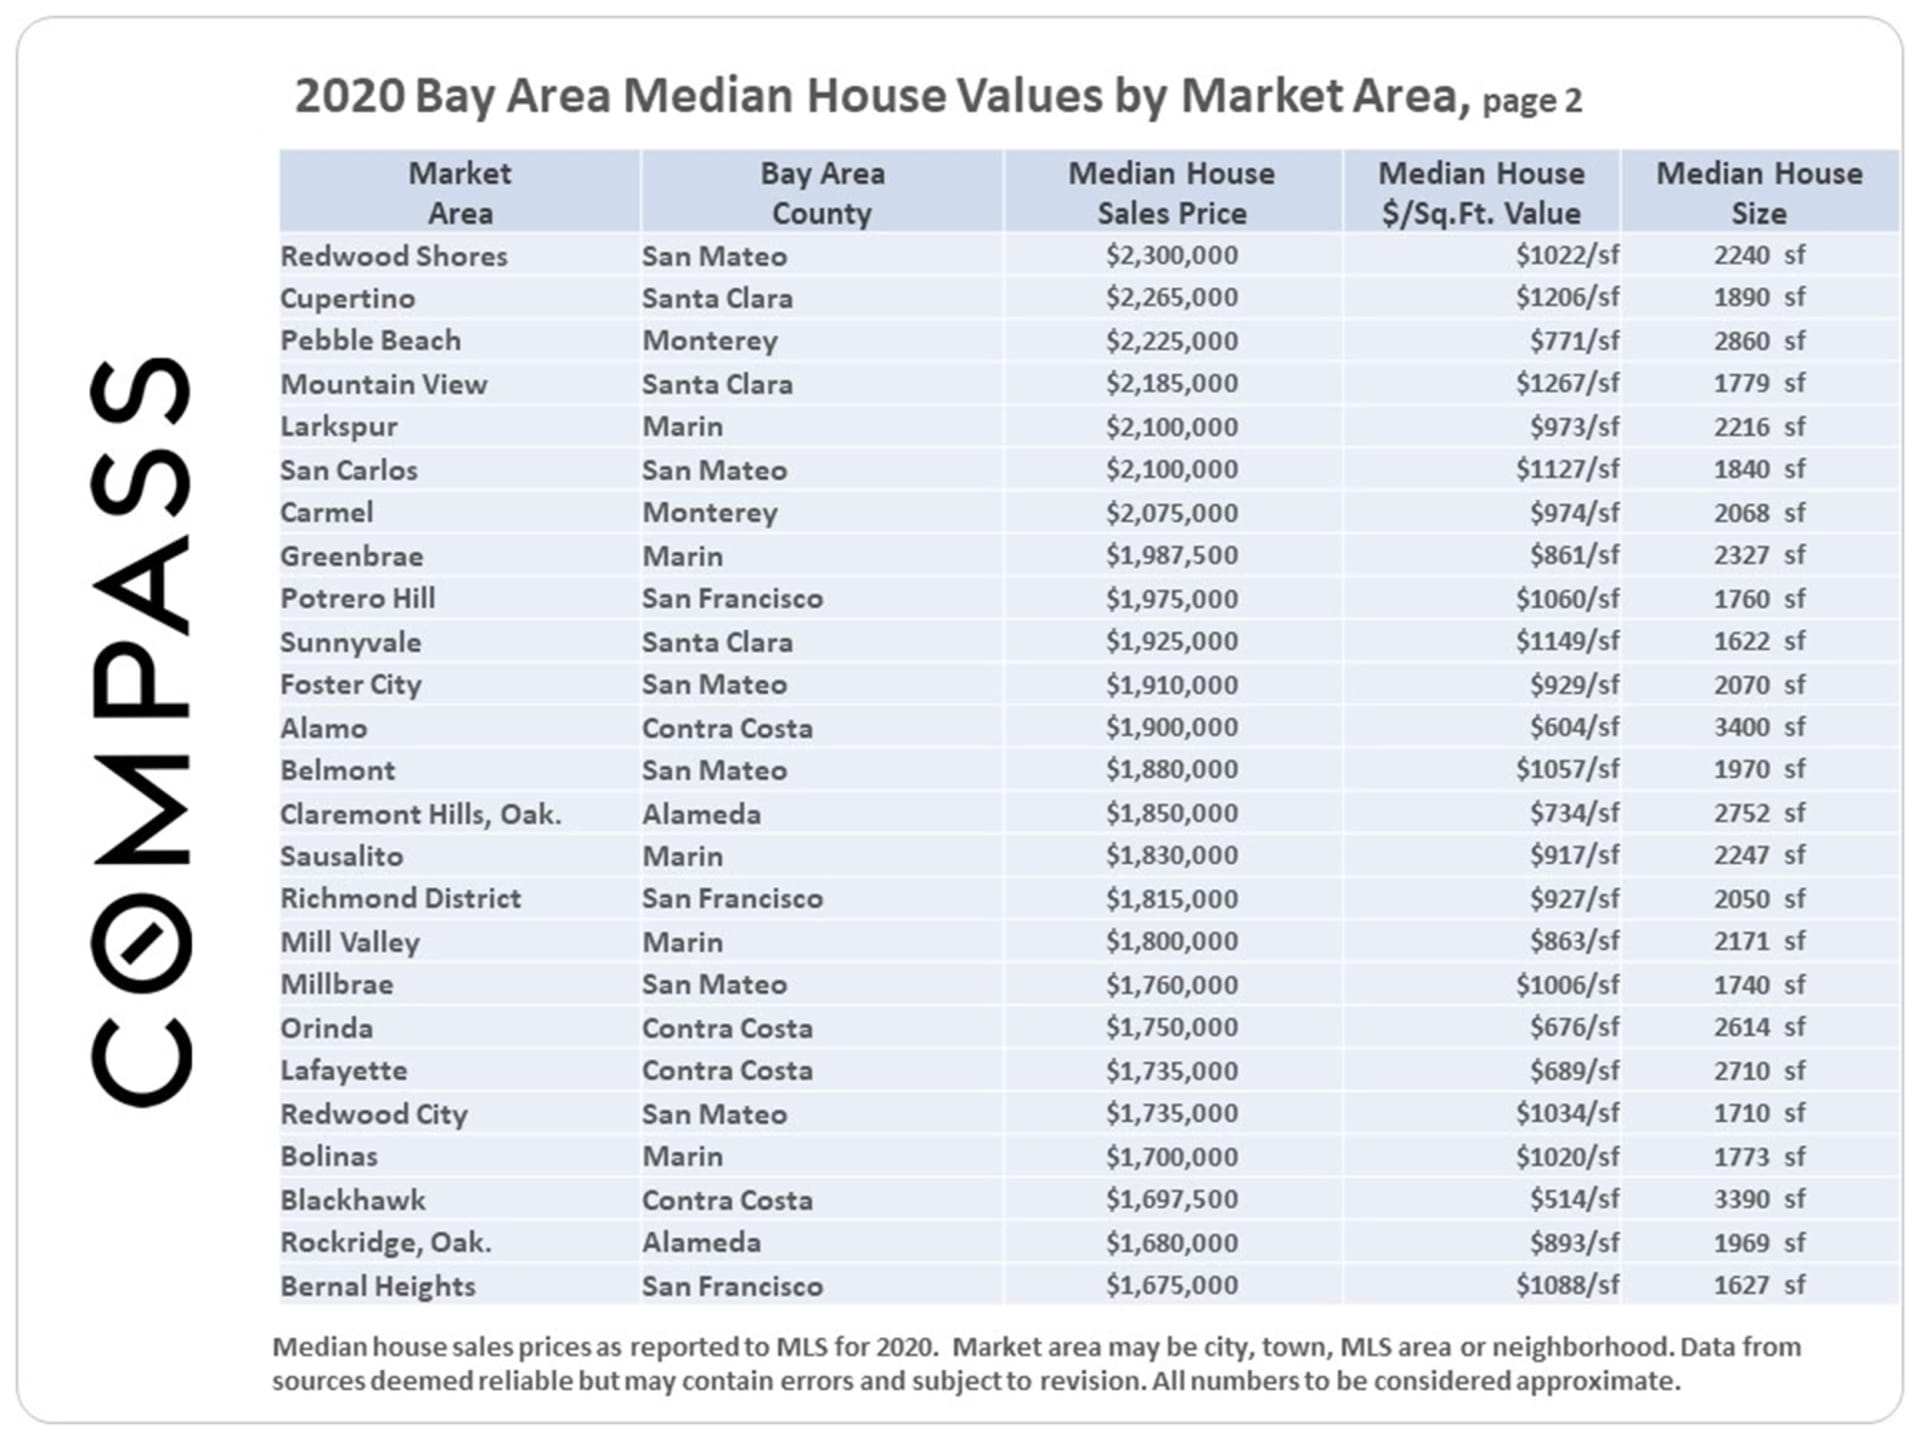
2020 Bay Area Median House Values by Market Area, page 2
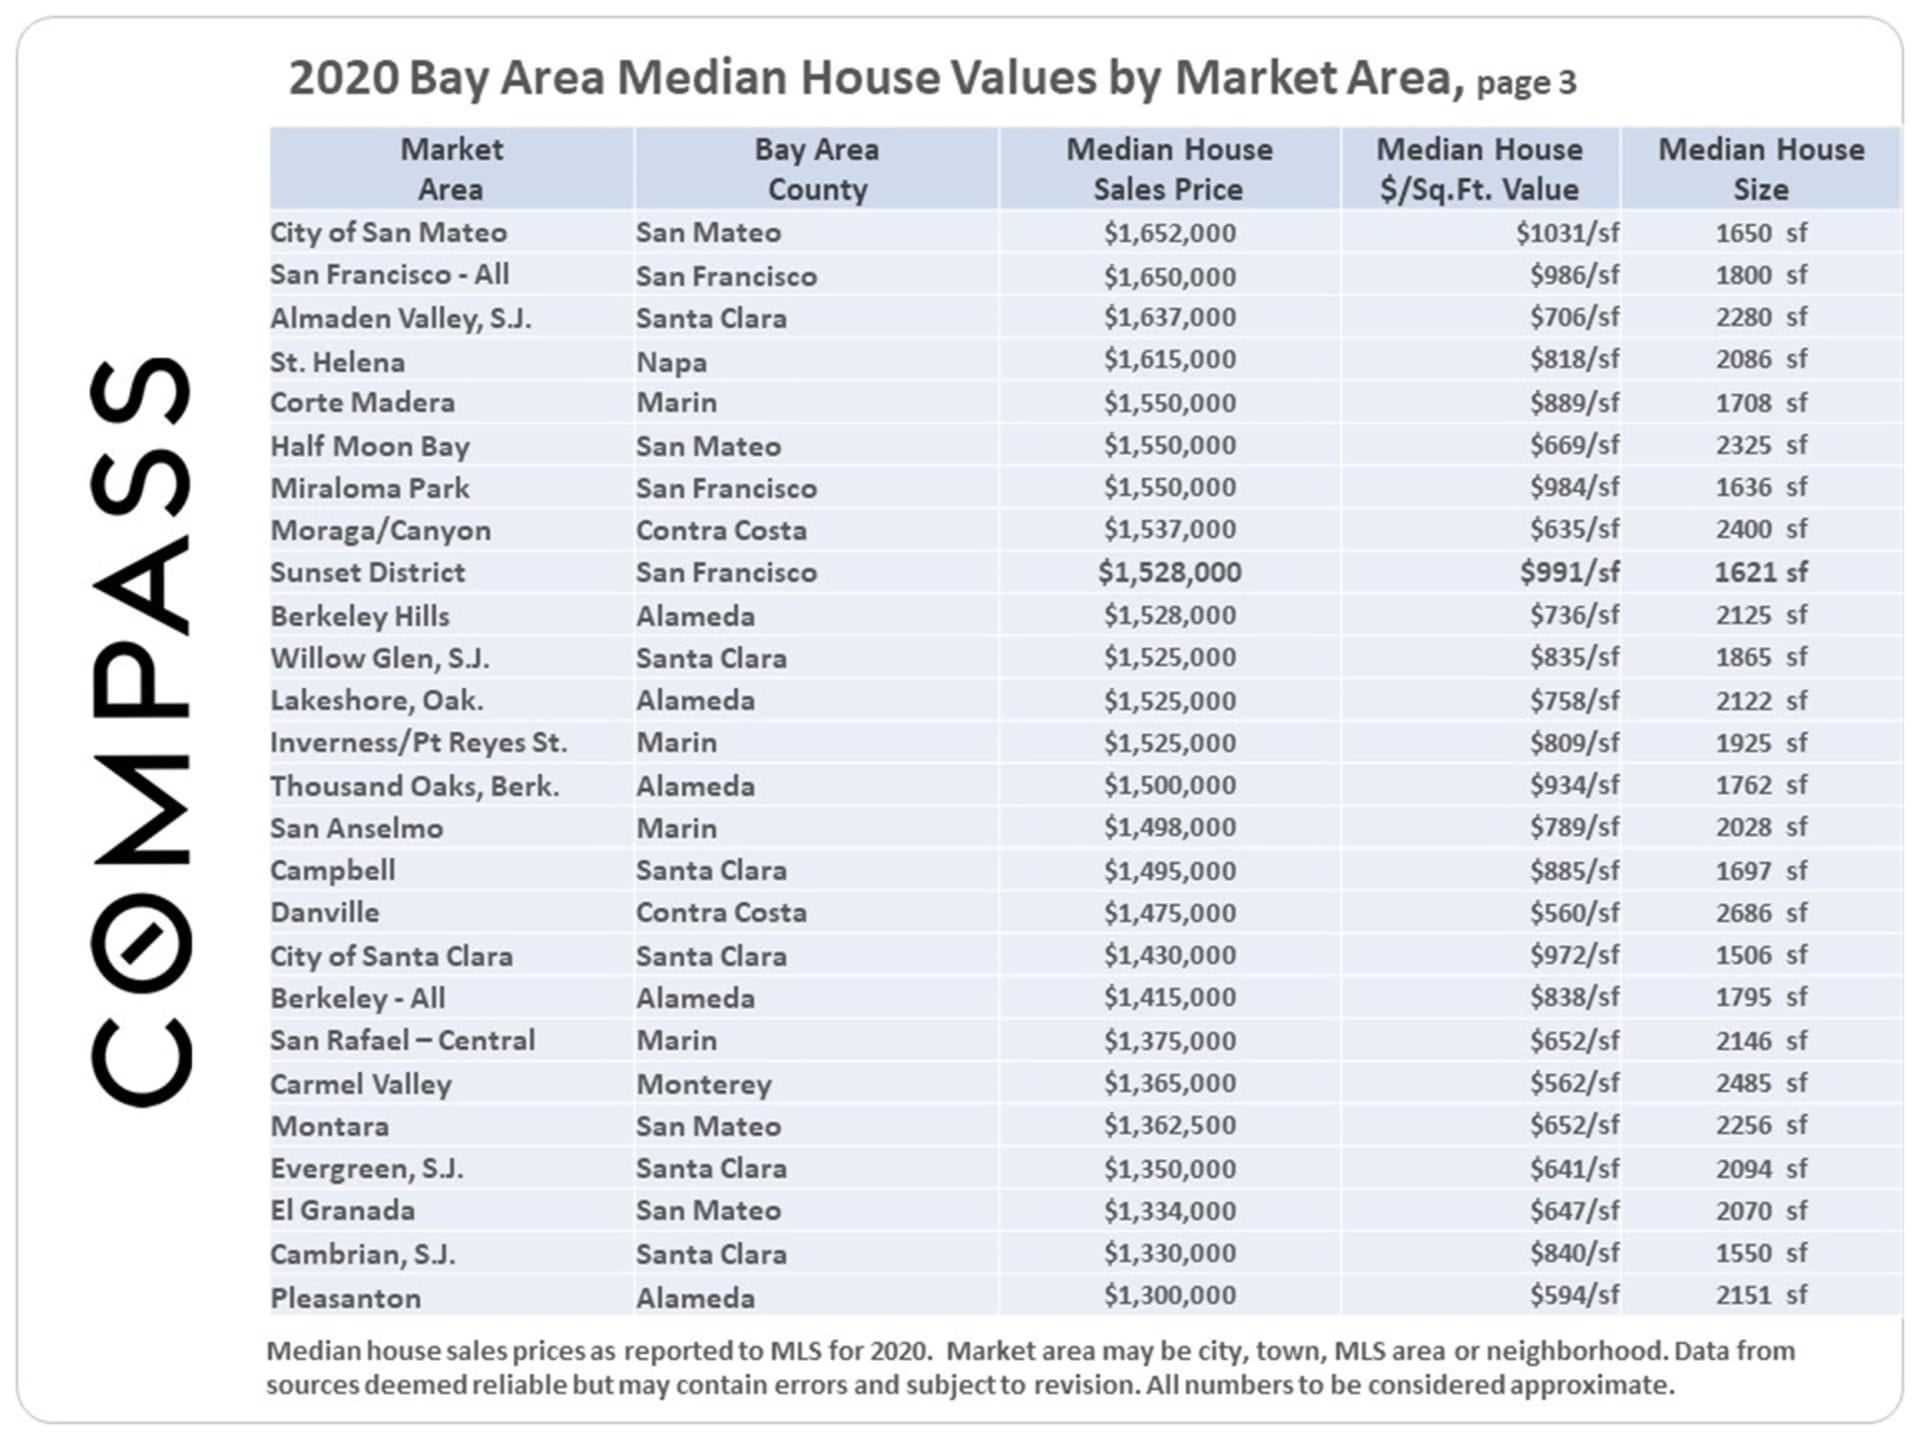
2020 Bay Area Median House Values by Market Area, page 3
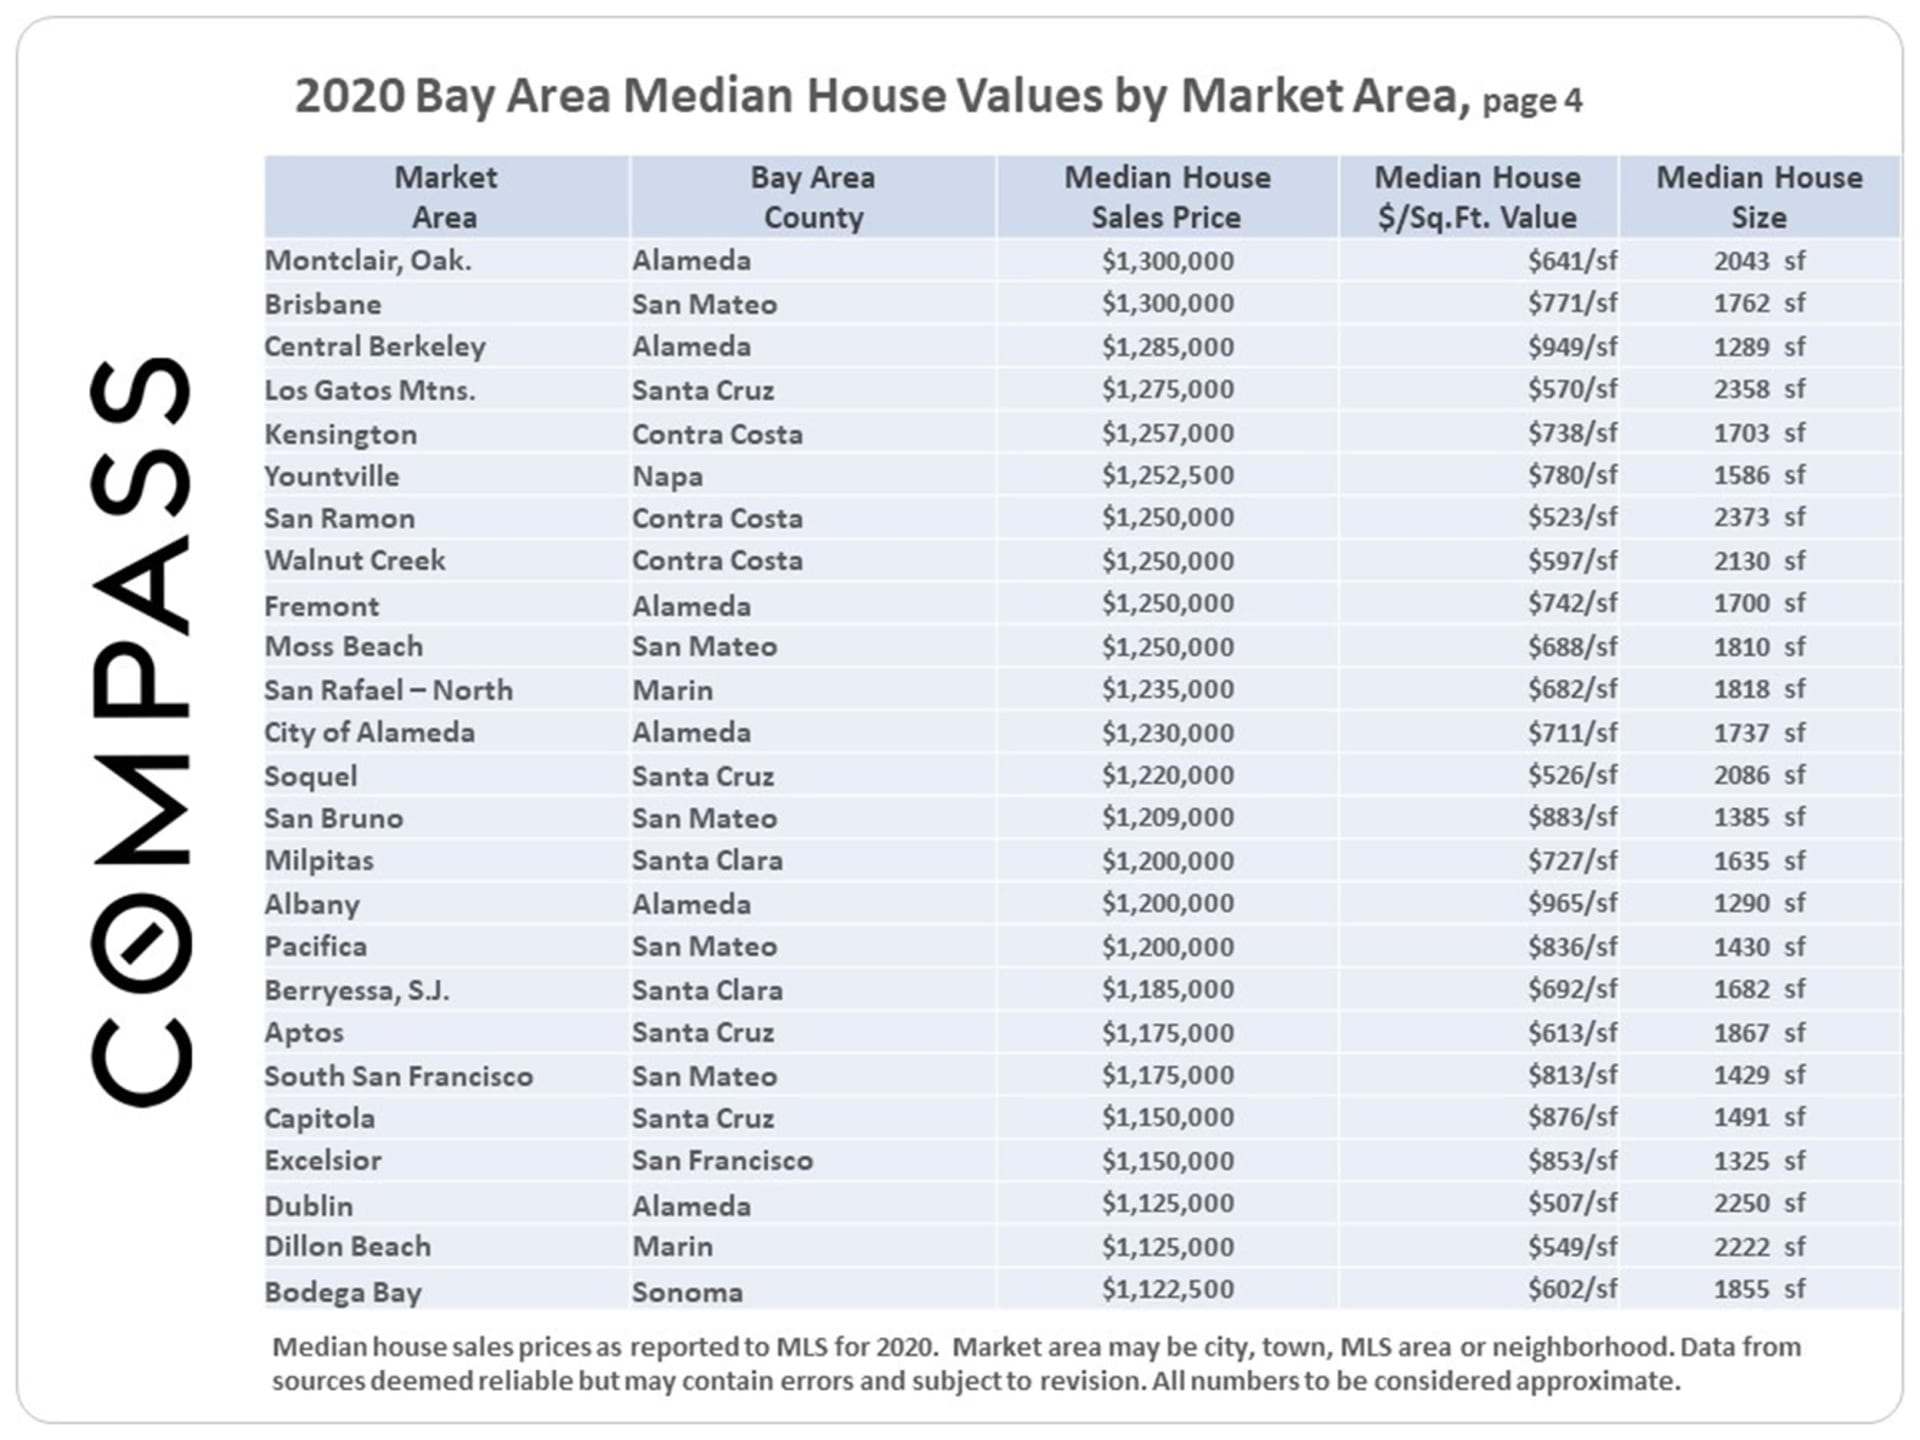
2020 Bay Area Median House Values by Market Area, page 4
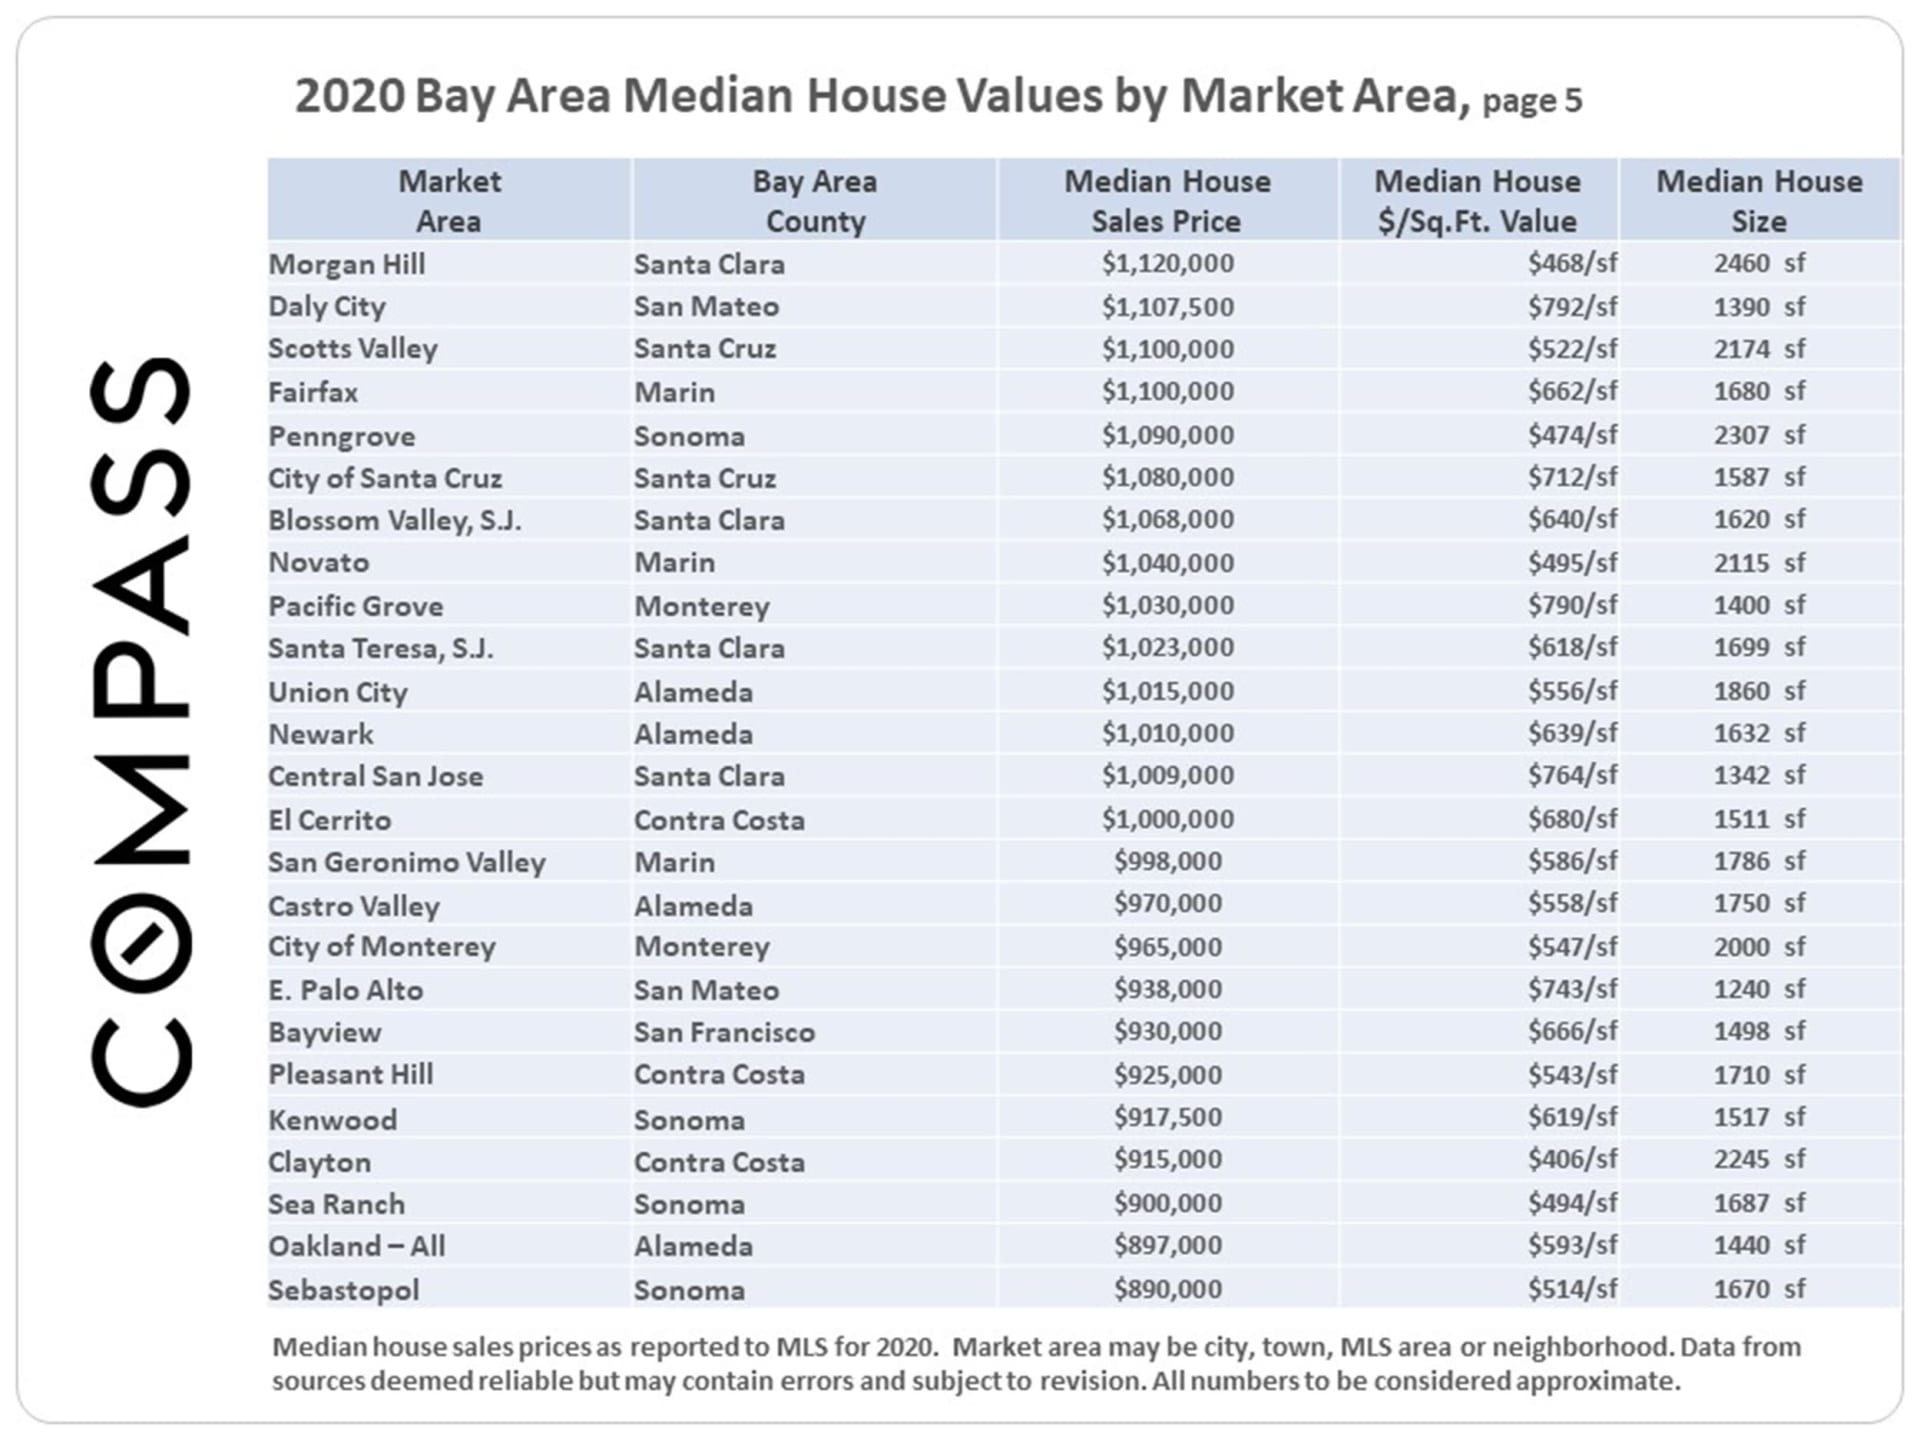
2020 Bay Area Median House Values by Market Area, page 5
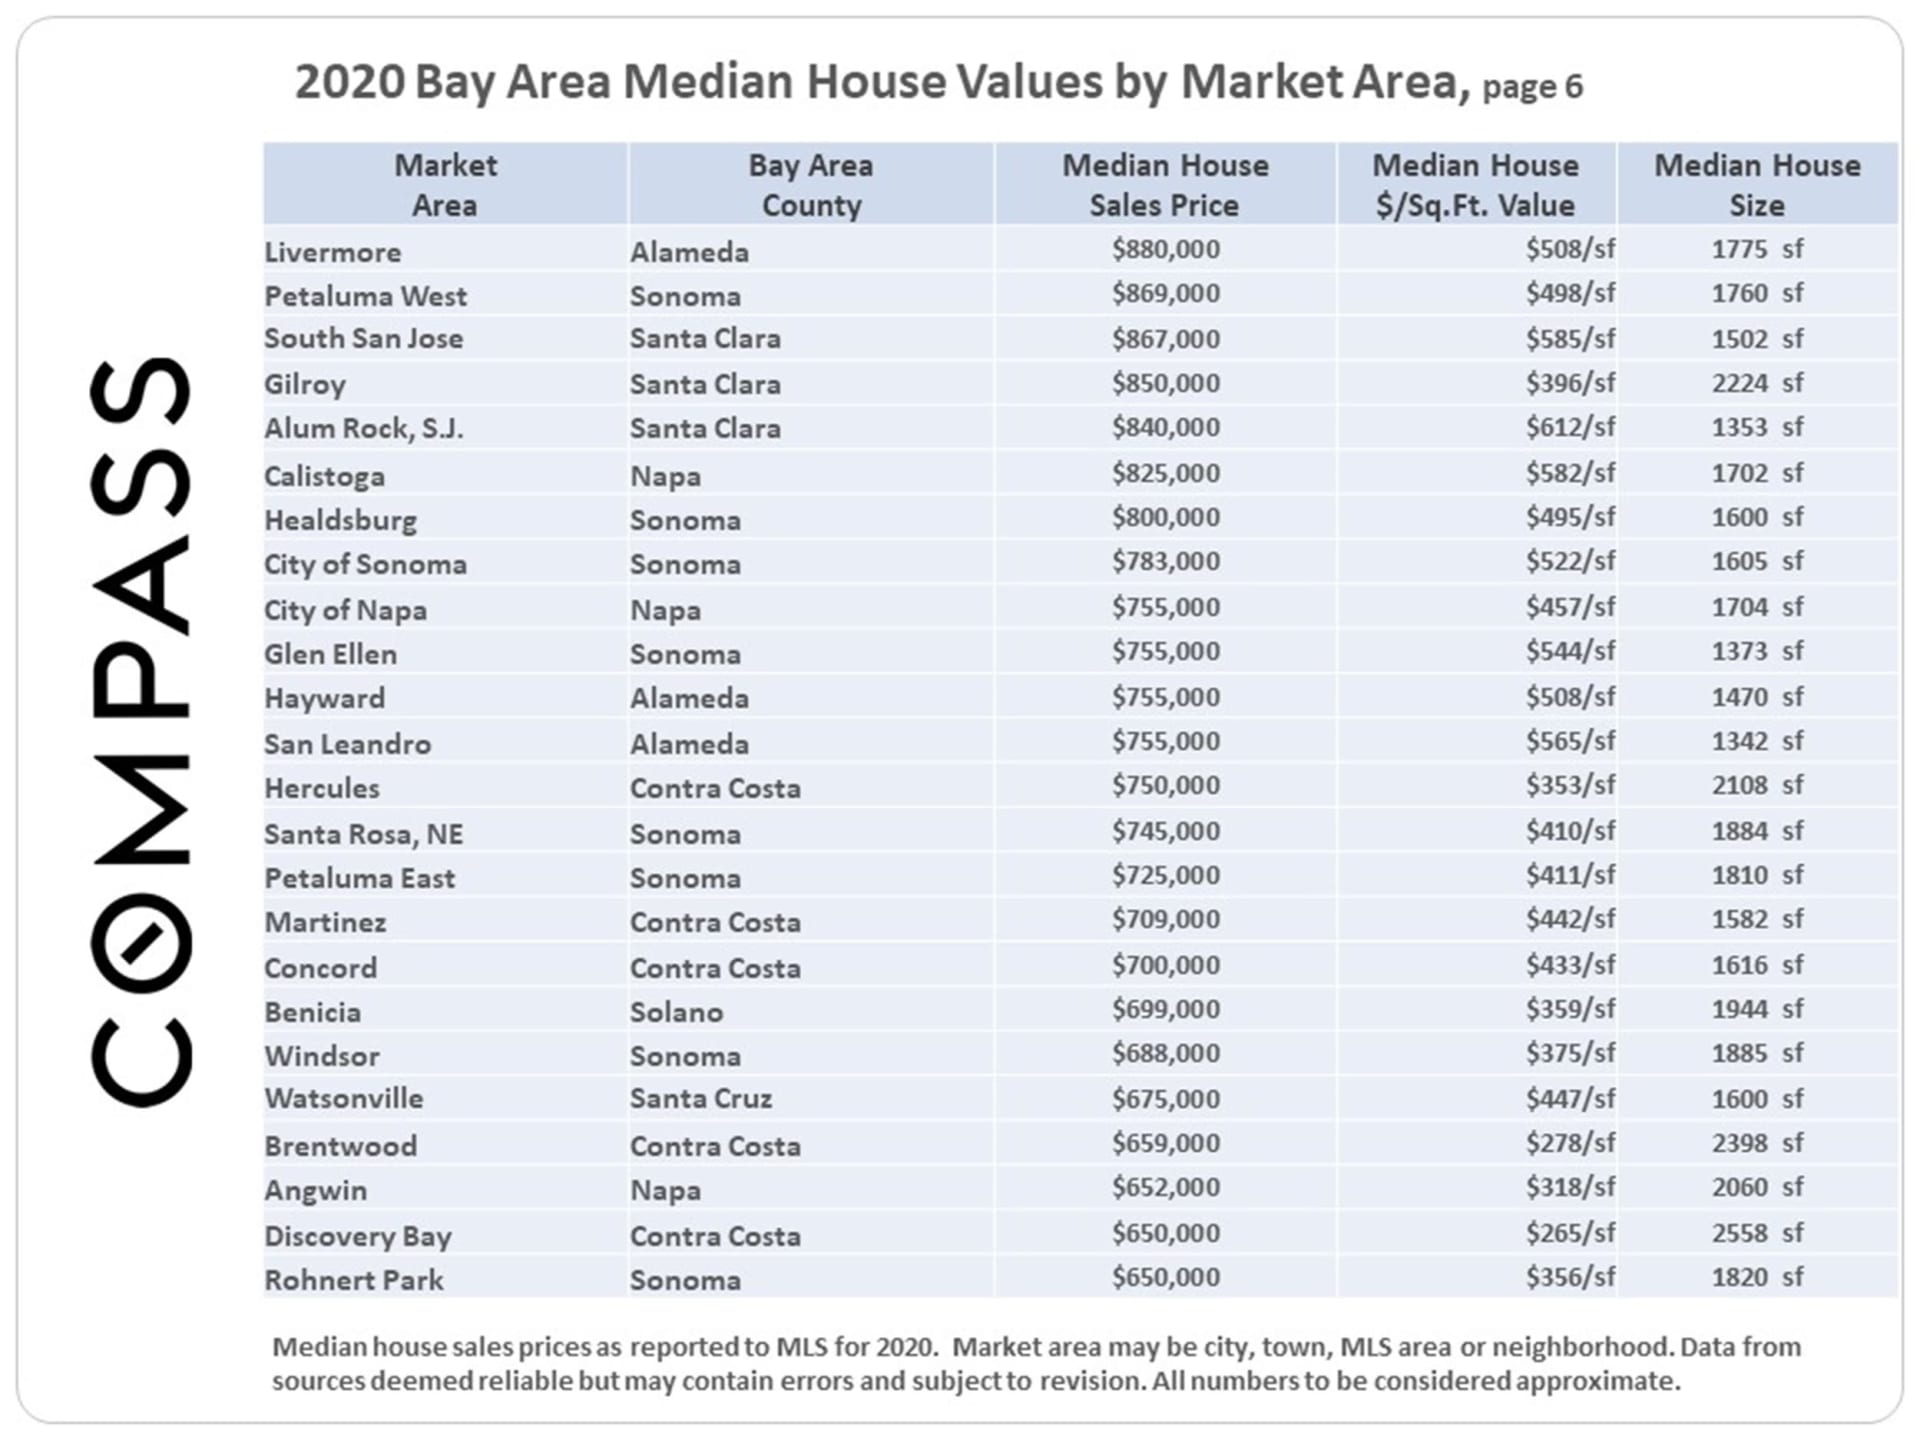
2020 Bay Area Median House Values by Market Area, page 6
2020 Bay Area Median House Values by Market Area, page 7
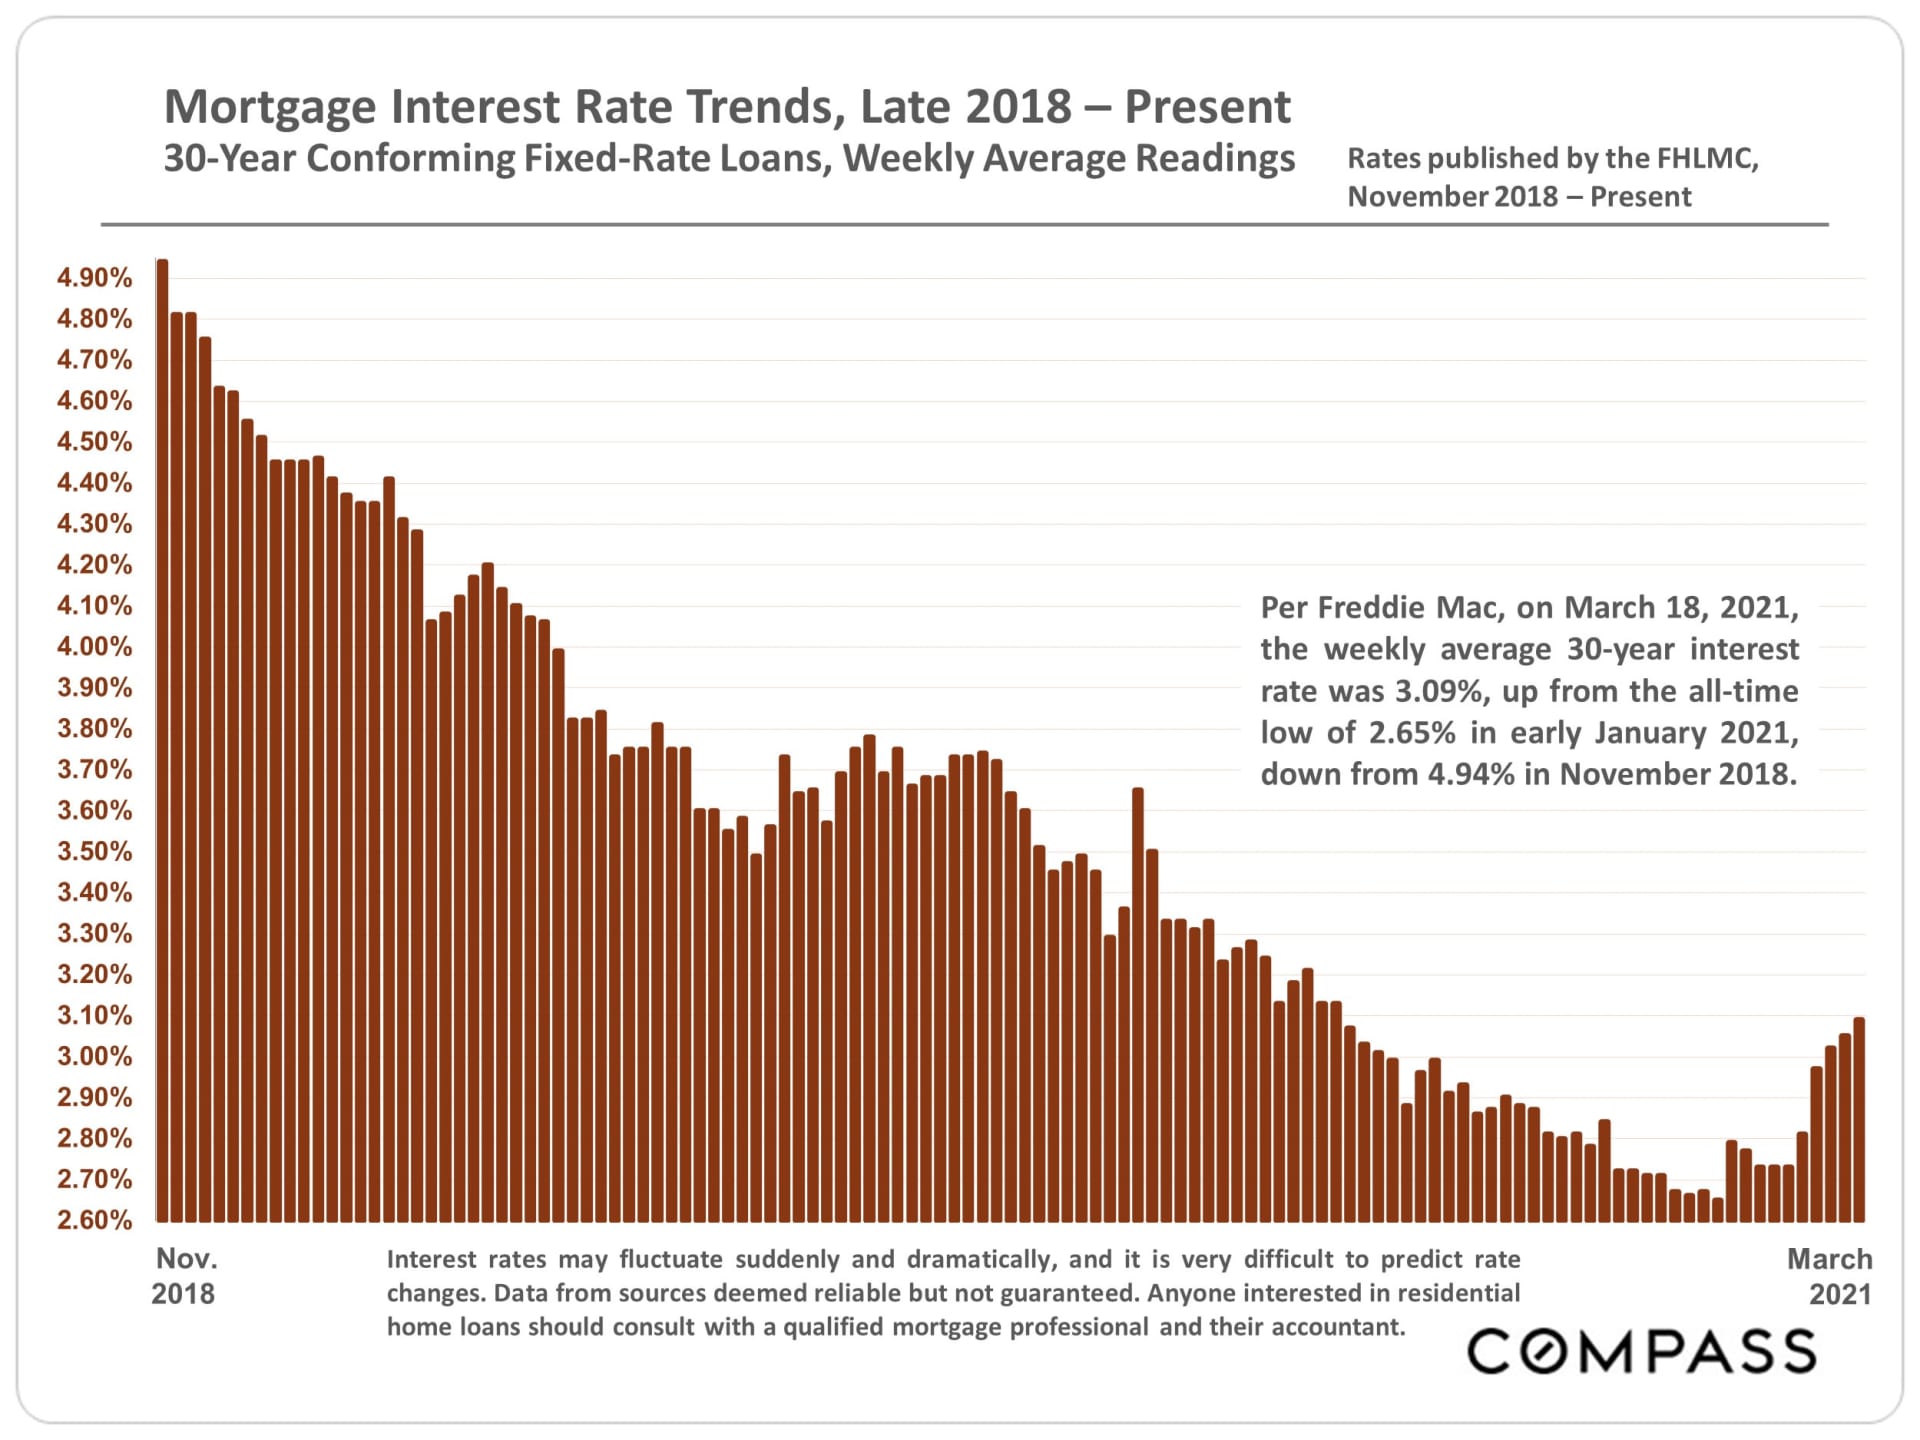
Mortgage Interest Rate Trends, Late 2018-Present
30-Year Conforming Fixed-Rate Loans, Weekly Average Readings
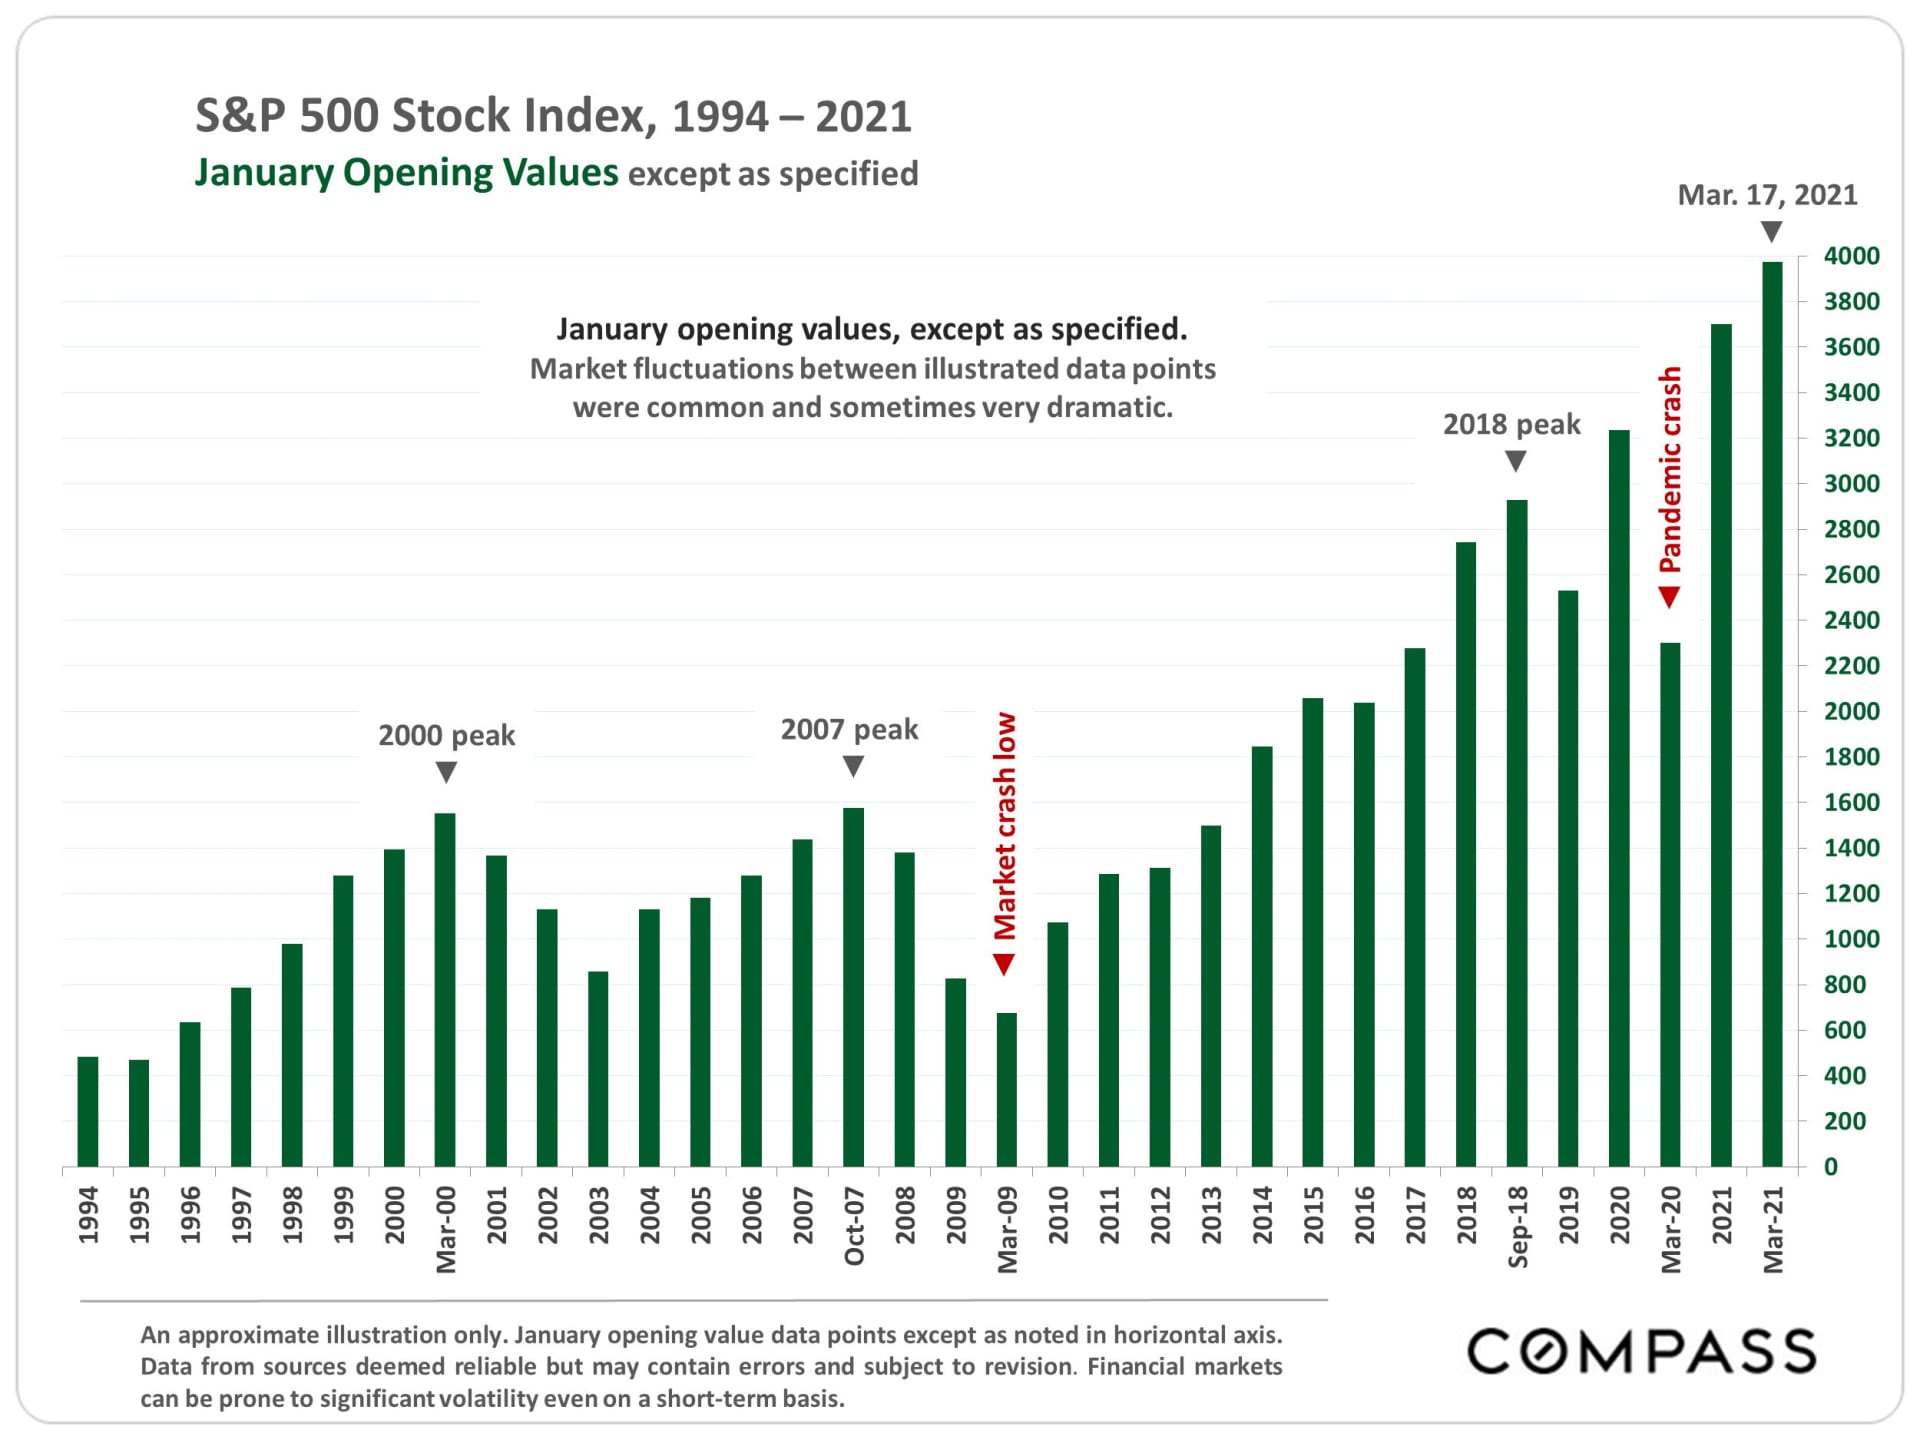
S&P 500 Stock Index, 1994-2021
January Opening Values except as specified
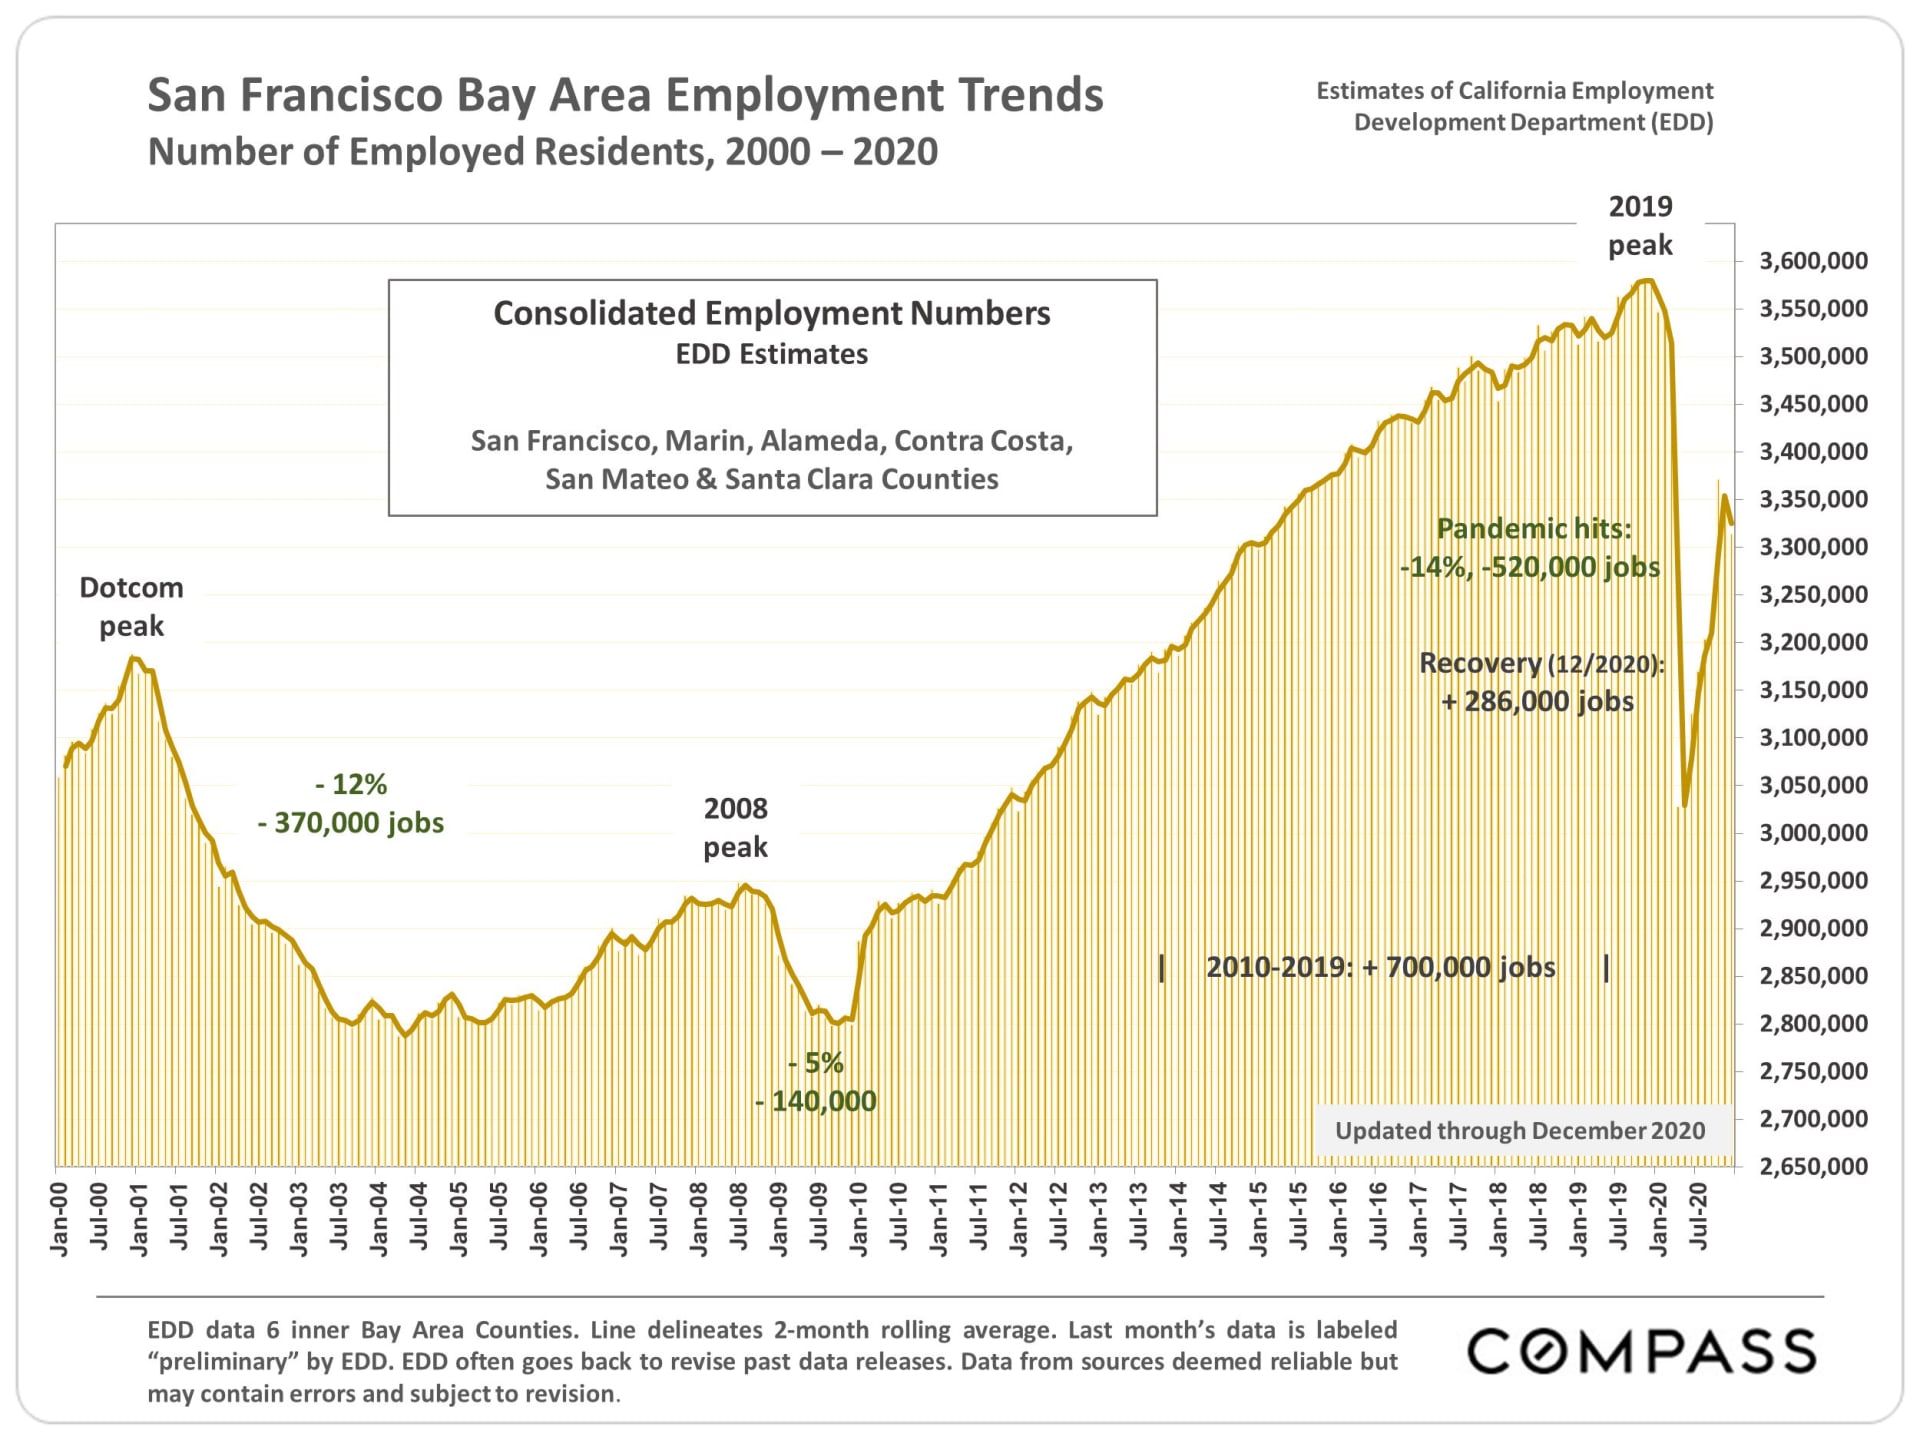
San Francisco Bay Area Employment Trends
Number of Employed Residents, 2000-2020
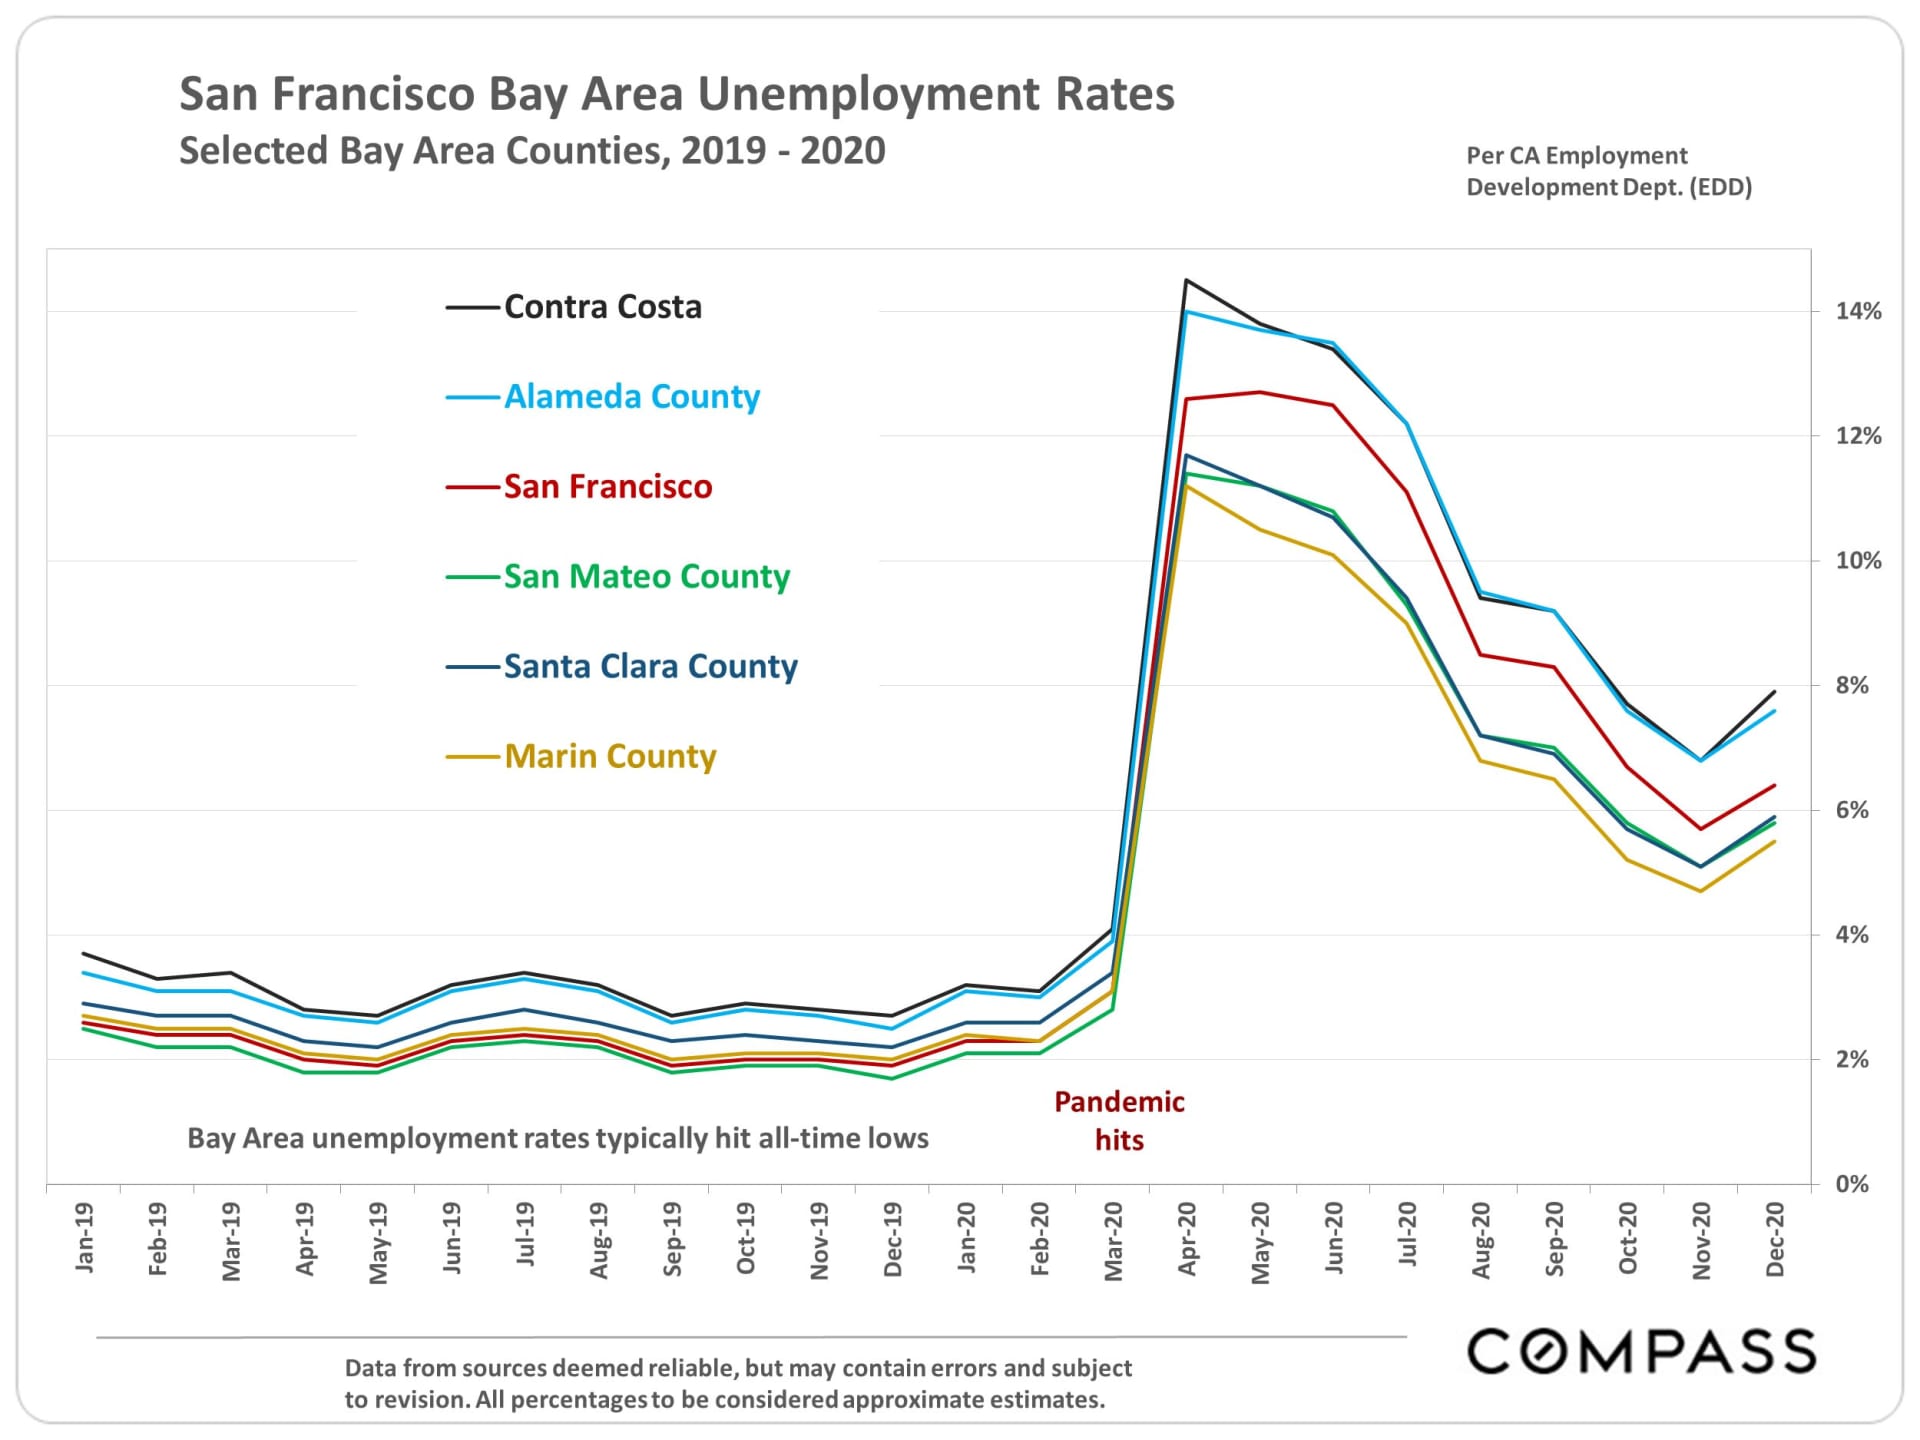
San Francisco Bay Area Unemployment Rates
Selected Bay Area Counties, 2019-2020
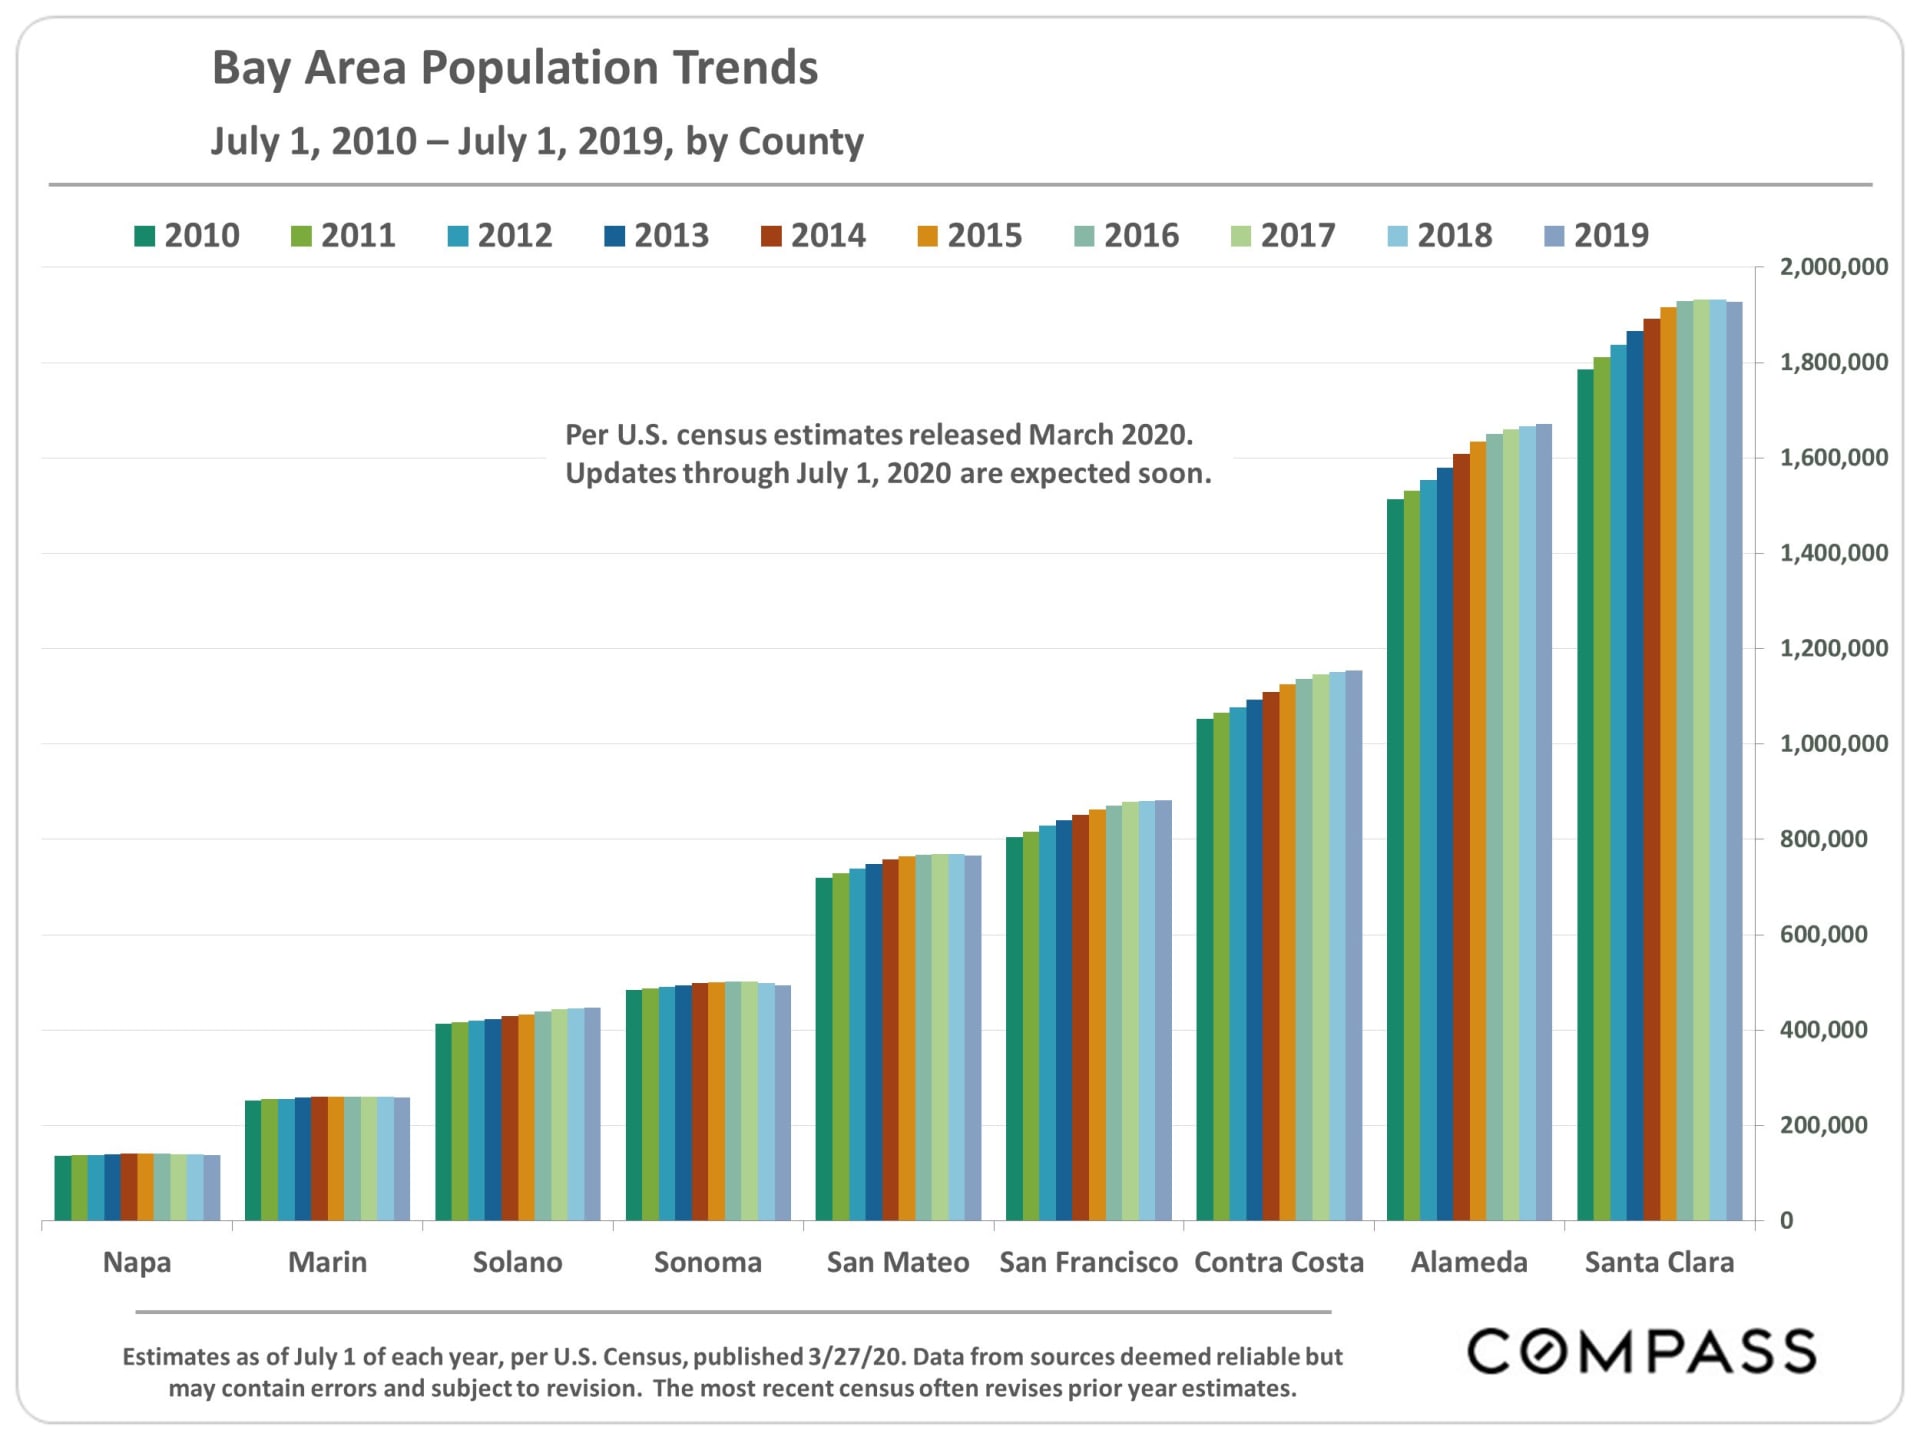
Bay Area Population Trends
July 1, 2010 - July 1, 2019, by County
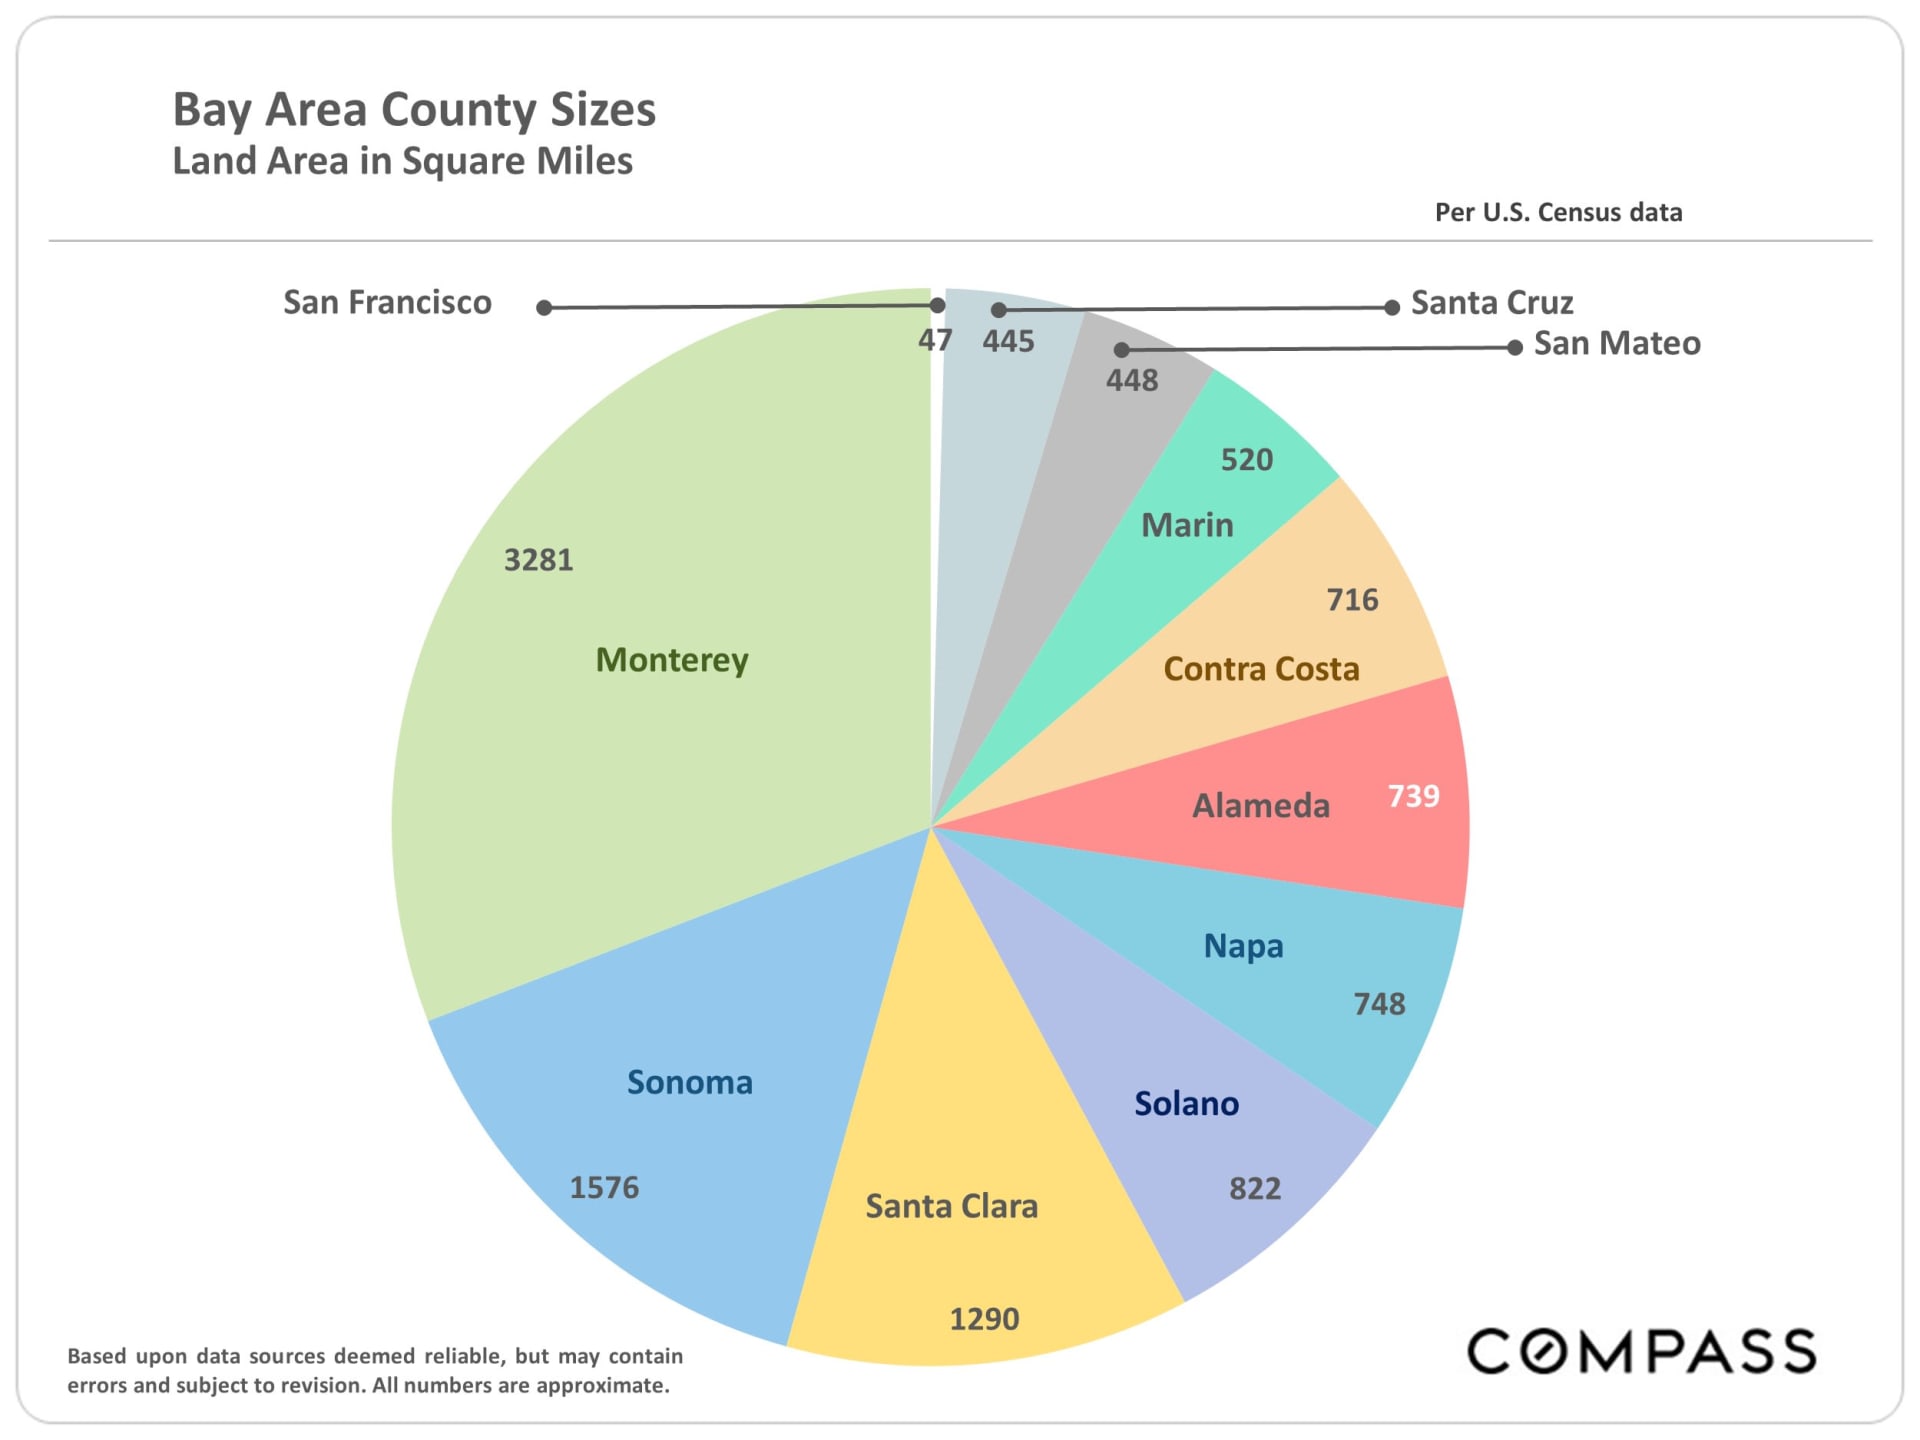
Bay Area County Sizes
Land Area in Square Miles
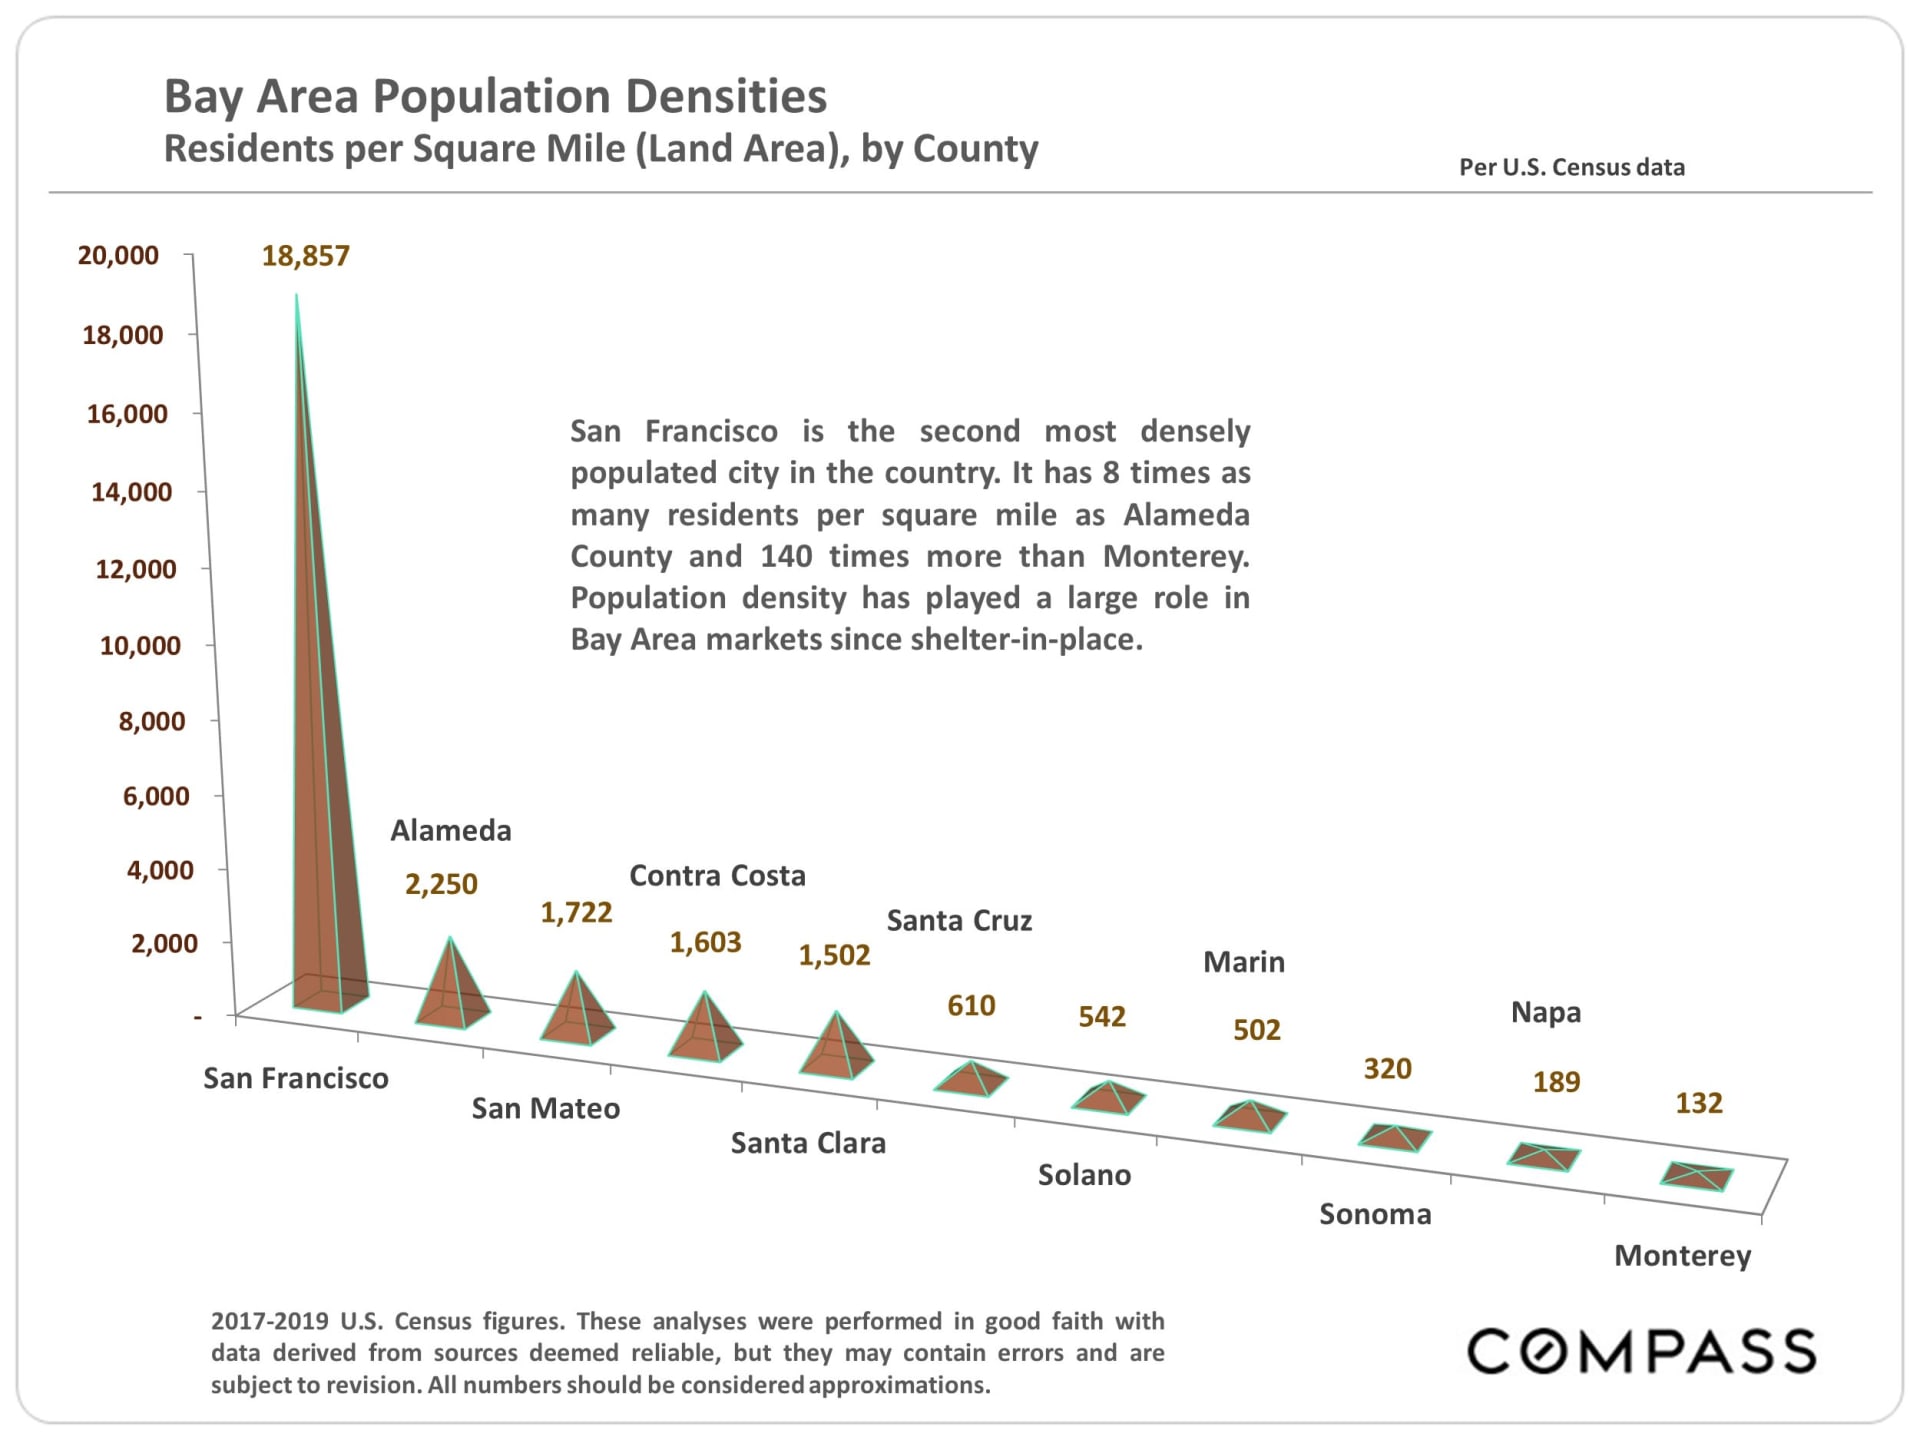
Bay Area Population Densities
Residents per Square Mile (Land Area), by County